I. INTRODUCTION
Filtered cathodic vacuum arc (FCVA) is one of the most effective ultrathin-film deposition methods. Amorphous carbon (a-C) films deposited by FCVA exhibit high purity, excellent uniformity, smoothness, high hardness, low friction, and good wear and corrosion resistance.Reference Robertson1–Reference Voevodin and Donley4 The superior nanomechanical/tribological properties of these a-C films, demonstrated by nanoindentation and nanoscratching experiments,Reference Fung, Lai, Chan, Bello, Lee, Lee, Mao and Wang5–Reference Zhang and Komvopoulos8 are mainly attributed to the high fraction of tetrahedral (sp 3) carbon atom hybridization. Carbon film structures have been traditionally studied by x-ray photoelectron spectroscopy (XPS) and Raman spectroscopy.Reference Zhang and Komvopoulos8–Reference Knight and White14 However, because the information obtained with these techniques is averaged over a depth of a few nanometers, they cannot provide insight into variations in the through-thickness structure of nanometer-thick a-C films. Although elemental depth profiles can be obtained by combining in situ high-energy Ar+ plasma sputtering with XPS, it is difficult to accurately calibrate and control the sputtering rate of ultrathin films. In addition, the intense energetic Ar+ ion bombardment during sputter etching may alter the film structure.Reference Oswald and Reiche15,Reference Poudel, Poudel, Rout, El Bouanani and McDaniel16 Detailed structural analysis of ultrathin films requires cross-section transmission electron microscopy (TEM) and microanalysis techniques of high spatial resolution, such as electron energy loss spectroscopy (EELS).
Previous EELS studies of a-C films deposited on silicon by the FCVA method under different substrate bias conditions have revealed a layered film structure consisting of interface layer, bulk film, and surface layer.Reference Zhu, Han, Han, Schlaberg and Wang11,Reference Siegal, Provencio, Tallant, Simpson, Kleinsorge and Milne17–Reference Riedo, Comin, Chevrier, Schmithusen, Decossas and Sancrotti20 According to the subplantation model,Reference Lifshitz, Kasi, Rabalais and Eckstein21 the interface layer is less dense than the bulk film and results from partial backscattering of C+ ions impinging onto the heavy Si atoms, the bulk film is due to C+ ion subplantation and is characterized by a high compressive stress, whereas the surface layer is dominated by trigonal (sp 2) carbon atom hybridization and is also less dense than the bulk film. The thickness of the interface and surface layers depends on the penetration depth of the C+ ions, which is a function of the C+ ion energy.Reference Siegal, Provencio, Tallant, Simpson, Kleinsorge and Milne17–Reference Davis, Knowles and Amaratunga19 Surface and interface layers of ∼12 and ∼3 nm thickness have been observed with 55-nm-thick a-C films deposited on Si(100) by FCVA under plasma conditions of 90 eV C+ ion energy.Reference Siegal, Provencio, Tallant, Simpson, Kleinsorge and Milne17 However, significantly thinner surface layers of thickness between 0.4 ± 0.2 and 1.3 ± 0.3 nm have been reported in other studies for C+ ion energy of 35 and 320 eV, respectively.Reference Davis, Amaratunga and Knowles18,Reference Davis, Knowles and Amaratunga19
The quality of FCVA-deposited a-C films strongly depends on the C+ ion energy. Intensification of collision cascades between C+ ions and substrate atoms with the increase of the C+ ion energy produces locally high pressures, which are conducive to sp 3 hybridization. However, high C+ ion energy may also promote thermal relaxation, resulting in sp 3-to-sp 2 rehybridization. Because of these competing processes, there is an optimum C+ ion energy (typically, ∼120 eV)Reference Robertson1,Reference Pharr, Callahan, McAdams, Tsui, Anders, Anders, Ager, Brown, Bhatia, Silva and Robertson22 for depositing a-C films of maximum sp 3 content. Most previous studies dealing with the structure of FCVA-deposited a-C films have been focused on the effect of substrate biasing, not the optimum C+ ion energy. Therefore, a principal objective of this study was to perform a detailed analysis of the through-thickness structure of ultrathin a-C films deposited by FCVA under optimum C+ ion energy conditions. Because the energy of C+ ions generated by arcing is ∼20 eV,Reference Robertson23–Reference Byon and Anders25 a bias voltage of −100 V was applied to the substrate to produce a C+ ion energy of ∼120 eV during the film deposition. High-resolution transmission electron microscopy (HRTEM) and analytical EELS were used to study the a-C film structure. Low- and high (core)-loss EELS spectra of Si and C were analyzed to determine the elemental content and through-thickness structure of ∼20-nm-thick a-C films. Calculations of atomic carbon hybridization based on EELS spectra were used to track the evolution of the film structure. The average content of carbon hybridization in the top few nanometers of the a-C film determined from the EELS analysis was also validated by XPS measurements.
II. EXPERIMENTAL METHODS
A. Film deposition by FCVA
Commercially available p-type Si(100) wafers were sectioned into 10 × 10 mm2 substrates, which were cleaned by rinsing in isopropanol and acetone for 10 min, respectively, and blow dried with nitrogen gas. After pumping down the FCVA chamber to <5 × 10⁻⁷ Torr, Ar gas was introduced in the chamber, increasing the pressure to 2 × 10⁻⁴ Torr. Then, the substrate was sputtered for 2 min with 500-eV Ar+ ions generated by a 64-mm Kaufman ion source to remove the native SiO2 layer. The incidence angle of the bombarding Ar+ ions was fixed at 60°, measured from the normal to the substrate surface. After reaching a base pressure of <5 × 10⁻⁷ Torr, carbon plasma was generated by arcing on the cathode (99.99% pure graphite) surface and was stabilized by a cusp-configuration magnetic field applied to the cathode.Reference Zhang and Komvopoulos26 Any macroparticles and/or droplets expelled from the cathode were filtered out by the magnetic field of electromagnetic coils of out-of-plane S-configuration. At the filter exit, the carbon plasma consisted of only high-purity (∼99.99%) C+ ions. To control the C+ ion energy during film deposition, a pulsed bias voltage of −100 V (time averaged) magnitude and 25 kHz frequency was applied to the substrate holder. To synthesize ultrathin a-C films, the deposition time was set at 30 s. FCVA deposition under plasma conditions of −100 V substrate bias produces ultrathin a-C films of the highest sp 3 fraction and nanohardness.Reference Zhang and Komvopoulos8 To enhance the film uniformity in the radial direction, the substrate was rotated at 60 rpm during the film deposition. More details about the FCVA system used in this study can be found elsewhere.Reference Zhang and Komvopoulos26
B. TEM and EELS analyses
Cross-sectional TEM samples were prepared by mechanical grinding and dimpling and, finally, surface finished by ion milling. The film samples were cleaved into two halves and glued face-to-face with M-bond 610 epoxy. To ensure that the EELS carbon signal was only due to the a-C film, a thin Au layer was e-beam evaporated onto the sample surface before sample bonding. More details about the preparation of the TEM samples can be found elsewhere.Reference Wang and Komvopoulos27,Reference Wan and Komvopoulos28 To minimize surface adsorption of hydrocarbon species from the ambient, the TEM samples were kept in a vacuum of <10−5 Torr and observed with the TEM within two days from fabrication.
HRTEM images and EELS spectra were obtained with a FEI Tecnai (F20 UT) microscope operated at 200 kV, using a CCD camera (2048 × 2048 pixels) positioned 42 mm behind the Gatan imaging filter. The spatial resolution of the scanning TEM (STEM), without a monochromator, is ∼0.14 nm. A 13.5-mrad C2 semi-angle and a 100-μm C2 aperture were used in this study. The EELS collection semi-angle was set at 47 mrad. Using the full width at half maximum (FWHM) of the zero-loss peak (ZLP), the energy resolution was found equal to 0.58 eV, which is sufficiently low for distinguishing sp 2 from sp 3 hybridizations, considering that the band gap difference between sp 2 and sp 3 is about 0.8–0.9 eV. ZLP and low-loss spectra were collected in 0.02 s. Because the core-edge signal is significantly weaker than elastic scattering, the Si L2,3-edge and the C K-edge were collected for 4 s to enhance the observation of fine structure details.
C. XPS analysis
A PHI 5400 XPS system (Physical Electronics, Chanhassen, MN) with conventional (nonmonochromatic) Al Kα radiation of 1486.6 eV energy and 4.8 eV work function operated under a vacuum pressure of <2 × 10⁻⁸ Torr was used to study carbon atom hybridization in the a-C films. The system has a spatial resolution of 0.5 mm and energy resolution of 0.7 eV. The spectrum of a clean Ag foil was used to calibrate the XPS system. The samples were not cleaned before the XPS analysis in order to preserve their surface elemental and chemical state and were affixed to the sample holder by conductive screws. Spectra were acquired near the fixing location to minimize possible charging effects. Multiplex narrow-scan spectra of the C1s core-level peak were acquired with a pass energy of 37.75 eV, using a channel width of 0.1 eV/step and an acquisition time equal to 50 ms/step. Spectra were collected after 60 sweeps in the binding energy range of 280–292 eV. To ensure consistency, three spectra were obtained from different locations of the same sample. Before performing narrow scanning to obtain the C1s peak, a spectrum was collected in the binding energy range of 0–1100 eV using a step of 1 eV. The O1s peak obtained from this scan was found to be at 532.0 eV, indicating negligible charging effects on the samples during the XPS analysis.
III. RESULTS AND DISCUSSION
The removal of the native SiO2 layer by highly energetic Ar+ ions may cause amorphization of the Si(100) substrate. The structure of the silicon substrate is important because it controls the initial growth of the carbon film. The bright-field, phase-contrast HRTEM image of the Si(100) substrate obtained after sputter cleaning with 500-eV Ar+ ions [Fig. 1(a)] shows the formation of a 2.5 ± 0.5-nm-thick surface layer of amorphous silicon (a-Si). Brightness differences are mainly due to density differences between Si(100) and a-Si. The HRTEM image of the a-C film deposited on the cleaned Si(100) substrate in 30 s under a substrate bias voltage of −100 V [Fig. 1(b)] shows the formation of a ∼20.9 ± 0.3-nm-thick a-C film, including an approximately 3-nm-thick interface layer of intermixed C, Si, and, possibly, SiC.
Bright-field HRTEM images of (a) Si(100) substrate after a 2-min sputter-etch with 500-eV Ar+ ions to remove the native SiO2 layer and (b) a-C film deposited in 30 s on the sputter-etched Si(100) substrate by the FCVA method under plasma conditions of optimum substrate bias voltage (−100 V). Interfaces are distinguished by dashed lines.

The elemental composition of the a-C film shown in Fig. 1(b) was studied by analytical EELS. This technique uses the energy loss of electrons passing through the specimen to determine the chemical composition and electronic structure of the specimen. Electron energy loss is mainly due to inelastic electron–electron collisions.Reference Williams and Carter29,Reference Egerton30 Beam electrons interacting with electrons of the conduction and/or valence bands of the specimen material are detected in the low-energy loss range (typically <50 eV) of the EELS spectrum. Because the electronic properties of a material are controlled by the weakly bound electrons in the conduction and valence bands, the distribution of the EELS spectrum below 50 eV provides information about specific phases or features in the TEM image.
Assuming free electrons, i.e., not bound to any specific atom or ion, the energy loss E p of beam electrons generating a plasmon frequency ωp is given byReference Williams and Carter29
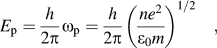 $$E_{\rm{p}} = {h \over {2{\rm{\pi }}}}{\rm{\omega }}_{\rm{p}} = {h \over {2{\rm{\pi }}}}\left( {{{ne^2 } \over {{\rm{\varepsilon }}_0 m}}} \right)^{1/2}\quad {\rm{,}}$$
where h is the Planck’s constant, e and m are the electron charge and mass, respectively, ε0 is the permittivity of free space, and n is the electron density. For single-crystal Si and a-C with a low sp 3 fraction, the plasmon peak position is typically at ∼16–17 eVReference Egerton31,Reference Olevano and Reining32 and 24–25 eV,Reference McKenzie, Muller and Pailthorpe33,Reference Duarte-Moller, Espinosa-Magana, Martinez-Sanchez, Avalos-Borja, Hirata and Cota-Araiza34 respectively, whereas for graphitic carbon and amorphous diamond, the plasmon peak position is at 26–27 and 30–33 eV, respectively.Reference Duarte-Moller, Espinosa-Magana, Martinez-Sanchez, Avalos-Borja, Hirata and Cota-Araiza34,Reference Berger, McKenzie and Martin35 The film structure can be examined by studying the through-thickness variation of the plasmon peak position.
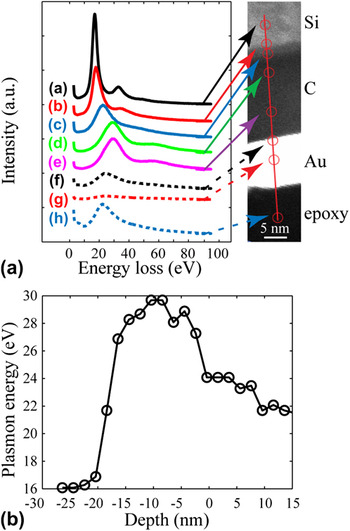
Since the energy-loss spectrometer is susceptible to external fields and the ZLP shifts over time, each EELS spectrum was calibrated by shifting the ZLP to the zero position. Figure 2(a) shows a cross-sectional STEM image and several EELS spectra obtained from different locations in the depth direction of the TEM sample. Spectrum (a) with a plasmon peak at ∼16 eV corresponds to the Si(100) substrate. Location (b) is on the line of maximum contrast between Si(100) and amorphous structures. The plasmon peak position in spectrum (b) is slightly above 16 eV and its lower intensity [than that in spectrum (a)] indicates a weaker Si signal. The large shift of the plasmon peak of spectrum (c) to ∼21.7 eV is attributed to the contribution of plasmon signals from both Si and C. The contribution of Si features to the electron energy loss decreases, whereas that of C features intensifies with increasing depth distance. The change from spectrum (b) to spectrum (c) reveals the existence of a thin interfacial region with gradually changing C and Si contents. The spectra obtained away from this interfacial region, i.e., spectra (d) and (e), have very similar distributions and plasmon peak centered at ∼29 eV. These spectra correspond to the bulk of the carbon film and are representative of steady-state film growth. A plasmon peak position close to that of diamond indicates a high fraction of sp 3 hybridization. The plasmon peak position in spectrum (f), corresponding to the film surface, is at ∼24 eV, which is close to that of graphitized carbon. This implies that the surface structure of the carbon film is dominated by sp 2 hybridization. The gold layer shows a very weak plasmon signal [spectrum (g)], indicating insignificant hydrocarbon contamination of the TEM specimen. The plasmon peak in the epoxy spectrum (h) is centered at ∼22 eV.
(a) EELS spectra obtained from different locations across the interface of the Si(100) substrate and the a-C film, shown in the z-contrast STEM image on the right. The brightest region corresponds to the evaporated Au layer, used to distinguish the a-C film surface from the epoxy surface. The spectra were calibrated by shifting the ZLP to 0 eV. Local electronic change at the atomic level is discerned based on the position of the plasmon peak. (b) Depth profile of the plasmon peak position.

To quantify changes in the plasmon peak position in the depth direction of the cross-sectional TEM sample, EELS spectra were obtained at depth increments of 2 nm. Figure 2(b) shows the variation of the plasmon peak position in the depth sample direction after ZLP calibration. The zero-depth position corresponds to the location showing the highest contrast between the carbon film and the gold layer, i.e., the film surface. The low-energy-loss range (<50 eV) reveals a multilayered structure consisting of single-crystal Si, amorphous C, Si, and, possibly SiC (interface layer), graphite-like carbon (buffer layer), diamond-like carbon (bulk film), and graphite-like carbon (surface layer).
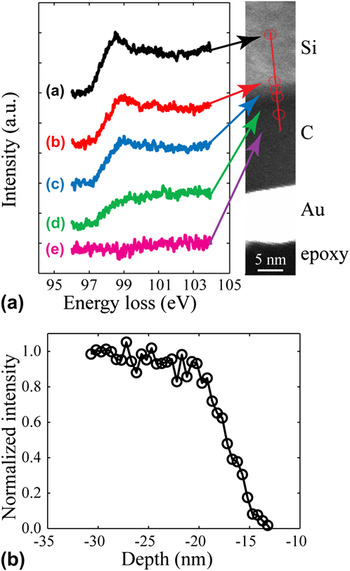
The high-energy-loss range (>50 eV) contains information about inelastic interactions between beam electrons and inner (core–shell) electrons. Thus, information about the elemental composition can be extracted from the ionization edges. Since the interface layer was found to consist of C and Si, its elemental concentration was determined from the core-loss energy of the Si L2,3 peak centered at 99 eV along a 20-nm-long scan line using a step size of 0.5 nm. The silicon concentration was calculated as the ratio of the Si L2,3 peak intensity in the spectrum of the interface layer to that in the spectrum of the single-crystal Si(100) region. Figure 3(a) shows high-energy-loss spectra obtained from different locations after background subtraction. Spectra (a) and (b) correspond to the Si(100) substrate, and their similar distributions and strength intensities indicate similar structures and compositions. A comparison of spectra (c)–(e) shows a profound decrease in the intensity of the Si L2,3 peak. This trend is attributed to the continuously decreasing Si concentration through the interface layer and toward the interface with the bulk film. The normalized intensity of the Si L2,3 peak [defined as the ratio of the area under the EELS spectra from 94 to 104 eV to the corresponding area of the Si(100) spectrum] as a function of depth is shown in Fig. 3(b). Because all of the measurements were obtained along a very short distance (20 nm), variations in the specimen thickness are negligible and changes in the signal intensity are only due to the relative concentration of Si. The transition band has a thickness of ∼4.5 nm, which is slightly larger than that of the a-Si layer on the Si(100) substrate [Fig. 1(a)]. This difference may be attributed to the bombardment effect of energetic C+ ions during the initial stage of film deposition, resulting in C implantation into the Si substrate and, in turn, thickening of the a-Si layer at the Si(100) substrate/a-C film interface.
(a) Si L2,3-edge spectra obtained from different locations across the interface of the Si(100) substrate and the a-C film, shown in the STEM image on the right. The spectra were calibrated by shifting the Si L2,3-edge to 99 eV after background subtraction. (b) Depth profile of the normalized intensity of the Si L2,3-edge.

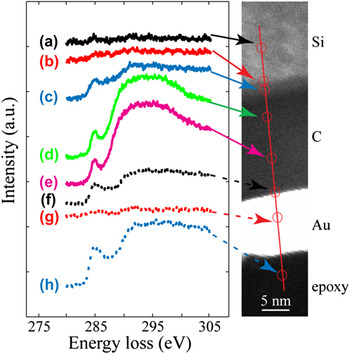
Figure 4 shows high-energy-loss spectra of the C K-edge obtained in the depth direction of the cross-sectional TEM sample using a step size of 0.5 nm. The locations from where these spectra were obtained are very close to those shown in Fig. 2(a). Spectra locations were slightly offset during the acquisition of the low- and high-energy-loss spectra to avoid sample damage and/or carbon re-deposition from previous spectra acquisitions. All C K-edge spectra were calibrated by centering the π* peak at 285 eV. As expected, spectra (a) and (b) of the Si(100) substrate are featureless. However, spectrum (c) of the interface layer contains a small π* peak and a well-defined σ* peak, both attributed to electron beam interactions with C atoms. The similar distributions and significantly intensified peaks of spectra (d) and (e) indicate a high carbon concentration in the bulk film. The decrease of the signal intensity at the film surface and the dominance of the π* peak in the corresponding spectrum (f) suggest that carbon atom hybridization at the film surface is predominantly sp 2. The gold layer does not produce C K-edge signal [spectrum (g)], while the epoxy shows a strong π* peak and a weak σ* peak [spectrum (h)], as expected. Information about the chemical composition and carbon hybridization of the a-C film derived from Fig. 4 is in good agreement with that obtained from Fig. 2(a).
C K-edge spectra obtained from different locations across the interface of the Si(100) substrate and the a-C film, shown in the STEM image on the right. The spectra were calibrated by shifting the π* peak of all C K-edge spectra to 285 eV after background subtraction.

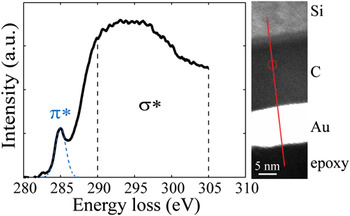
EELS spectra in the range of 280–305 eV were analyzed to determine the sp 2 and sp 3 fractions in the a-C film. Figure 5 shows a representative high-energy-loss spectrum of the a-C bulk film. The location in the bulk film from where the spectrum was obtained is marked by a circle in the STEM image shown on the right. The peak at 285 eV is due to the excitation of electrons from the ground-state 1s core levels to the vacant π* states. The π* peak is fitted with a Gaussian distribution, while the σ* peak is integrated within the small energy window from 290 to 305 eV to minimize plural scattering effects. The area ratio of these two peaks is proportional to the relative number of π* and σ* orbitals.Reference Cuomo, Doyle, Bruley and Liu36 The fraction of sp 2 bonded carbon atoms x is given byReference Cuomo, Doyle, Bruley and Liu36
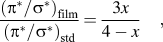 $${{\left( {{\rm{\pi }}^* /{\rm{\sigma }}^* } \right)_{{\rm{film}}} } \over {\left( {{\rm{\pi }}^* /{\rm{\sigma }}^* } \right)_{{\rm{std}}} }} = {{3x} \over {4 - x}}\quad ,$$
where the standard (std) sample is assumed to be pure graphite with 100% sp 2 atomic carbon hybridization.
Decomposition of the C K-edge spectrum of the bulk film into π* and σ* peaks. The location in the bulk film from where the spectrum was obtained is marked by a circle in the STEM image shown on the right. The π* peak is represented by a Gaussian distribution from 282 to 287.5 eV, whereas the σ* peak is defined as the spectrum in the energy loss range of 290–305 eV.

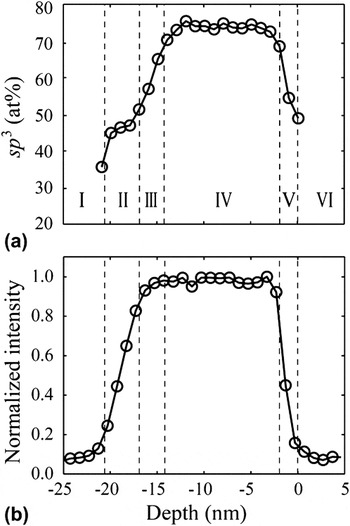
Figure 6(a) shows a depth profile of the sp 3 fraction calculated from the C K-edge spectra using Eq. (2). Similar to the Si L2,3-edge, the C K-edge intensity was calculated by integrating the spectrum from 280 to 305 eV. The depth profile of the normalized C K-edge intensity is shown in Fig. 6(b). The sp 3 fraction [Fig. 6(a)] and carbon concentration [Fig. 6(b)] reveal the existence of six distinctly different regions through the sample thickness. Data points of the sp 3 fraction are not shown in region I because the C signal intensity is almost zero in the Si(100) substrate. Region II represents the ∼4.5-nm-thick interface layer and is characterized by an increasing C concentration and a merely constant sp 3 fraction of ∼45.0 ± 5.8%. In the ∼2-nm-thick carbon layer above the interface layer (region III), the carbon intensity reaches a maximum, while the sp 3 fraction increases from ∼45 to ∼70%. Region IV corresponds to a ∼12.5-nm-thick bulk a-C film with a constant sp 3 fraction equal to 73.2 ± 1.9%. The sp 3 fraction in the ∼1.5-nm-thick surface layer of the a-C film (region V) rapidly decreases to 50.6 ± 3.3% toward the surface. Region VI represents a gold layer separating the a-C film from the epoxy glue. Because of the low carbon signal produced by the gold layer, data of the sp 3 fraction are not shown in region VI.
Depth profiles of (a) sp 3 fraction calculated from the C K-edge spectra and (b) normalized intensity of the C K-edge. Boundaries of neighboring regions are distinguished by dashed lines.

Different from the traditional three-layer model of carbon films deposited by energetic carbon ions,Reference Siegal, Provencio, Tallant, Simpson, Kleinsorge and Milne17–Reference Davis, Knowles and Amaratunga19,Reference Lifshitz, Kasi, Rabalais and Eckstein21 a fourth (buffer) layer of thickness ∼2 nm (region III) is observed between the interface layer and the bulk film. The buffer layer exhibits a very high carbon concentration (>95%) and its sp 3 fraction increases from the substrate interface toward the bulk film interface. The observed four-layer structure of the ultrathin a-C film can be explained by the following film-growth model. The initial stage of film deposition is dominated by energetic C+ ion backscattering from and penetration into the a-Si surface layer of the substrate, resulting in the growth of an interface amorphous layer consisting of intermixed C, Si, and, possibly, SiC. This interface layer exhibits a relatively low sp 3 fraction because of the low carbon concentration. Although the structure of SiC is similar to that of an sp 3 hybridized carbon structure, the ionization energy of C1s core-level electrons of carbidic components is usually in the range of 282.3–283.4 eV with a broad FWHM of ∼2 eV,Reference Iwanowski, Fronc, Paszkowicz and Heinonen37 which is significantly lower than the ionization energy of sp 3 carbon atom hybridization. Thus, the presence of some SiC in the interface layer should not affect the sp 3 fraction. This explains the low sp 3 concentration in the interface layer (region II), despite the possible existence of SiC. The arrival of more C+ ions leads to the formation of a thin buffer layer of pure carbon (region III) on top of the interface layer. However, because the C+ ion penetration depth exceeds the initial thickness of the buffer layer, some of the impinging C+ ions are backscattered by Si atoms in the interface layer. Since the probability of C+/Si interaction decreases with the thickness of the buffer layer, the sp 3 fraction exhibits a positive gradient toward the interface of the buffer layer with the bulk film. When the thickness of the buffer layer exceeds the penetration range of the C+ ions, only carbon–carbon interactions occur and localized compressive stresses induced by the subplantation process promote sp 3 hybridization. The resulting steady-state film growth conditions lead to the formation of the bulk film with constant and high sp 3 content (region IV). However, because the bulk film surface experiences relatively less C+ ion bombardment, a surface layer with increased sp 2 content and thickness about equal to the C+ ion penetration (region V) forms in the final stage of film deposition.
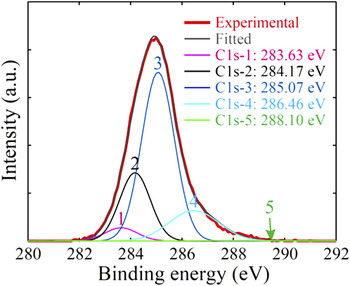
The sp 3 fraction was also calculated from the C1s core-level XPS spectrum shown in Fig. 7. The C1s peak was deconvoluted by five Gaussian distributions corresponding to sp 1 (C1s-1), sp 2 (C1s-2), sp 3 (C1s-3), C–O (C1s-4), and C=O (C1s-5) carbon bonding. Details about the deconvolution method can be found elsewhere.Reference Wang and Komvopoulos27,Reference Wan and Komvopoulos38 The sp 3 fraction is usually defined as the ratio of the area under the corresponding distribution to the sum of the areas under the sp 2 and sp 3 distributions. On the basis of this definition, the sp 3 fraction determined from XPS analysis is equal to 73.9 ± 1.5%. However, in the EELS C K-edge spectrum, only the π* and σ* peaks were used to represent the sp 2 and sp 3 hybridizations, respectively, whereas the XPS C1s spectrum was deconvoluted by five Gaussian distributions. Thus, to compare EELS with XPS results, it is necessary to define the sp 3 fraction as the ratio of the area under the sp 3 distribution to the sum of the areas of the five Gaussian distributions used to deconvolute the C1s peak. Using this definition, the sp 3 fraction is found equal to 58.7 ± 0.8%, which is significantly lower than the value (73.2 ± 1.9%) calculated from the EELS C K-edge spectrum.
C1s core-level XPS spectrum of a-C film after Shirley inelastic background subtraction with five fitted Gaussian distributions corresponding to sp 1, sp 2, sp 3, C–O, and C=O carbon bonding.

This discrepancy is expected because XPS is a surface-sensitive method. The XPS signal from the subsurface is attenuated due to inelastic scattering of photoelectrons traveling through the specimen. The probability of a single photoelectron scattering event can be estimated by
 $$P\left( x \right) = e^{ - x/{\rm{\lambda }}} \quad ,$$
where x is the distance traveled and λ is the inelastic mean free path of a photoelectron. For x = λ and 3λ, Eq. (3) gives P(λ) = 0.368 and P(3λ) = 0.05, respectively, implying 63.2% and 95% of the photoelectrons detected originate from within distances λ and 3λ below the sample surface, respectively. The inelastic mean free path for carbon materials and 1486.6 eV photoelectron energy is typically in the range of 1–3.5 nm.Reference Tanuma, Powell and Penn39,Reference Gries40 Assuming λ = 1.5 nm, which is equal to the thickness of the surface layer, a linear relation between sp 3 fraction and XPS signal intensity, and using the sp 3 fraction of the surface layer and the bulk film determined from the EELS analysis (50.6 ± 3.3% and 73.2 ± 1.9%, respectively), the sp 3 fraction of the a-C film is 63.2% × 50.6% + (1–63.2%) × 73.2% = 58.92%, which is close to the value (58.7 ± 0.8%) predicted by XPS. The significantly lower sp 3 fraction obtained from the XPS analysis provides supportive evidence of the formation of a thin surface layer of significantly lower sp 3 fraction than that of the bulk a-C film.
IV. CONCLUSIONS
The structure of ultrathin a-C films synthesized by FCVA deposition under plasma conditions of optimum substrate bias voltage was studied in the light of TEM, EELS, and XPS results. The plasmon excitation energy position in low-energy-loss spectra revealed a multilayered film structure. Depth profiles of carbon atom concentration and sp 3 carbon hybridization obtained from the analysis of high-energy-loss spectra showed that the film structure consists of a ∼4.5-nm-thick interface layer (a mixture of C, Si, and, possibly, SiC), a ∼2-nm-thick buffer layer of pure carbon with outwardly increasing sp 3 fraction, a ∼12.5-nm-thick bulk film of constant and high sp 3 fraction (∼74%), and a ∼1.5-nm-thick surface layer of high sp 2 content. XPS results confirmed the sp 3 fraction calculated from the C K-edge EELS spectrum. The buffer and surface layers possess a similar thickness that depends on the C+ ion penetration depth, which is controlled by the kinetic energy of the bombarding C+ ions. The results of this study show that the minimum thickness of a-C films deposited by FCVA under conditions of optimum substrate bias (−100 V) is equal to 3–3.5 nm, which is the total thickness of the buffer and surface layers. The a-C film thickness can be further decreased by considering the effects of other important FCVA process parameters on film growth, such as the incidence angle effect of energetic C+ ions bombarding onto the growing film surface.Reference Wang and Komvopoulos27
ACKNOWLEDGMENTS
This research was funded by the Computer Mechanics Laboratory (CML) and the UCB-KAUST Academic Excellence Alliance (AEA) Program. TEM and XPS studies were performed at the National Center for Electron Microscopy and the Molecular Foundry, respectively, of the Lawrence Berkeley National Laboratory.