Introduction
Since the discovery of activated carbon fiber (ACF), its role as an adsorbent for dyes, pesticides, heavy metals, and volatile organic compounds has been widely exploited. Indeed, it possesses remarkable features such as high surface area and excellent microporosity that lead to a faster reaction and lower mass transfer resistance. Despite its use in various applications, it lacks specificity due to wide acceptance of all organic and inorganic contaminants into fiber matrix which clog the pores setting stringent conditions for desorption process.[ Reference Suzuki 1 – Reference Subrenat and Le Cloirec 3 ] Transforming ACF into a photocatalyst caters the needs of environmental industry with the advantage of developing an adsorbent along with degradation capability.[ Reference Chen, Wang, Shen, Song, Chen and Yang 4 , Reference Thi and Lee 5 ] In this context, it is essential to develop a stable composite with ACF possessing photocatalytic properties. ACF with its large surface area permits the physical attachment of a wide variety of materials on the surface. However, the probability of strong chemical attachment is less than uncarbonized fiber due to the presence of only meager functional groups. A wide range of techniques is available for the treatment of carbon material, including plasma spraying, electroplating, magnetron sputtering,[ Reference Zhang, Wang and Yi 6 ] which is not economically feasible techniques. However, treatment via acid/alkali is a cost-effective and feasible method to enrich the material with a specific functional group. Acid treatment or oxidation of the carbon surface introduces carboxylic, lactonic and phenolic groups.[ Reference Fallah and Azizian 7 ] Although, hydrogen peroxide (H2O2) is a good oxidizing agent, its efficiency in oxidizing the carbon surface is dominated by nitric acid (HNO3).[ Reference Aggarwal, Goyal and Bansal 8 ] Hydrothermal carbonization has gained popularity in recent years for the development of activated carbon with oxygen functional groups.[ Reference Jain, Balasubramanian and Srinivasan 9 , Reference Hu, Wang, Wu, Yu, Antonietti and Titirici 10 ] Nonetheless, post-treatment of carbon materials via hydrothermal technique has attracted little attention.
Recent advances in carbon industry focus on incorporation or impregnation of semiconductor metal oxides for the environmental cleanup process. Zinc oxide (ZnO) nanoparticles find a significant place in semiconductor industry due to its wide band gap of 3.37 eV, high exciton binding energy (60 meV), low cost, and low toxicity.[ Reference Jung, Oh, Lee, Yang, Park, Park and Jeong 11 , Reference Wang, Qu and Wu 12 ] However, it is important to consider the constraints involved in using ZnO as a photocatalyst since it can hold up the activity. Electron–hole recombination and nanoparticle agglomeration are the two main difficult situations to be overcome for efficient photocatalysis.[ Reference Yukawa, Yamamoto, Ozawa, Emori, Ogawa, Yamamoto, Fujikawa, Hobara, Kitagawa, Daimon and Sakama 13 , Reference Ilyas, Pendyala and Marneni 14 ] Modification of ACF by ZnO facilitate continuous electron transfer from ZnO to generate superoxide and hydroxyl radical which is otherwise hindered by electron–hole recombination. At the same instance, the dilemma of nanoparticle agglomeration is solved by fixation of the same on ACF. Consequently, the mutual role of ZnO and ACF facilitate adsorption as well as degradation of organic pollutants.[ Reference Chen, Wang, Shen, Song, Chen and Yang 4 , Reference Thi and Lee 5 ] Moreover, fabric nature of the catalyst obviates the need for filtration, and hence negligible efforts to separate it from the contaminated solution. Therefore, the efficiency of photocatalyst occurs at the expense of proper impregnation of ZnO on ACF. Several techniques have been investigated for the deposition of ZnO on carbon fibers, including hydrothermal,[ Reference Chen, Wang, Shen, Song, Chen and Yang 4 , Reference Thi and Lee 5 ] sol–gel,[ Reference Shao, Wei, Zhang, Cai and Jiang 15 ] electrochemical deposition, and thermal oxidation.[ Reference Tonezzer and Lacerda 16 ] The hydrothermal method being a solution-based technique arises to be a viable option for material impregnation due to its simplicity, cost-effectiveness and low-temperature processing conditions.[ Reference Jain, Balasubramanian and Srinivasan 9 , Reference Hu, Wang, Wu, Yu, Antonietti and Titirici 10 ] Moreover, the hydrothermal method has attracted a lot of attention in nanoparticle synthesis since the particle morphology can be controlled by varying solution temperature, pH, and reaction time. Few researchers have demonstrated the potential of ZnO-impregnated ACF in dye degradation, antibiotic removal, heavy metal removal, and capacitive deionization.[ Reference Chen, Wang, Shen, Song, Chen and Yang 4 , Reference Thi and Lee 5 , Reference Mosayebi and Azizian 17 , Reference Myint, Al-Harthi and Dutta 18 ] Organophosphorus (OP) compounds are one among the environmental contaminants present typically in agricultural runoff and soil. They are toxic to humans as its inhibitory effect on acetylcholine esterase enzyme hinders the proper functioning of the nervous system.[ Reference Meng, Yang, Zhang, Dong and Shu 19 , Reference Kralj, Franko and Trebse 20 ] Adsorption, biodegradation, and radiolysis are some of the methods used for decontaminating pesticides in aqueous solution.[ Reference Donia, Atia, Hussien and Rashad 21 – Reference Mohamed, Basfar, Al-Kahtani and Al-Hamad 23 ] The limitations of the first two methods are time-consuming, whereas the latter requires high-energy radiations.
Based on the above-mentioned prolog, we address the effect of post-treatment on ACF by the hydrothermal approach and its respective physicochemical changes. Moreover, the present research considers the unique properties of ACF as well as ZnO and attempts to develop ZnO/ACF composite by a hydrothermal route. We have also studied the dependence of neutral pH and alkaline pH on the morphology of ZnO. Hitherto, no research works have been so far reported the use of ZnO/ACF composite for degradation of OP compounds. Malathion, a widely used OP pesticide has been chosen as the target compound in this study. Also, we demonstrate the use of ZnO/ACF for the mineralization of malathion by sequential use of ultrasonic waves and ultraviolet (UV) radiations.
Experimental section
Materials
Polyacrylonitrile-based activated carbon cloth used in the present work was provided by Taiwan Carbon Technology Co. Ltd. The fiber showed a Brunauer–Emmet–Teller (BET) surface area and average pore size of 1090 ± 10 m2/g and 2 nm, respectively. All the chemicals were of analytical grade purchased from Merck and used without purification. Analytical grade pesticide was purchased from Sigma-Aldrich. Double distilled water was used throughout the experiments.
Treatment of ACF
Four pieces of ACF (3 × 3 cm2) was rinsed with 100 mL of 10% HCL (hydrochloric acid) and several times with water to remove the trace contaminants and dried at 90 °C for 24 h. The cleaned fabrics were then immersed in different concentration of HNO3 (1, 3, and 5 M) and kept in a sealed container at 90 °C for few hours. Further, the fabrics were dried in an oven at 90 °C and kept in desiccators until usage. The fabrics were designated as ACF-0, ACF-1, ACF-3, and ACF-5 depending on the concentration of HNO3.
Impregnation of ZnO on ACF
ACF with a higher amount of acidic groups was dip coated in seed solution prepared by mixing zinc acetate and sodium hydroxide in ethanol in a preheated water bath at 80 °C. Further, the samples were rinsed with water and dried in an oven at 95 °C. The seeded ACF was then suspended in growth solution contained in a Teflon-lined autoclave. The growth solution was prepared by mixing zinc nitrate hexahydrate and hexamethylenetetramine at equimolar concentration.[ Reference Athauda, Hari and Ozer 24 ] Initial pH of the growth solution was adjusted to neutral and alkaline using ammonia. The seeded ACF and ACF developed after ZnO growth were denoted as S-ACF and ZnO/ACF, respectively.
Characterization of the fabric
The carbon content of pristine ACF and acid-treated ACF was determined using a multi N/C 3100 total organic carbon (TOC) analyzer (Analytic Jena). About 10 mg of the samples were weighed and placed in the ceramic crucible was then positioned at the center of hot zone (1325 °C) in the furnace. Further, the samples were combusted in the presence of oxygen that converts carbon to carbon dioxide (CO2). The amount of carbon (mg/g) present in the sample was determined indirectly from the concentration of CO2 generated. The zeta potential of all the samples was measured by zeta sizer model nano ZS 90 (Malvern). Prior to the analysis, samples were ground and dispersed in 0.1 M NaCl solution and subsequently kept in a mechanical shaker at 100 rpm for 24 h. About 1 mL of the sample was injected into the capillary cell to analyze surface charge. Boehm titration was performed according to the procedure described in the literature.[ Reference Faur-Brasquet, Kadirvelu and Le Cloirec 25 ] Nitrogen adsorption–desorption measurements were performed at 77 K using gas adsorption analyzer (Belsorp Mini, MicrotracBEL corp., Japan). Prior to analysis, all the samples were degassed at 573 K for 3 h to remove the contaminants or water molecules present in the fiber. Thermal behavior of all the samples was measured by the simultaneous thermal analyzer (STA) (Perkin Elmer) in the N2 atmosphere at a heating rate of 10 °C/min from 45 to 900 °C. Powder x-ray diffraction profiles (PXRD) were collected in the 2θ angle between 10° and 90°, at a step width of 0.039 with an x-ray diffractometer (Panalytical) equipped with a copper-monochromatized Cu Kα radiation (λ = 1.5406 Å) under the accelerating voltage of 40 kV and current of 30 mA. Fourier transform infrared spectroscopy (FTIR) spectra were recorded in the range between 400 and 4000 cm−1 with a scanning speed of 2 mm/s using a Jasco model 4100 type A FTIR spectrometer. The morphological features were viewed by scanning electron microscope (SEM) (FEI Quantasem) and the elemental analysis was determined from energy-dispersive x-ray spectroscopy (EDX) equipped within the SEM.
Experiments of malathion decontamination
Stock solutions of malathion were prepared in methanol and stored at 4 °C. Working standards were prepared by appropriate dilution of the stock solution in double distilled water. The initial concentration of malathion used for the study was 10 mg/L. ZnO-coated ACF (3 × 3 cm2) was used as the photocatalyst. Photocatalytic experiments were performed using UV lamp of wavelength <280 nm. Prior to photocatalysis, the working solution was sonicated for 60 min to ensure proper contact between the sample and the catalyst. Control experiments were carried out in order to analyze the effect of decontamination in the absence of a catalyst and with pristine ACF.
Samples were taken out periodically and the change in concentration of malathion was monitored by the UV–vis spectra (Lambda-17 UV–vis spectrometer, Perkin–Elmer company, USA). Change in carbon content was determined in order to authenticate the mineralization of malathion using total organic carbon analyzer (Analytic Jena).
Results and discussion
Characterization of the fabric
Surface chemistry of carbon materials is an important criterion to determine the nature of the interaction between a molecule and carbon surface. Nitric acid oxidation yields carbon surface with phenolics, hydroxyls, quinones, and carboxylic acids.[ Reference Mangun, Benak, Daley and Economy 26 ] In addition, a reduction in carbon content could also be observed at a higher concentration of nitric acid.[ Reference Hashisho, Rood, Barot and Bernhard 27 , Reference Chen and Wu 28 ] This is well evident from the results obtained from total carbon content as determined by TOC analyzer (Fig. S1). The pristine ACF showed maximum carbon content (56.45 mg/g), whereas the carbon content of ACF-1, ACF-3, and ACF-5 were 54.76, 54.20, and 53.65 mg/g, respectively. The changes in carbon content may be due to the breaking of carbon bonds at a higher acidic solution for the incorporation of oxygen and nitrogen moieties. The reduction of carbon content was visually noticeable due to the detachment of very fine fiber particles in the solution after oxidation.
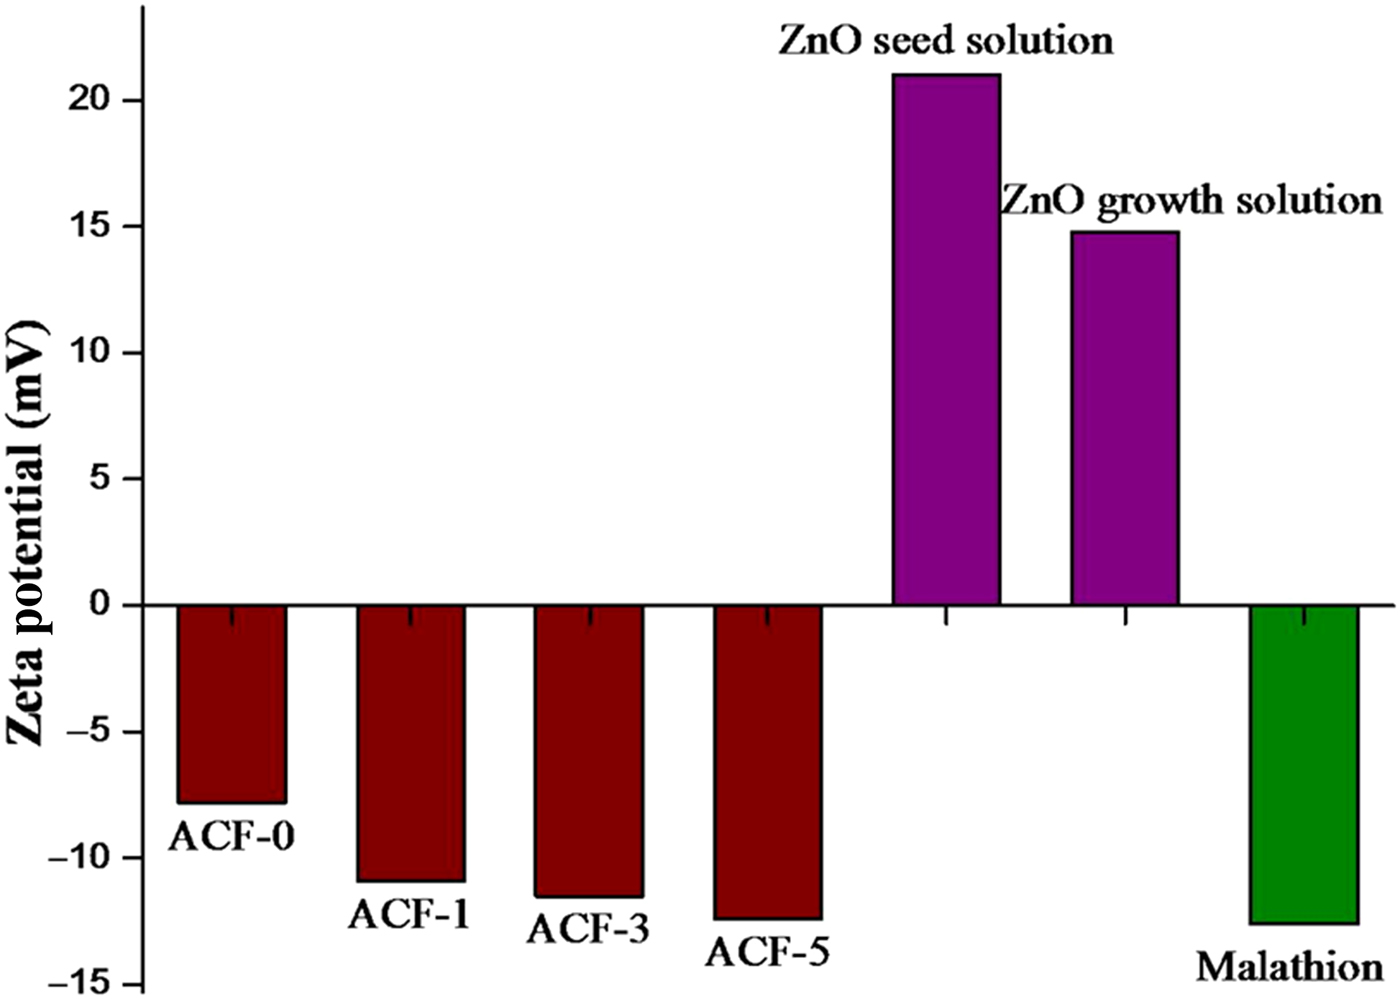
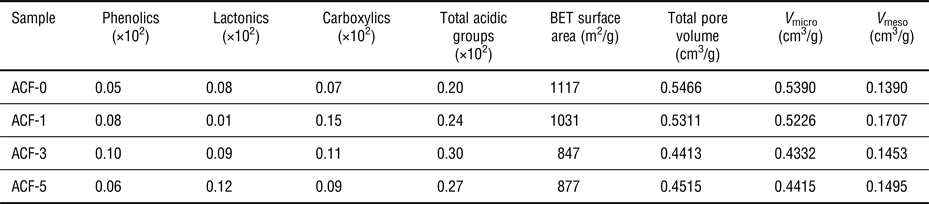
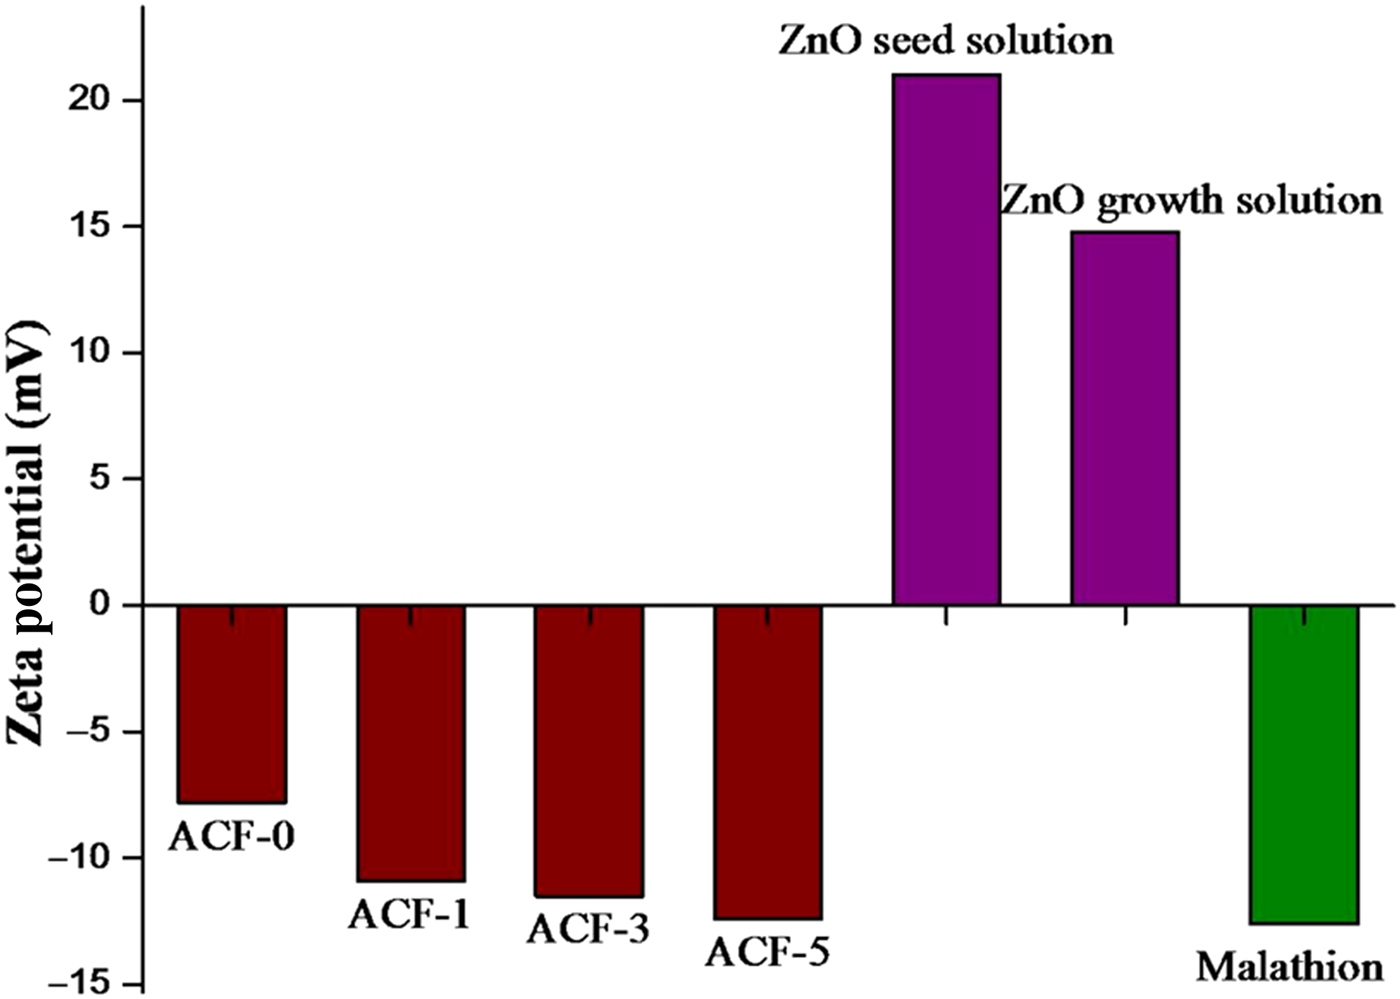
An important parameter determined from the zeta potential value is the surface charge of a material. The surface charge of pristine and treated ACF as analyzed by zeta sizer is depicted in Fig. 1. Pristine ACF had the least negative charge (−7.8 mV), whereas ACF treated with 5 M possess a charge of −12.4 mV. The extent of nitric acid oxidation as evidenced by the zeta potential value concluded that increase in negative charge on the surface of ACF resulted from a higher concentration of acid. The result is obvious since a number of surface groups is present at a higher concentration of acid which is due to the dissociation of acidic groups in solution.[ Reference Harry, Saha and Cumming 29 ] The nature of functional groups present on the surface of fiber as estimated by Boehm titration experiments is presented in Table 1. Zeta potential results well correlated with the Boehm titration except for 3 M where the total acidic groups were found to be higher than 5 M. This might be due to the substrate sites available for the attachment of some other groups (carbonyl) in ACF treated with 5 M which imparts negative character to the surface. However, nature of functional group as obtained from Boehm titration showed that ACF treated with 3 and 5 M had high lactonic content, whereas carboxylic groups were higher in ACF treated with 1 M. Moreover, phenolic groups were much lesser than the carboxylic groups and lactonic groups at a higher concentration of acid. It can be inferred that formation of lactonic groups was encouraged at higher concentration of nitric acid and there was a decreasing trend in the formation of carboxylic groups.
Zeta potential analysis of ACF, ZnO, and malathion.
Carbon surface functional groups (mmol/g).

Figure S2 illustrates the nitrogen adsorption–desorption isotherms of pristine ACF and acid-treated ACF. According to the International Union of Pure and Applied Chemistry (IUPAC) classification, type I adsorption isotherm predominates in all the samples indicating the microporous nature of the fiber.[ Reference Rouquerol, Rouquerol, Llewellyn, Maurin and Sing 30 ] It also suggests that the microporosity does not have much change even after acid treatment. It can be clearly seen that the amount of N2 adsorbed decreased for ACF treated with 1 and 3 M acid and thereafter it showed a slight increase for ACF treated with 5 M acid. These results very well reflected the surface area and total pore volume calculated according to the BET model to the isotherm data obtained at a pressure range of p/p 0 < 0.25. NGCB-BEL.as was specified as the standard isotherm for the determination micropore volume (V micro) and it was evaluated based on the αs plot. The BJH (Barret–Joyner–Halenda) method was adopted to obtain the mesopore volume (V meso).[ Reference Zhang, Yu and Feng 31 , Reference Chiang, Lee and Lee 32 ] The calculated values of the aforementioned parameters are presented in Table 1.
The specific surface area, total pore volume, and micropores followed a decreasing trend with an increase in the concentration of acid up to 3 M and thereafter it showed a little increase. The trend might be due to the introduction of different functional groups on carbon sites as an increase in weight after treatment results in a decrease of the lower surface area and pore volume.[ Reference Mangun, Benak, Daley and Economy 26 ] An observable increase in surface area and pore volume might be due to etching of the carbon skeleton. However, it is interesting to note that there was an increase in mesopore volume for ACF-1 suggesting that development of mesopores takes place at the certain level of acid particularly at 1 M beyond which filling of mesopores occurs. It can be well concluded that, for an acid concentration of 5 M, a decrease in surface area, micropore, and mesopore could be achieved. Liu et al.[ Reference Liu, Shi, Ma and Zhao 33 ] reported an increasing trend of surface area and pore volume at higher temperature due to the reaction of amorphous carbon atoms with the steam that led to the development of numerous pores. Likewise, here it can be explained that degree of graphitization becomes lower at higher concentration of acid thereby more distribution of amorphous carbon available for generating pores.
The thermal stability of ACF, ACF-5, and ZnO/ACF has been evaluated by the simultaneous thermal analyzer and the results are displayed in Fig. S3. It can be observed that there was an initial weight loss of 13% at 50–100 °C for ACF-5 and ZnO/ACF due to the removal of adsorbed water molecules acquired during treatment and impregnation step. However, for ACF-0 much lesser weight loss was noticeable in the same temperature range. ACF-0 and ACF-5 exhibited a steep decrease in weight at a temperature range of 590–600 and 560–570 °C, respectively. The decrease in weight at an early stage for ACF-5 was due to the loss of carbon during acid treatment which was well evident from the TC results. This shows that the thermal stability of ACF was slightly reduced due to nitric acid treatment. However, the thermal stability of ACF is recuperated after impregnating with ZnO, which can be seen from the thermal profile of ZnO/ACF. Even though the decomposition temperature of ZnO/ACF is registered at 500 °C, it showed only a little decrease in weight after 500 °C. This might be attributed to the ZnO impregnated on ACF as ZnO nanoparticles are known to possess high thermal stability.[ Reference Anand, Rani, Saxena, Bhandari and Dhawan 34 ] Henceforth, ACF composite developed with zinc oxide provides higher thermal stability indicating the robustness of composite material in applications involving high temperature.
Infrared (IR) spectrum is an important characterization technique for the identification of functional moieties present on a material. Figure S4 shows the FTIR spectra of pristine ACF, acid-treated ACF (5 M), and ZnO/ACF. The absence of bands at 3400 cm−1 in the pristine fiber shows that it lacks hydroxyl groups. It can be observed that there is a huge transformation of chemical nature of the samples after treatment as there is an increase in the amount of OH groups, as evidenced by the appearance of bands in the region 3421 cm−1 when compared with pristine ACF. The band at 1647 cm−1 is attributed to the C = O stretching vibrations from lactones and carboxylic acids incorporated during the acid treatment. ZnO is well impregnated on ACF as the bands at 751 cm−1 is intensified when compared with pristine ACF and the band 1076 cm−1 is shifted to 1060 cm−1.
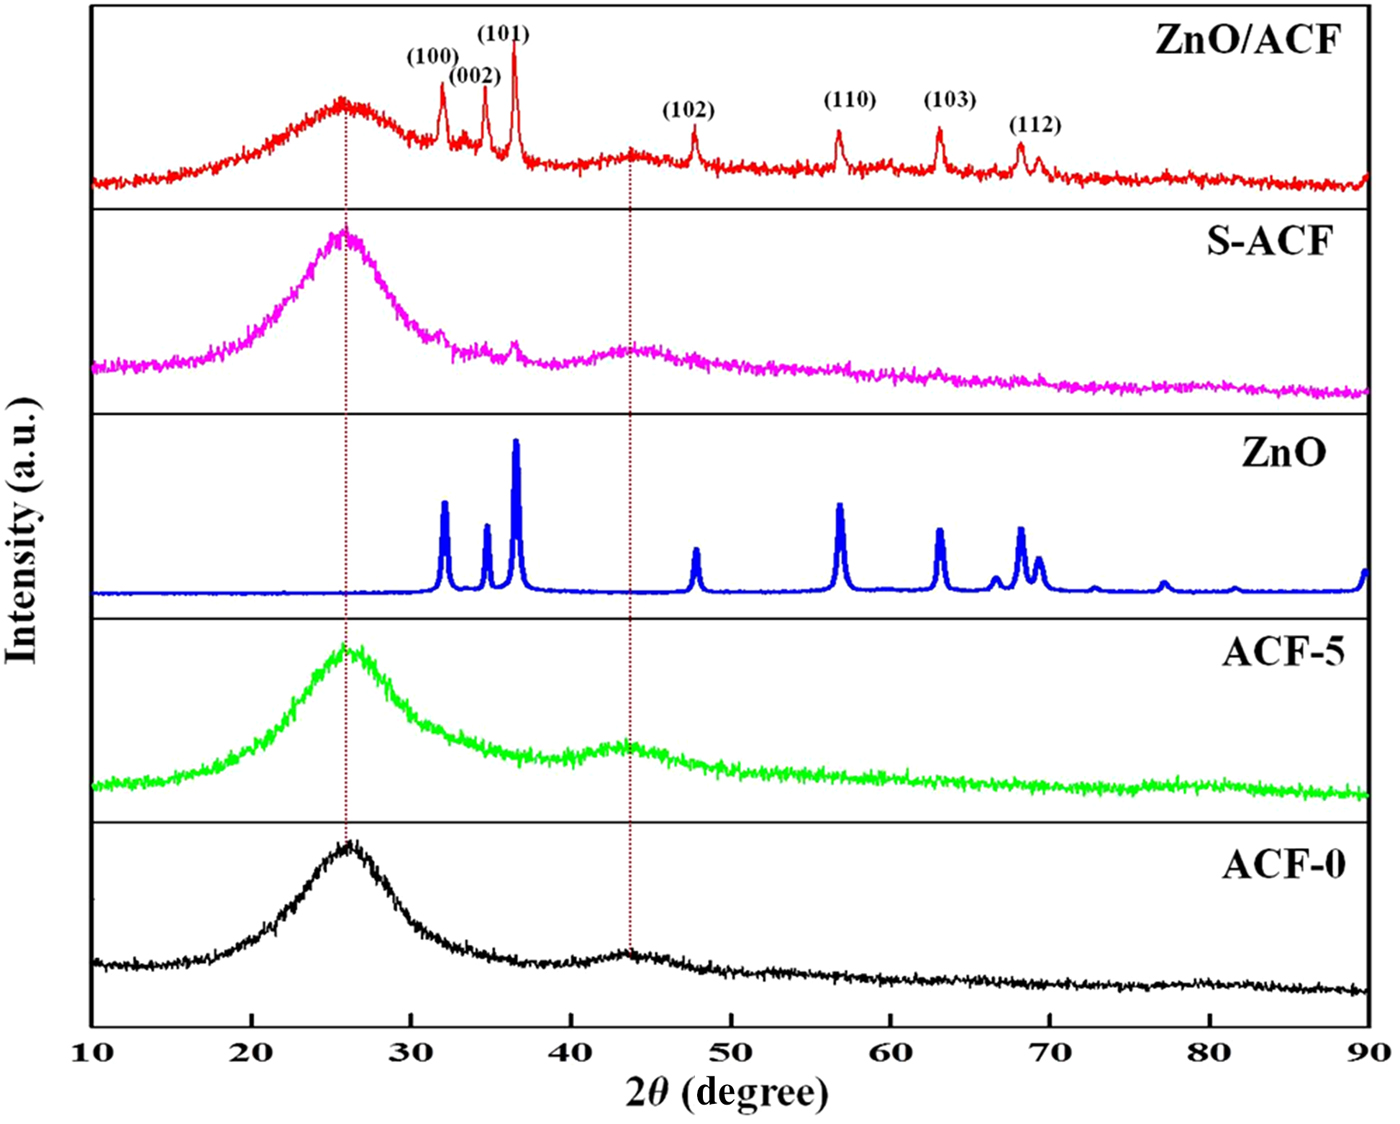
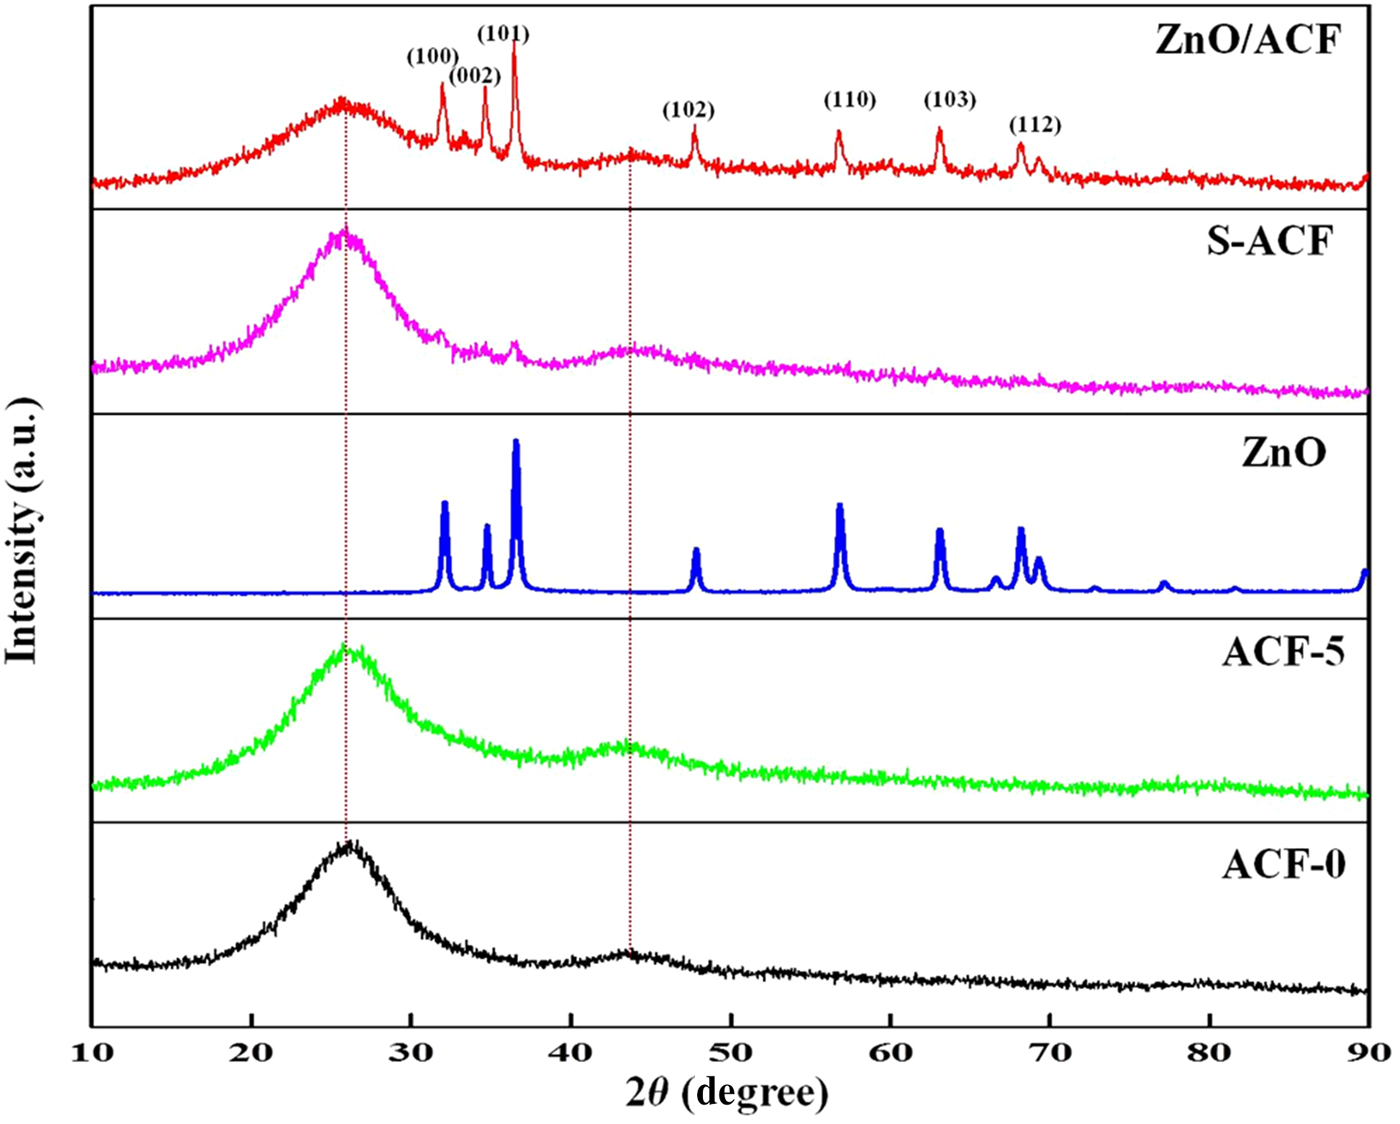
The PXRD patterns of ACF-0, ACF-5, ZnO, S-ACF, and ZnO/ACF are depicted in Fig. 2. The characteristic broad peak at low diffraction angle in all the samples except for ZnO was observed at 2θ = 23 and 44. These are attributed to the diffraction of carbon corresponding to (002) and (101) disordered graphitic plane. The broadness of the peak indicates that ACF is less ordered material due to their disordered carbonaceous interlayer.[ Reference Zhang, Yu and Feng 31 , Reference Lee, Kim, Hong, Suh and Cho 35 ] Acid treatment does not have altered the structure of ACF as it can be observed that diffraction peaks remained same as untreated ACF. The peaks at 2θ = 31.8°, 34.5°, 36.3°, 47.6°, 56.6°, 62.9°, 66.5°, 69.0°, 81.0° which appeared in ZnO and ZnO/ACF correspond to (100), (002), (101), (102), (110), (103), (200), (201), (104) planes of ZnO. The high-intensity peaks establish the purity and crystallinity of ZnO on ACF (JCPDS file no. 89–1397). The small diffraction peaks which appeared at 2θ = 31.8, 34.5, 36.3 provide evidence for the presence of ZnO on S-ACF.
PXRD patterns of ACF-0, ACF-5, ZnO, S-ACF, and ZnO/ACF.
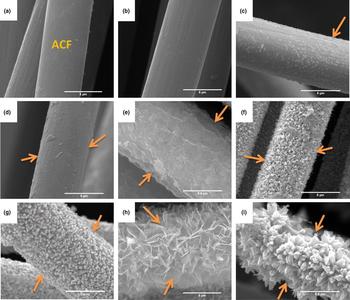
To explore the morphological features, the fabrics were characterized using SEM. The SEM images of ACF-0, ACF-5, S-ACF, and ACF coated with ZnO under different conditions is depicted in Fig. 3. The high magnification image shown in Figs. 3(a) and 3(b) clearly represents the distinct fiber of pristine ACF and acid-treated ACF (ACF-5). It can be observed that acid treatment has not introduced damages in the fiber structure. ACF after the second and third coatings of the seeding process are depicted in Figs. 3(c) and 3(d). Uniform and thick seed layer were achieved with the third stage of the dip coating process. Figure 3(e) represents the image of a fiber (without acid treatment) with a layer of ZnO coating on the surface of ACF. Coating with specific morphology could not be achieved due to the improper seed layer on non-acid-treated ACF. Therefore, the significance of acid treatment can be highlighted here, as the lactonic and carboxylic groups introduced on the fabric during the treatment ensured irreversible and stable attachment of ZnO seed layer from which different nano/microstructures could grow. Hollow [Fig. 3(f)] nanotubes were formed when initial pH of growth solution was 7 and at a growth time of 5 h. However, at the same pH when the growth period was increased to 10 h formation of rods [Fig. 3(g)] was observed. Hence, it can be revealed that reduced growth time of 5 h quenches the reaction abruptly which induces the formation of cavities. ZnO flake-like formation is well illustrated in [Fig. 3(h)] which was observed at pH 9 when the growth time was 5 h but later transformed into flower-like structure [Fig. 3(i)] when the growth time was increased to 10 h. Jung et al.[ Reference Jung, Oh, Lee, Yang, Park, Park and Jeong 11 ] reported the formation of ZnO in different shapes including ZnO cups, rods, and flowers by ultrasonication method. Guzman et al.[ Reference Sepulveda-Guzman, Reeja-Jayan, de La Rosa, Torres-Castro, Gonzalez-Gonzalez and Jose-Yacaman 36 ] demonstrated the formation of ZnO flakes by the precipitation method, whereas Athauda et al.[ Reference Athauda, Le Page, Chalker and Ozer 37 ] exploited cotton fibers as a substrate for the growth of ZnO nanorods to develop flame-resistant composite. The uniform distribution of ZnO was observed at pH 7 and 9 at higher growth time, whereas at less growth time the probability of uniform coating was less. It can be inferred from the above results that longer growth time favored uniform coating of ZnO on ACF. Figures S5(a) and S5(b) show the images of ZnO/ACF after photocatalytic experiments. It can be observed that the ZnO rods have not detached from ACF surface even after two cycles of reactions. The irreversible binding of ZnO on ACF is attributed to the chemisorbed ZnO with the lactonic and carboxylic groups present on ACF. The presence of acidic groups enhances the adsorption of metal on the surface of ACF.[ Reference Kadirvelu, Faur-Brasquet and Cloirec 2 ]
Scanning electron micrographs of ACF and ZnO coated at different conditions: (a) Pristine ACF (b) ACF-5 (c) S-ACF (after second coating) (d) S-ACF (third coating) (e) ZnO growth on ACF not treated with acid (f) ZnO growth at pH 7; 5 h growth (g) at pH 7; 10 h growth (h) at pH 9; 5 h growth (i) at pH 9; 10 h growth.

The surface elemental composition of ACF-0, ACF-5, S-ACF, and ZnO/ACF as determined from the EDX spectrum is depicted in Fig. S6. It is well evident from the spectrum of ACF-0 [Fig. S6(a)] that only carbon and oxygen were present which shows the absence of other impurities or elements. The introduction of oxygen functional groups on ACF during acid treatment resulted in the increase of oxygen content in ACF-5 [Fig. S6(b)]. The presence of Zn in S-ACF confirms the deposition of ZnO seed on ACF [Fig. S6(c)]. ZnO/ACF formed at pH 7 for 10 h contains 65.74% (weight %) of zinc [Fig. S6(d)], whereas ZnO/ACF [Fig. S6(e)] developed at pH 9 for 10 h contains 69% of zinc.
ZnO seeding on ACF
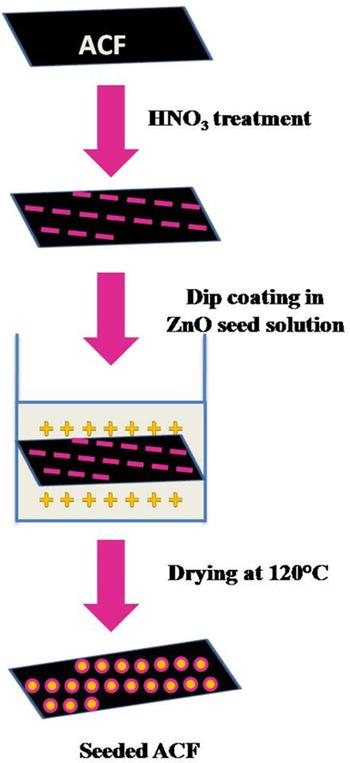
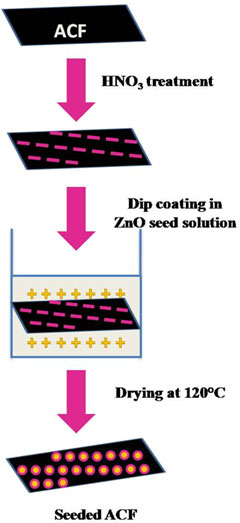
A possible explanation for the attachment of ZnO on ACF can be given on the basis of zeta potential values. ACF-5 was used for seeding process as it contained a higher concentration of acidic functional groups. The surface charge of ACF-5 is negative as the zeta potential value is −12.4 mV (Fig. 1) whereas for seed solution, it is positive (21 mV). This clearly suggests the presence of electrostatic attractive forces between negatively ACF and positively charged ZnO seed solution thereby creating an environment suitable for the formation of a strong bond between ACF and ZnO seed. The mechanism underlying the deposition of seed on ACF is schematically represented in Fig. 4. This seed layer acts as a nucleus for the further growth of ZnO (14.8 mV) firmly on ACF.
Schematic view of ZnO seeding on ACF.

Decontamination of malathion
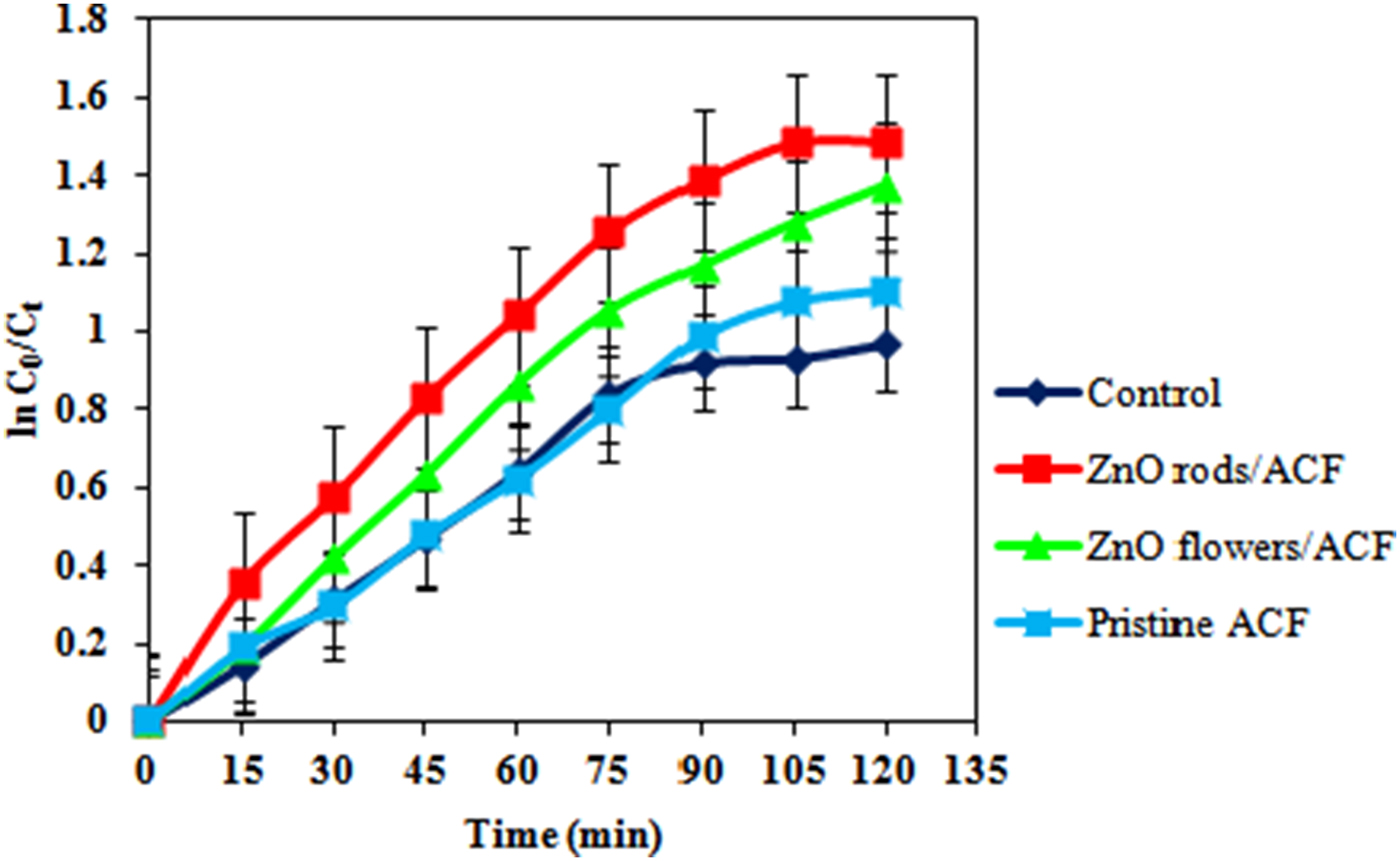
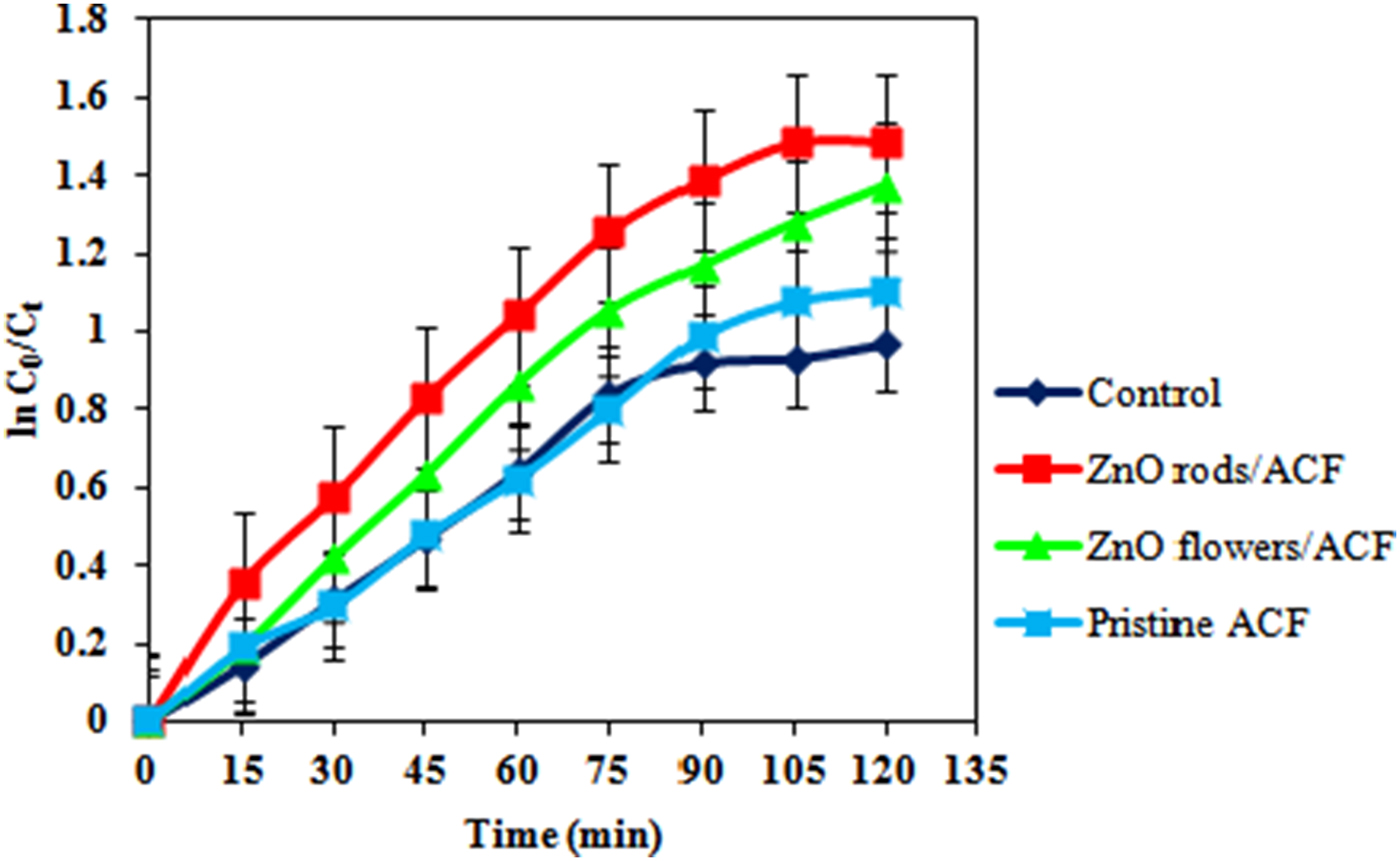
Ultrasonic waves and UV radiation have a significant impact on the degradation of organic compounds. The use of ultrasound to induce the catalytic activity of titanium dioxide micro and nanoparticles has been successfully used for the degradation of methyl parathion.[ Reference Wang, Sun, Zhang, Zhang, Li, Ma, Zhang and Li 38 ] Madhavan et al.[ Reference Subrenat and Le Cloirec 3 Reference Jain, Balasubramanian and Srinivasan 9 ] has reported the simultaneous use of both waves for the degradation of monocrotophos. The experiments were conducted at solution pH 8 using ZnO/ACF formed at pH 7 and 9 at a growth period of 10 h. Ultrasonic waves of 40 kHz was passed through the aqueous solution containing 10 mg/L of malathion and ACF for an initial time period of 1 h. Sonication had a significant effect on the reduction of malathion to ACF as it helps in mixing which ensures proper contact between the malathion and the catalyst. Moreover, the positive surface (14.8 mV) of ZnO on ACF attracted the malathion, which possesses the negative surface charge (−12.6 mV). Subsequently, samples were exposed to UV radiation and the samples were withdrawn at frequent time intervals. The change in concentration of malathion was determined from absorption spectra which decreased continuously with an increase in time. The slope obtained from the plot of ln (C 0/C t) versus time could be used to determine reaction rate K t. The pseudo-first-order rate constant obtained from Fig. 5 are 1.2 × 10⁻², 1.1 × 10⁻², 0.9 × 10⁻², and 0.8 × 10⁻²/min, respectively, for ZnO/ACF developed at pH 7, ZnO/ACF developed at pH 9, pristine fibers, and control (reaction without catalyst). The reaction rate was higher for ZnO/ACF at pH 7 which ensures its potential ability to adhere and degrade malathion within a time period of 120 min.
Effect of photocatalyst developed at different conditions over the decontamination of malathion (10 mg/L, pH 8) in aqueous solution.
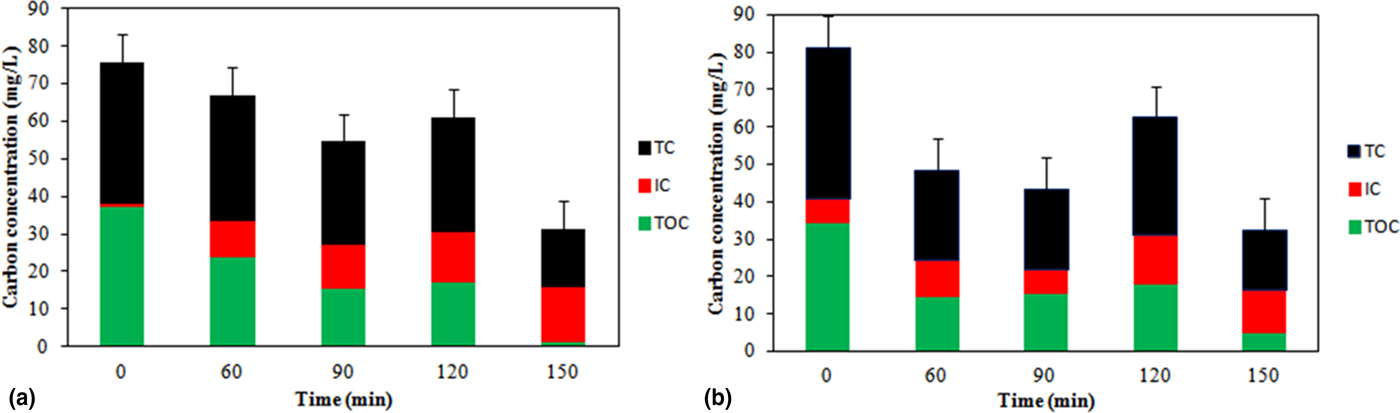
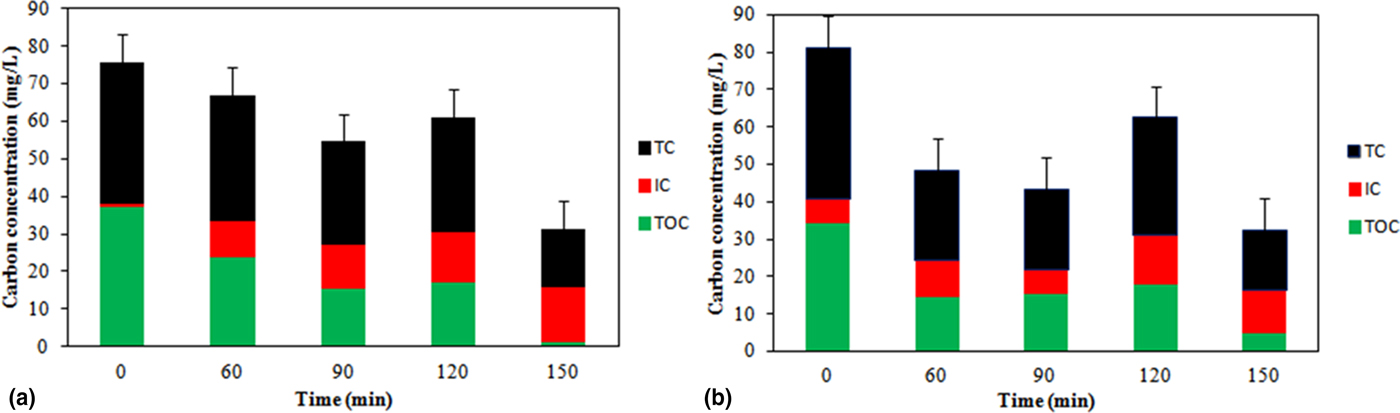
The photocatalytic decontamination was also assessed by a decrease in total organic carbon concentration as well as a respective increase in inorganic carbon content. It can be observed from Fig. 6(a) that initial organic carbon concentration was 34.35 mg/L, whereas the inorganic carbon was only about 6.28 mg/L. Organic carbon decreased with progression in time while the inorganic carbon increased. It can be strongly argued that ACF, being a highly conducting material ensures charge separation in ZnO, thereby generating sufficient amount of .OH radical necessary for the degradation of malathion.[ Reference Thi and Lee 5 ] The decrease in organic carbon to 23.71 mg/L within 60 min indicated the formation of inorganic intermediates. The final organic concentration of 4.73 mg/L assures the mineralization of malathion into much simpler compounds. 2-mercaptosuccinic acid diethyl ester or butane diethyl esters are low molecular weight compounds than malathion which could be the possible intermediates.[ Reference Meng, Yang, Zhang, Dong and Shu 19 , Reference Kralj, Franko and Trebse 20 ] About 97% of the targeted compound was decontaminated within 150 min. In a study conducted by Ramos-Delgado et al.[ Reference Ramos-Delgado, Hinojosa-Reyes, Guzman-Mar, Gracia-Pinilla and Hernández-Ramírez 40 ] mineralization of 63% was achieved for malathion with 2% WO3/TiO2 catalyst. In another investigation by Kadam et al.,[ Reference Kadam, Dhabbe, Kokate, Gaikwad and Garadkar 41 ] 80% reduction in chemical oxygen demand was achieved within 150 min using nitrogen-doped TiO2 nanostructures. Multiple uses of the same catalyst are essential as reuse is an important criterion in the selection of catalyst for water and wastewater treatment applications. The regeneration capability of the catalyst was examined by conducting photocatalysis under the same conditions with the same catalyst used for the first cycle. TOC removal efficiency of 86.25% was achieved for the second cycle [Fig. 6(b)].
(a) Changes in organic carbon (mg/L) during mineralization of malathion in the presence of UV light (8 pH;10 mg/L malathion). (b) Reuse of the catalyst under the same conditions.
Conclusion
ACF with photocatalytic properties was developed by impregnating ZnO via a hydrothermal technique and successfully used for the decontamination of malathion. Acid treatment performed via hydrothermal method resulted in the incorporation of a higher amount of acidic groups on ACF which proved it to be a promising approach for surface oxidation. Although carbon sites were occupied by the functional groups, an increase in surface area and micropore volume was achieved with a higher concentration of acid. The surface functionalized microporous carbon ensured the chemical stability of anchored ZnO on the surface of ACF. The sequential use of ultrasonication and UV radiation provided an excellent pathway for the adsorption and mineralization of compound since the former helped in adsorption while latter ensured mineralization. Composite created by the ACF with ZnO enabled the photocatalytic mineralization of malathion repeatedly for two cycles. Thus, it provided evidence that ACF is not a mere adsorbent for pollutant removal but can be modified as a photocatalytic material for the degradation of OP compounds. The stability of ZnO on ACF after degradation as evidenced by the SEM micrographs confirmed the reusability of the catalyst. Thus the developed photocatalyst can be a potential candidate for water treatment industries. Further studies have to be carried out on multiple uses of ZnO/ACF for efficient and effective degradation.
Supplementary material
The supplementary material for this article can be found at https://doi.org/10.1557/mrc.2018.11
Acknowledgments
This work was carried out as a part of Phase-II research program in DRDO-BU CLS, Bharathiar University Campus, Coimbatore. One of the authors A. G. would like to thank DRDO for providing the funding to carry out this project. The author would also thank J.A. Allen, K.P. Thiruppathi, and S. Jiji for their help in the material characterization.