1 Introduction
In a study of dilute suspension flow through circular cylindrical tubes, Segre & Silberberg (Reference Segre and Silberberg1962) reported lateral migration of neutrally buoyant spherical particles to an equilibrium radial position located at 0.6 tube radius from the axis at low Reynolds numbers
 $(Re)$
. This phenomenon, referred to as the Segre–Silberberg effect or the tubular pinch effect, is due to the effect of inertia, as a rigid spherical particle translates parallel to the flow direction in circular tubes at the limit of zero
 $Re$
(Bretherton Reference Bretherton1962). Since this pioneering study, many analytical, experimental and numerical investigations have been conducted to examine the underlying physics of this phenomenon. Among them, theoretical studies based on a regular perturbation method for a neutrally buoyant sphere suspended in a plane Poiseuille flow explained the presence of the equilibrium position in terms of the stresslet (symmetric force dipole) in the case of small
 $Re$
; its interaction with the channel wall produces inward force on the particle, while the interaction with the curvature of the bulk velocity profile yields an outward force (Ho & Leal Reference Ho and Leal1974). Compared with these two effects, the lag velocity of the particle and its slip rotation were found to be less important for neutrally buoyant particles, and the equilibrium position, termed the Segre–Silberberg annulus in tube flow, was considered to appear as a balance between these effects. For higher
 $Re$
, the method of matched asymptotic expansion was used to evaluate the lateral force exerted on a rigid sphere in a plane Poiseuille flow (Schonberg & Hinch Reference Schonberg and Hinch1989; Asmolov Reference Asmolov1999). The shift of the Segre–Silberberg annulus towards the tube wall at large
 $Re$
was first predicted by asymptotic theory (Asmolov Reference Asmolov1999), and was confirmed later in experiments by Matas, Morris & Guazzelli (Reference Matas, Morris and Guazzelli2004). Matas et al. (Reference Matas, Morris and Guazzelli2004) reported that another equilibrium annulus emerges closer to the tube centre at elevated
 $Re$
and the majority of particles lie on this new annulus for
 $Re>700$
. Existing theoretical studies based on the matched asymptotic expansion successfully explained the presence of the Segre–Silberberg annulus but they could not account for the appearance of the second equilibrium annulus (Asmolov Reference Asmolov1999; Matas, Morris & Guazzelli Reference Matas, Morris and Guazzelli2009). Matas et al. (Reference Matas, Morris and Guazzelli2009) suggested that the second equilibrium annulus, called the inner annulus, appears most likely due to the effect of finite size of the suspended particles in experiments, as the matched asymptotic expansion theories assumed a point particle in Poiseuille flow. It is important to elucidate whether the inner annulus is an equilibrium or its presence is a transient feature.
To clarify the cause of the discrepancy between existing experiments and theories for the inner annulus, the present study was performed to experimentally investigate the distribution of neutrally buoyant spherical particles flowing through circular tubes at Reynolds numbers from 100 to 1100. Here, the Reynolds number is defined as
 $Re=UD/\unicode[STIX]{x1D708}$
, where
 $U$
is the mean velocity,
 $D$
is the tube diameter and
 $\unicode[STIX]{x1D708}$
is the kinematic viscosity of the fluid. Although Matas et al. (Reference Matas, Morris and Guazzelli2004) measured the distribution of particles at a single cross-section of the tube, the measurements in the present study were performed at several downstream cross-sections at different distances from the tube entrance to examine the evolution of particle distribution with axial position. The measurements of particle distributions at one fixed cross-section showed that more particles were located near the inner annulus with increasing
 $Re$
, consistent with Matas et al. (Reference Matas, Morris and Guazzelli2004), whereas the measurements at several cross-sections indicated less particles on the inner annulus further downstream, with the radial position approaching the Segre–Silberberg annulus and decreasing width of the inner annulus. These results suggest that there is a certain distance from the tube inlet beyond which the inner annulus will disappear, and that this distance increases with increasing
 $Re$
or decreasing size ratio of particles to the tube diameter. For a given
 $Re$
and size ratio, it can be predicted that the inner annulus would disappear if the tube length is long enough under conditions of
 $100<Re<1000$
and size ratio
 ${\sim}0.08$
.
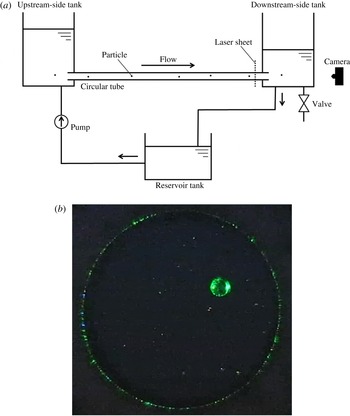
(a) Experimental set-up and (b) an example of a cross-sectional image of the tube.

2 Experimental methods
The details of the experimental apparatus and method were presented previously (Miura, Itano & Sugihara-Seki Reference Miura, Itano and Sugihara-Seki2014). We used spherical polystyrene beads with diameter
 $d=300{-}650~\unicode[STIX]{x03BC}\text{m}$
(Thermo Scientific, Waltham, MA, USA) suspended in a mixture of water and glycerol. The density of the suspending fluid was matched to the density of the particles in every experiment. The density and viscosity of the fluid were
 $1.052\times 10^{3}~\text{kg}~\text{m}^{-3}$
and
 $1.55{-}1.78\times 10^{-3}~\text{Pa}~\text{s}$
, respectively. The volume fraction of particles suspended in the fluid was set to
 $1.1{-}1.5\times 10^{-2}\,\%$
, to minimise particle–particle interactions.
As shown in figure 1(a), an acrylic circular tube of
 $D=5.84$
or 7.75 mm in inner diameter and
 $L=0.5$
, 1.0, 2.0 or 4.0 m in length was placed horizontally between two tanks. The flow rate through the tube was varied by changing the difference in height of the fluid levels in these tanks, each of which was controlled by the overflow system. The flow rate, and thus the mean velocity through the tube, was determined by measuring the collected volume of fluid at the outlet of the downstream tank. At 0.05 m upstream from the outlet of the tube, a laser sheet (50 mW DPSS laser, PHOTOP DPGL-2050F) intersected the tube at a right angle, and footage of the cross-section of the tube was taken from downstream as shown in figure 1(a) at a frame rate of 300 f.p.s. using a digital camera (CASIO EX-F1). We obtained clear pictures of particles as well as the inner wall of the tube as evidenced in figure 1(b). These images were analysed with the public domain software ImageJ (NIH, Bethesda, MD, USA) to determine the positions of the particle centres in the cross-section. In each experiment, at least 300 particles were measured. The parameter values in the present study were
 $d/D=0.052{-}0.11$
,
 $L/D=65{-}516$
and
 $Re=100{-}1100$
.
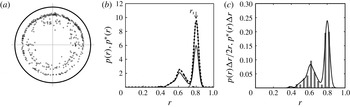
(a) Particle distribution over the tube cross-section
 $(Re=388,d/D=0.084,L/D=258)$
, (b) detected radial position p.d.f.
 $p(r)$
(dotted line), radial p.d.f.
 $p^{\ast }(r)$
(thick solid line) and separation of
 $p(r)$
for the Segre–Silberberg annulus (thin solid line) and
 $p(r)$
for the inner annulus (dashed line), and (c) comparison of
 $p(r)\unicode[STIX]{x0394}r/2r$
(solid line) and
 $p^{\ast }(r)\unicode[STIX]{x0394}r$
(histogram) with
 $\unicode[STIX]{x0394}r=0.04$
.

Below in figure 10(a), we refer to experimental results which were obtained adopting much smaller tubes with diameter less than 1 mm. The details of the method for this sub-millimetre tube experiment were described elsewhere (Shichi et al. Reference Shichi, Yamashita, Itano, Seki and Sugihara-Seki2016). Briefly, the working fluid was the same with that of the present study, but the flow was induced by a syringe pump. The downstream cross-section of the tube was observed by a high-speed camera equipped with a long working distance objective. The obtained images were analysed in a similar way to the present study.
A representative example of the particle distribution over the tube cross-section is shown in figure 2(a). Each dot in figure 2(a) represents the position of a particle centre. Using the obtained data of the particle positions, we estimated the probability density function
 $p(r)$
by the use of the statistical analysis software R (R Core Development Team, Vienna, Austria), where
 $r$
represents the radial coordinate normalised by the tube radius
 $D/2$
. In terms of the total number of particles,
 $N$
, and the radial position of the
 $j$
th particle centre,
 $r_{j}$
, (
 $j=1,2,\ldots ,N$
), we calculated
 $p(r)$
as
 $$\begin{eqnarray}\displaystyle p(r)=\frac{1}{Nh}\mathop{\sum }_{j=1}^{N}K\left(\frac{r-r_{j}}{h}\right), & & \displaystyle\end{eqnarray}$$
where the kernel function is given by
 $$\begin{eqnarray}\displaystyle K(r)=\frac{1}{\sqrt{2\unicode[STIX]{x03C0}}}\text{e}^{-r^{2}/2}. & & \displaystyle\end{eqnarray}$$
The p.d.f.
 $p(r)$
represents the probability of particles detected at that radial position. In choosing an appropriate value for
 $h$
in equation (2.1), we compared
 $p(r)$
with adoption of various values of
 $h$
from
 $d/D^{\ast }0.5$
to
 $d/D^{\ast }2$
for several particle distributions. There were no marked differences between the results of the radial positions of the Segre–Silberberg annulus and the inner annulus defined below in all cases, and so we chose
 $h=d/D$
. The detected radial position p.d.f.
 $p(r)$
calculated from the particle distribution shown in figure 2(a) is plotted by a dotted line in figure 2(b).
The probability density function,
 $p^{\ast }(r,\unicode[STIX]{x1D703})$
, associated with the probability of a particle being at a radius
 $r$
and a given azimuthal angle
 $\unicode[STIX]{x1D703}$
, can be related to
 $p(r)$
by
 $p(r)=\unicode[STIX]{x03C0}^{-1}\int _{0}^{2\unicode[STIX]{x03C0}}p^{\ast }(r,\unicode[STIX]{x1D703})r\,\text{d}\unicode[STIX]{x1D703}$
. Assuming that
 $p^{\ast }$
depends only upon
 $r$
, this yields
 $p^{\ast }(r)=p(r)/2r$
. The p.d.f.
 $p^{\ast }(r)$
for the particle distribution in figure 2(a) is plotted by a thick solid line in figure 2(b). Matas et al. (Reference Matas, Morris and Guazzelli2004) built a histogram
 $p^{\ast }(r)\unicode[STIX]{x0394}r$
by
 $$\begin{eqnarray}\displaystyle p^{\ast }(r)\unicode[STIX]{x0394}r=\frac{1}{2r}\frac{n(r)}{N}, & & \displaystyle\end{eqnarray}$$
where
 $\unicode[STIX]{x0394}r$
is the bin width and
 $n(r)$
represents the number of particles placed between two circles of radius
 $r$
and
 $r+\unicode[STIX]{x0394}r$
. Thus, we calculated this histogram
 $p^{\ast }(r)\unicode[STIX]{x0394}r$
for the particle distribution in figure 2(a) according to equation (2.3) with
 $\unicode[STIX]{x0394}r=0.04$
, and the results were compared with
 $(p(r)/2r)\,\unicode[STIX]{x0394}r$
. As shown in figure 2(c), these two results almost agree with each other. The detected radial position p.d.f.
 $p(r)$
is useful to calculate the fraction of particles on the Segre–Silberberg annulus or that on the inner annulus relative to the total particle number. Since the area between the curve
 $p(r)$
and the horizontal axis is kept at unity, these two fractions are directly calculated by an integration of
 $p(r)$
as shown below.
Figure 2(b) shows the presence of two peaks in both curves of
 $p(r)$
and
 $p^{\ast }(r)$
at
 $Re=388$
for
 $d/D=0.084$
and
 $L/D=258$
. The outer peak represents the so-called Segre–Silberberg annulus and the inner peak represents the inner annulus reported first by Matas et al. (Reference Matas, Morris and Guazzelli2004). In general,
 $p(r)$
and
 $p^{\ast }(r)\,(=p(r)/2r)$
will attain the maximum at different positions and the maximum position of
 $p^{\ast }(r)$
could represent the equilibrium position of particles. However, the differences between the maximum positions of the outer peak of
 $p(r)$
and
 $p^{\ast }(r)$
were found to be at most 0.002 relative to the tube radius in all cases examined. In the case of figure 2(b), the maximum positions of
 $p(r)$
and
 $p^{\ast }(r)$
are
 $r=0.801$
and 0.800, respectively. These differences are well within the accuracy of the present measurement (the pixel width in images
 ${\sim}0.007\times (D/2)$
). Thus, in this study we approximate the radial position of the Segre–Silberberg annulus,
 $r_{s}$
, as the maximum position of the outer peak of
 $p(r)$
. Assuming that the curve of
 $p(r)$
for the Segre–Silberberg annulus is symmetric with respect to
 $r=r_{s}$
, we subtracted that portion of the Segre–Silberberg annulus from the original
 $p(r)$
curve for
 $r<r_{s}$
, and defined the remainder as the p.d.f.
 $p(r)$
for the inner annulus. In figure 2(b), the detected radial position p.d.f.
 $p(r)$
for the Segre–Silberberg annulus is plotted by a thin solid line, and that for the inner annulus is plotted by a dashed line. Using the data of the p.d.f.
 $p(r)$
for the inner annulus (dashed line in figure 2
b), we calculated the mean value of the radial position, the standard deviation around the mean value and the area between that curve and the horizontal axis, and designate these as the radial position
 $r_{i}$
, width
 $\unicode[STIX]{x1D70E}_{i}$
and the probability
 $P_{i}$
of the inner annulus, respectively. Note that
 $P_{i}$
represents the fraction of the particles on the inner annulus, and
 $1-P_{i}$
represents that on the Segre–Silberberg annulus. In the case of figure 2, we have
 $r_{s}=0.80$
,
 $r_{i}=0.61$
,
 $\unicode[STIX]{x1D70E}_{i}=0.067$
and
 $P_{i}=0.36$
.
3 Experimental results
Representative examples of the particle distribution in the tube cross-section obtained for various
 $Re$
and the corresponding p.d.f.s
 $p(r)$
and
 $p^{\ast }(r)$
are shown in figure 3, for
 $d/D=0.084$
and
 $L/D=258$
(
 $d=0.65~\text{mm}$
,
 $D=7.75~\text{mm}$
and
 $L=2.0~\text{m}$
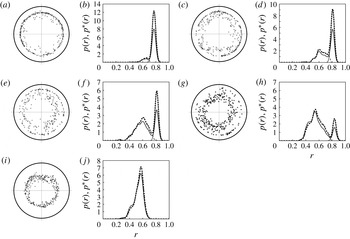
). These figures illustrate the presence of the Segre–Silberberg annulus, and its progressive shift towards the tube wall with increasing
 $Re$
. In addition, it can be seen that the focusing of particles on the Segre–Silberberg annulus decreases for larger
 $Re$
and the inner annulus appears clearly at elevated
 $Re$
, which exhibits the opposite tendency reported by Segre & Silberberg (Reference Segre and Silberberg1962) at very low
 $Re({<}60)$
. At the highest
 $Re\,(=1072)$
, the Segre–Silberberg annulus was not observed in figure 3(i,j). All of these features are in agreement with the observations of Matas et al. (Reference Matas, Morris and Guazzelli2004). Here, it is worth noting that if particles have entered the tube entrance randomly over the tube cross-section, the absence of the Segre–Silberberg annulus at downstream cross-sections may indicate that particles initially present on or out of the Segre–Silberberg annulus at the entrance actually leave that region to reach the inner annulus. Hence, Matas et al. (Reference Matas, Morris and Guazzelli2004) considered this phenomenon to support the stability of the inner annulus and even to suggest that the only equilibrium position is the inner annulus, not the Segre–Silberberg annulus, at elevated
 $Re$
. We will discuss this issue in § 4.
Particle distributions and p.d.f.s (
 $p(r)$
: dotted line,
 $p^{\ast }(r)$
: thick solid line,
 $p(r)$
for the Segre–Silberberg annulus: thin solid line and
 $p(r)$
for the inner annulus: dashed line) for various
 $Re$
at
 $d/D=0.084$
and
 $L/D=258$
; (a,b)
 $Re=227$
, (c,d)
 $Re=425$
, (e,f)
 $Re=617$
, (g,h)
 $Re=853$
and (i,j)
 $Re=1072$
.

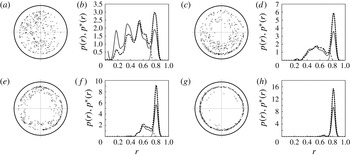
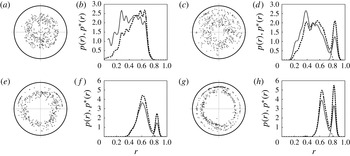
Figure 4 shows the particle distributions and the corresponding p.d.f.s
 $p(r)$
and
 $p^{\ast }(r)$
at
 $Re\approx 410$
for
 $d/D=0.084$
and various
 $L/D$
. The particle distributions for larger
 $L/D$
correspond to those at further downstream cross-sections from the tube inlet. Hence, figure 4 illustrates the evolution of the particle distribution along the flow, which was not observed before except for very low
 $Re$
. The particle distributions were shown to vary significantly with
 $L/D$
; the Segre–Silberberg annulus was observed more clearly with increasing
 $L/D$
, and almost all fractions of the particles were on the Segre–Silberberg annulus for the longest tube
 $(L/D=516)$
, as shown in figure 4(g,h). These trends were also observed at higher
 $Re$
, as shown in figure 5 for
 $Re\approx 760$
. Figure 5 indicates that the fraction of the particles on the inner annulus decreases and the fraction on the Segre–Silberberg annulus increases as
 $L/D$
increases. In addition, an increase in
 $L/D$
shifts the mean radial position of the inner annulus
 $r_{i}$
in the outward direction and decreases its width
 $\unicode[STIX]{x1D70E}_{i}$
, as can be seen more clearly in figure 6. As noted above, the absence of the Segre–Silberberg annulus in figure 5(a) will be discussed in § 4.
Particle distributions and p.d.f.s (
 $p(r)$
: dotted line,
 $p^{\ast }(r)$
: thick solid line,
 $p(r)$
for the Segre–Silberberg annulus: thin solid line and
 $p(r)$
for the inner annulus: dashed line) for various tube lengths at
 $Re\sim 410$
and
 $d/D=0.084$
; (a,b)
 $L/D=65\,(Re=382)$
, (c,d)
 $L/D=129\,(Re=397)$
, (e,f)
 $L/D=258\,(Re=425)$
and (g,h)
 $L/D=516\,(Re=432)$
.

Particle distributions and p.d.f.s (
 $p(r)$
: dotted line,
 $p^{\ast }(r)$
: thick solid line,
 $p(r)$
for the Segre–Silberberg annulus: thin solid line and
 $p(r)$
for the inner annulus: dashed line) for various tube lengths at
 $Re\sim 760$
and
 $d/D=0.084$
; (a,b)
 $L/D=65\,(Re=757)$
, (c,d)
 $L/D=129\,(Re=755)$
, (e,f)
 $L/D=258\,(Re=786)$
and (g,h)
 $L/D=516\,(Re=785)$
.

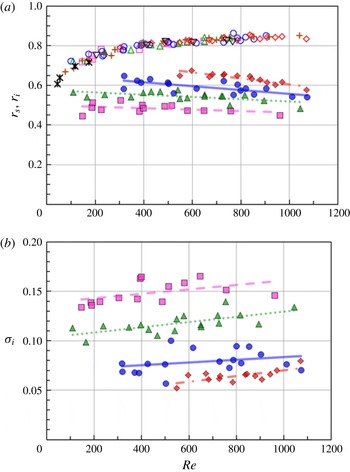
(a) Radial positions of the Segre–Silberberg annulus,
 $r_{s}$
, and the inner annulus,
 $r_{i}$
, and (b) width of the inner annulus,
 $\unicode[STIX]{x1D70E}_{i}$
, at
 $d/D=0.084$
for various tube lengths;
 $L/D=65$
(squares), 129 (triangles), 258 (circles) and 516 (diamonds). In (a), the open marks represent
 $r_{s}$
and the closed marks
 $r_{i}$
. Asterisks and plus signs indicate the results of Segre & Silberberg (Reference Segre and Silberberg1962) for
 $d/D=0.11$
and Matas et al. (Reference Matas, Morris and Guazzelli2004) for
 $d/D=0.095$
, respectively.

Figure 6(a) shows the radial positions of the Segre–Silberberg annulus,
 $r_{s}$
, and the inner annulus,
 $r_{i}$
, as a function of
 $Re$
for
 $d/D=0.084$
and various
 $L/D$
. For comparison, the data of
 $r_{s}$
from Segre & Silberberg (Reference Segre and Silberberg1962) for
 $d/D=0.11$
and Matas et al. (Reference Matas, Morris and Guazzelli2004) for
 $d/D=0.095$
are also plotted. It can be seen that
 $r_{s}$
increases with increasing
 $Re$
, and the values of
 $r_{s}$
are comparable with those presented in previous studies. One of new findings in the present study is that
 $r_{s}$
is almost independent of the tube length or the distance of the measurement site from the tube inlet. This finding supports the conclusion obtained from the matched asymptotic expansion theory that the Segre–Silberberg annulus is an equilibrium position where the resultant radial force acting on particles vanishes in the Poiseuille flow. On the other hand, figure 6(a) shows that the radial position of the inner annulus,
 $r_{i}$
, increases with increasing
 $L/D$
, indicating a monotonic outward shift of the inner annulus towards the tube wall with downstream movement of the measurement site. Figure 6(b) indicates that the width of the inner annulus,
 $\unicode[STIX]{x1D70E}_{i}$
, decreases with increasing
 $L/D$
. These results suggest that, as the flow goes downstream, the inner annulus approaches the radial position of the Segre–Silberberg annulus, with its width decreasing. We also show below that the fraction of particles on the inner annulus decreases with increasing
 $L/D$
(see figures 9
a and 10
a). In figures 6(a) and 6(b), nearly horizontal lines, representing the linear regression of
 $r_{i}$
and
 $\unicode[STIX]{x1D70E}_{i}$
, agree with the trend reported by Matas et al. (Reference Matas, Morris and Guazzelli2004) that the inner annuluses are almost independent of
 $Re$
.
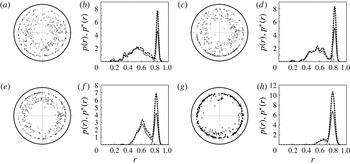
The effect of the diameter ratio of the particle and the tube,
 $d/D$
, on the particle distribution was examined, and a representative example of the results is plotted in figure 7, at
 $Re\approx 480$
for
 $L/D=258$
and various
 $d/D\,(=0.052{-}0.11)$
. For these parameter values, the Segre–Silberberg annulus is observed in all cases, and is more evident for larger
 $d/D$
. Conversely, an increase in
 $d/D$
diminishes the inner annulus.
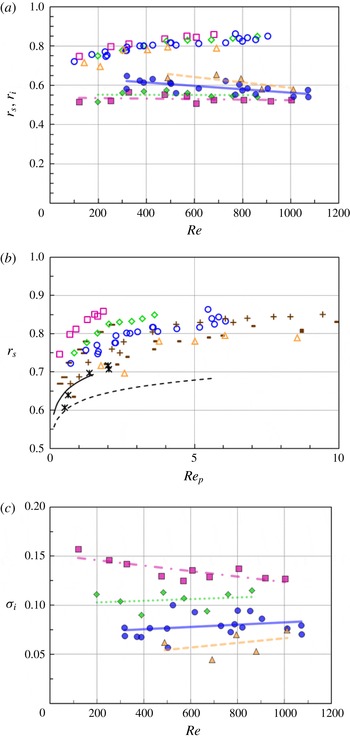
Figure 8(a) summarises the radial positions of
 $r_{s}$
and
 $r_{i}$
as a function of
 $Re$
for various
 $d/D$
and
 $L/D=258$
. In this range of
 $d/D$
,
 $r_{s}$
is slightly larger but
 $r_{i}$
is smaller for smaller
 $d/D$
. This trend for
 $r_{s}$
is in accordance with Matas et al. (Reference Matas, Morris and Guazzelli2004) and small variations in
 $r_{i}$
with
 $d/D$
and
 $Re$
may be consistent with their report that
 $r_{i}\sim 0.5$
irrespective of
 $d/D$
and
 $Re$
. Yang et al. (Reference Yang, Wang, Joseph, Hu, Pan and Glowinski2005) performed a numerical simulation of the motion of a neutrally buoyant rigid spherical particle in tube flow and obtained the radial position of the Segre–Silberberg annulus as a function of the particle Reynolds number
 $Re_{p}=Re(d/D)^{2}$
. The present results for
 $r_{s}$
are replotted as a function of
 $Re_{p}$
in figure 8(b) and compared with the numerical results of Yang et al. (Reference Yang, Wang, Joseph, Hu, Pan and Glowinski2005) (
 $d/D=0.1$
and 0.15). The experimental results of Segre & Silberberg (Reference Segre and Silberberg1962) for
 $d/D=0.11$
and Matas et al. (Reference Matas, Morris and Guazzelli2004) for
 $d/D=0.067$
, 0.095 and 0.11 are also plotted for comparison. For all size ratios, the present results are comparable with those described in these previous reports. Figure 8(c) shows the width of the inner annulus,
 $\unicode[STIX]{x1D70E}_{i}$
, for various size ratios at
 $L/D=258$
. It can be seen that
 $\unicode[STIX]{x1D70E}_{i}$
is smaller for larger
 $d/D$
, as may be evident in figure 7. These figures indicate that the inner annulus diminishes with its width decreasing as the size ratio
 $d/D$
increases.
Particle distributions and p.d.f.s (
 $p(r)$
: dotted line,
 $p^{\ast }(r)$
: thick solid line,
 $p(r)$
for the Segre–Silberberg annulus: thin solid line and
 $p(r)$
for the inner annulus: dashed line) for various size ratios at
 $Re\sim 480$
and
 $L/D=258$
; (a,b)
 $d/D=0.052\,(Re=475)$
, (c,d)
 $d/D=0.065\,(Re=484)$
, (e,f)
 $d/D=0.084\,(Re=498)$
and (g,h)
 $d/D=0.11\,(Re=489)$
.

(a) Radial positions of the Segre–Silberberg annulus,
 $r_{s}$
, and the inner annulus,
 $r_{i}$
, for various size ratios, (b)
 $r_{s}$
versus
 $Re_{p}$
and (c)
 $\unicode[STIX]{x1D70E}_{i}$
versus
 $Re$
, at
 $d/D=0.052$
(squares), 0.065 (diamonds), 0.084 (circles) and 0.11 (triangles) for
 $L/D=258$
. In (b), *: Segre & Silberberg (Reference Segre and Silberberg1962) for
 $d/D=0.11$
,
 $-$
: Matas et al. (Reference Matas, Morris and Guazzelli2004) for
 $d/D=0.067$
,
 $+$
: Matas et al. (Reference Matas, Morris and Guazzelli2004) for
 $d/D=0.095$
, and -: Matas et al. (Reference Matas, Morris and Guazzelli2004) for
 $d/D=0.11$
. Solid and dashed lines represent the numerical results of Yang et al. (Reference Yang, Wang, Joseph, Hu, Pan and Glowinski2005) for
 $d/D=0.1$
and 0.15, respectively.

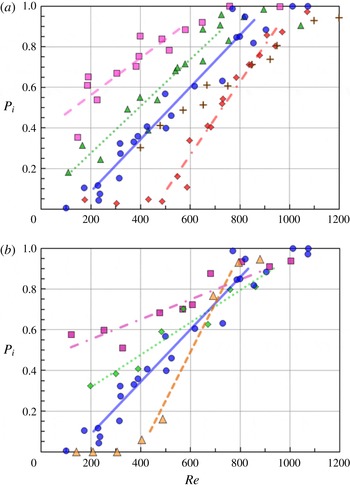
Figures 9(a) and 9(b) show the fraction of particles on the inner annulus,
 $P_{i}$
, as a function of
 $Re$
, for
 $d/D=0.084$
and various
 $L/D$
, and for various
 $d/D$
and
 $L/D=258$
, respectively. Each line in these figures represents linear regression in the range of
 $P_{i}$
from 0.1 to 0.9. Figure 9(a) indicates that
 $P_{i}$
increases monotonically with
 $Re$
for constant
 $L/D$
. It can be seen in figure 9(b) that
 $P_{i}$
is in general larger for smaller particles at constant
 $Re$
and
 $L/D$
. Matas et al. (Reference Matas, Morris and Guazzelli2004) adopted the tube 8 mm in diameter with the measurement site 2.5 m from the tube inlet, leading to
 $L/D=313$
. Their results for
 $d/D=0.095$
are also plotted in figure 9(a) for comparison. Most of their data for
 $L/D=313$
lie between two series of the present results for
 $L/D=258$
and 516, as expected.
(a) Probability of the inner annulus,
 $P_{i}$
, versus
 $Re$
at
 $d/D=0.084$
for
 $L/D=65$
(squares), 129 (triangles), 258 (circles) and 516 (diamonds), and (b)
 $P_{i}$
versus
 $Re$
at
 $L/D=258$
for
 $d/D=0.052$
(squares), 0.065 (diamonds), 0.084 (circles) and 0.11 (triangles). In (a), plus signs indicate the results of Matas et al. (Reference Matas, Morris and Guazzelli2004) for
 $d/D=0.095$
and
 $L/D=313$
.

Finally, using the linear regression lines shown in figures 9(a), 6(a) and 6(b), we plotted
 $P_{i}$
,
 $r_{i}$
and
 $\unicode[STIX]{x1D70E}_{i}$
as a function of
 $L/D$
for
 $d/D=0.084$
and several values of
 $Re$
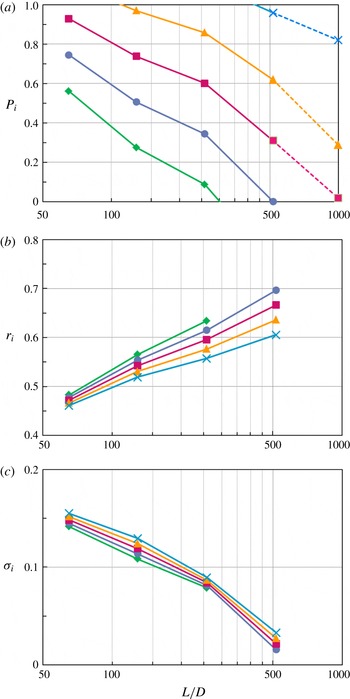
in figures 10(a), 10(b) and 10(c), respectively. The
 $P_{i}$
values obtained in the sub-millimetre tube experiment at
 $L/D=1000$
are also plotted in figure 10(a) for reference, and these results and corresponding results of the present study are connected by dashed lines. Figure 10(a) shows that
 $P_{i}$
for given
 $Re$
decreases with
 $L/D$
. Similarly, figures 10(b) and 10(c) show that
 $r_{i}$
increases and
 $\unicode[STIX]{x1D70E}_{i}$
decreases with
 $L/D$
. These results indicate that, as the flow passes downstream, the inner annulus approaches the Segre–Silberberg annulus with decreasing width and the particles on it shift to the Segre–Silberberg annulus.
(a) Probability of the inner annulus
 $P_{i}$
, (b) its radial position
 $r_{i}$
and (c) its width
 $\unicode[STIX]{x1D70E}_{i}$
, at
 $d/D=0.084$
for
 $Re=200$
(diamonds), 400 (circles), 600 (squares), 800 (triangles) and 1000 (crosses). In (a), the data at
 $L/D=1000$
were obtained from the submillimetre tube experiments.

4 Discussion
Figure 10(a–c) suggests that the inner annulus would disappear, i.e.
 $P_{i}=0$
, when the flow goes downstream a certain distance from the tube inlet for
 $Re<1000$
and
 $d/D=0.084$
. That is, all particles will be focused on the Segre–Silberberg annulus if the measurement site is further downstream beyond this distance. Thus, this distance corresponds to the entry length
 $L_{e}$
after which radial migration has fully developed. Figure 10(a) indicates that the entry length
 $L_{e}$
increases with increasing
 $Re$
.
The monotonic increase in
 $L_{e}/D$
with
 $Re$
seems contradictory to the conventional estimate of the entry length. The entry length
 $L_{e}$
was estimated from the magnitude of the radial force
 $F_{r}$
exerted on the particle, by assuming that
 $F_{r}$
is balanced by a viscous Stokes drag. Matas et al. (Reference Matas, Morris and Guazzelli2004) adopted
 $F_{r}=A(d/D)^{4}\unicode[STIX]{x1D70C}U_{m}^{2}D^{2}/4$
, which was derived from the matched asymptotic expansion theory and obtained
 $L_{e}/D\sim 6\unicode[STIX]{x03C0}/(ARe(d/D)^{3})$
, where
 $\unicode[STIX]{x1D70C}$
is the fluid density,
 $U_{m}$
is the maximum flow velocity and
 $A$
is a typical magnitude of the scaled outward force ranging from 0.2 to 0.3 for the plane (two-dimensional) Poiseuille flow at
 $Re=500{-}1500$
. As the asymptotic theory predicted a decrease in
 $A$
with increasing
 $Re$
, it was anticipated that the entry length will decrease slower than
 $Re^{-1}$
. Based on this formula, table 3 of Matas et al. (Reference Matas, Morris and Guazzelli2004) provided
 $L_{e}/D\sim 150$
at
 $Re=500$
and
 $L_{e}/D\sim 90$
at
 $Re=1000$
for
 $d/D=0.095$
in the two-dimensional Poiseuille flow. Later, the same authors (Matas et al.
Reference Matas, Morris and Guazzelli2009) performed a similar asymptotic expansion analysis for the (three-dimensional) Poiseuille flow in the circular tube, and reported that the predicted lateral force in the circular tube is significantly smaller than the result for the two-dimensional Poiseuille flow;
 $A=0.07{-}0.2$
at
 $Re=400{-}1500$
(Matas et al.
Reference Matas, Morris and Guazzelli2009, figure 5), where
 $A$
was taken as the maximum of the scaled lateral force. For the three-dimensional Poiseuille flow, the asymptotic theory predicted that
 $A\sim Re^{-0.84}$
in the range of
 $50\leqslant Re\leqslant 1750$
, which almost compensates for the
 $Re^{-1}$
dependence of
 $L_{e}/D$
in the above estimate. This implies a slow decrease in
 $L_{e}$
(
 ${\sim}Re^{-0.16}$
), but nonetheless a decrease with increasing
 $Re$
. In fact, it can be evaluated for the three-dimensional Poiseuille flow that
 $L_{e}/D\sim 400$
at
 $Re=400$
and
 $L_{e}/D\sim 340$
at
 $Re=1000$
for
 $d/D=0.084$
, the same size ratio as the data in figure 10.
Figure 10(a) shows that for
 $L/D=400$
and
 $Re=400$
,
 $P_{i}$
would be less than 0.2, indicating that most particles lie on the Segre–Silberberg annulus and the inertial migration has almost developed. However, for
 $L/D=340$
and
 $Re=1000$
,
 $P_{i}$
is equal to unity, indicating that all particles lie on the inner annulus. This discrepancy, as well as the opposite dependence of
 $L_{e}/D$
on
 $Re$
, indicates that the above estimate of the entry length
 $L_{e}$
was not realised in the present experiment. The asymptotic theory, as well as numerical analyses performed by Yang et al. (Reference Yang, Wang, Joseph, Hu, Pan and Glowinski2005), indicated a change of convexity in the radial force curve and its local minimum between the tube centre and the Segre–Silberberg annulus at elevated
 $Re({>}100)$
. Matas et al. (Reference Matas, Morris and Guazzelli2004) explained the second equilibrium position using the change of convexity in the radial force profile. They suggested that the particles could accumulate in the region near the local minimum of the radial force. Our preliminary numerical computation of the radial force acting on a spherical particle immersed in a three-dimensional Poiseuille flow (Yabu, Itano & Sugihara-Seki Reference Yabu, Itano and Sugihara-Seki2016) using an immersed boundary method (Nakagawa et al.
Reference Nakagawa, Yabu, Otomo, Kase, Makino, Itano and Sugihara-Seki2015) showed that the local minimum value of the radial force decreases significantly with
 $Re$
, much more steeply than the maximum value, but it is positive in the outward direction at
 $Re<1000$
for
 $d/D=0.08$
. Thus, if the entry length
 $L_{e}$
is evaluated in terms of the local minimum value of the radial force rather than the maximum value, then
 $A$
decreases more rapidly with
 $Re$
so that
 $L_{e}$
would be much larger than the above estimate at elevated
 $Re$
, and it could increase with increasing
 $Re$
. We will discuss about the entry length again below.
Yang et al. (Reference Yang, Wang, Joseph, Hu, Pan and Glowinski2005) performed a numerical simulation of the lateral migration of a single neutrally buoyant rigid sphere in tube flow by two methods of numerical computation (the arbitrary Lagrangian–Eulerian (ALE) and distributed Lagrange multiplier (DLM) methods) for
 $d/D\sim 0.1$
and
 $Re\leqslant 250$
. In this range of parameter values, they did not find multiple equilibrium positions, similar to the asymptotic expansion theories. Our numerical simulation also showed only one equilibrium position between the tube centre and the tube wall, corresponding to the Segre–Silberberg annulus, in the parameter range of
 $100<Re<1000$
and
 $d/D=0.08$
(Yabu et al.
Reference Yabu, Itano and Sugihara-Seki2016). Shao, Yu & Sun (Reference Shao, Yu and Sun2008) conducted a numerical computation of the trajectories of a line of spherical particles in a three-dimensional Poiseuille flow by the friction domain method, for the size ratio
 $d/D=0.1$
, 0.15 and
 $100\leqslant Re\leqslant 2200$
under a periodic boundary condition with length
 $l=D$
or
 $2D$
in the flow direction. They reported that the particle behaviour differed markedly depending on the size ratio
 $d/D$
and the periodic length
 $l/D$
; in the case of
 $d/D=0.15$
, the particles migrated to the Segre–Silberberg annulus for
 $Re\leqslant 1300$
(or 500) and to the inner annulus for
 $Re\geqslant 1000$
(or 640) at
 $l/D=1$
(or 2), whereas in the case of
 $d/D=0.1$
, closer to the present study, the particles migrated to the inner annulus for
 $Re\geqslant 1500$
at
 $l/D=1$
and exhibited an oscillatory motion near the radial position
 $r\sim 0.5{-}0.7$
for
 $Re=1200$
at
 $l/D=2$
. With regard to
 $Re<1000$
and
 $d/D=0.1$
, Shao et al. (Reference Shao, Yu and Sun2008) did not find the second equilibrium position. In this sense, their results were consistent with the present experimental study and our numerical simulation.
One important observation in the present study was that no particles were observed on the Segre–Silberberg annulus for rather large
 $Re$
, as shown in figures 3(i) and 5(a). It was particularly striking that the Segre–Silberberg annulus was absent even in the shortest tube (figure 5
a), as we expected a random distribution of particles over the tube cross-section at the entrance. If the particles enter the cross-section of the tube entrance randomly, then the particles located outside of the Segre–Silberberg annulus at the entrance would move to the Segre–Silberberg annulus, and therefore some particles were expected to be observed on the Segre–Silberberg annulus at downstream cross-sections. However, our experiments indicated that particles were absent on the Segre–Silberberg annulus as shown in figure 5(a), suggesting that particles placed outside of the Segre–Silberberg annulus at the entrance had passed this annulus in the inward direction to reach the inner annulus at that cross-section. This is one of the reasons why Matas et al. (Reference Matas, Morris and Guazzelli2004) considered the inner annulus as the only equilibrium position at high
 $Re$
.
In our experiments, a bell-shaped funnel was attached to the circular tube entrance to minimise disturbances in the flow. Our detailed observation of particle behaviour in the transverse direction, perpendicular to the tube axis, near the tube entrance from the transparent funnel to 60 mm downstream from the entrance showed that particles enter the tube smoothly and particles placed near the funnel wall move in the inward direction along the funnel wall. After entering the circular tube entrance, these particles were found to move almost parallel to the tube wall at low
 $Re$
(e.g.
 ${\sim}$
200), whereas at high
 $Re$
(e.g.
 ${\sim}$
800) they continue moving in the inward direction beyond the supposed radial position of the Segre–Silberberg annulus. This inward migration was seen near the tube wall over the entire length of the observation up to 60 mm downstream from the tube entrance at
 $Re\sim 800$
. It is not yet clear how far from the tube inlet this inward migration continues. However, particles located inside the Segre–Silberberg annulus began moving in the outward direction to form the Segre–Silberberg annulus at downstream cross-sections, as shown in figure 5(c–h).
This inward migration of particles observed near the tube entrance at high
 $Re$
may be due to the inertial effect of particles moving along the wall of the bell-shaped funnel or strong repulsive forces exerted on particles near the tube wall; particles migrating at rather large velocity will retain their inward motion to cross the equilibrium position. As explained by Asmolov (private communication), the inward migration in the entrance region may be due to extra lift force associated with a longitudinal slip velocity in the entrance region. Another possible explanation may be the expected lack of an equilibrium position in a developing flow where the balance of forces is changing axially. The development length from the tube entrance to reach the Poiseuille flow can be estimated as
 ${\sim}(Re/30)\times D\sim 200~\text{mm}$
for
 $D=7.75~\text{mm}$
at
 $Re=800$
(Tritton Reference Tritton1988). The length of our transverse observation (60 mm) was well within this development length (200 mm), and therefore the profile of the lateral force may be different from that in the Poiseuille flow and the Segre–Silberberg annulus may not be an equilibrium position in the developing flow.
The axial development of a flow entering a tube or a channel has been well understood as the evolution of the boundary layer formed adjacent to the wall; the fluid next to the wall is slowed due to the no-slip condition and this retardation near the wall spreads inwards owing to viscous effects as the flow goes downstream. The slowed-down fluid close to the wall causes the fluid at inner radii to move faster, as to satisfy the incompressible condition keeping the volume flow rate across the cross-section constant. Eventually, this boundary layer has developed in the whole cross-section where the velocity profile has reached the fully developed state of the Poiseuille flow. Although the physical mechanism of the developing flow has been well described, a wide range of contradictory data seems to exist with respect to the development length. Durst et al. (Reference Durst, Ray, Unsal and Bayoumi2005) reviewed the existing literature and based on the results of their numerical analysis, they obtained the expression of the development length
 $L_{d}\sim [(0.619)^{1.6}+(0.0567Re)^{1.6}]^{1/1.6}\times D$
. By the use of this formula, the development length is estimated to be
 ${\sim}$
350 mm for
 $D=7.75~\text{mm}$
at
 $Re=800$
. This length is nearly twice as large as the above estimate, but it can be confirmed again that this length is much larger than the length of our transverse observation (60 mm).
In the developing flow, the numerical analysis of Durst et al. (Reference Durst, Ray, Unsal and Bayoumi2005) showed the presence of an overshoot of the velocity profile close to the wall, so that the so-called saddle-shaped velocity profile is realised where the velocity maxima appear near the wall. A similar velocity profile was also obtained experimentally in the entrance region of microchannel flows (Ahmad & Hassan Reference Ahmad and Hassan2010). For a spherical particle suspended in such non-monotonic velocity profile flows, Keinan, Ezra & Nahmias (Reference Keinan, Ezra and Nahmias2015) estimated the shear-induced lift force exerted on the particle in rectangular channel flows, based on the theory of Ho & Leal (Reference Ho and Leal1974), and reported that saddle-shaped velocity profiles form focusing points of the particles on the inner edge of the velocity maxima, close to the channel centre. If the same discussion can be applied to the circular tube flows, this could account for the absence of the Segre–Silberberg annulus in the region near the tube entrance observed in the present study.
Figure 9(a) suggests that the Segre–Silberberg annulus would be absent at the cross-section nearest to the tube inlet (
 $L/D=65$
) for
 $Re>700$
and
 $d/D=0.084$
. Figure 10(a) suggests that all particles would be focused on the Segre–Silberberg annulus if measurements sites were further downstream beyond the entry length for
 $Re<1000$
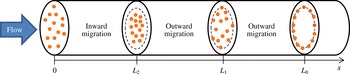
. In such cases, we illustrate schematically the evolution of the particle migration in figure 11. The variable
 $x$
denotes the distance from the tube inlet. After entering the tube entrance randomly at
 $x=0$
, particles show the inward migration first, and then turn into the outward migration at
 $x=L_{2}$
. Based on the above discussion on the developing flow, the length
 $L_{2}$
may be approximated by the development length
 $L_{d}$
. For
 $x>L_{2}$
, particles continue migrating in the outward direction to reach the Segre–Silberberg annulus at
 $x=L_{1}$
. Further downstream at
 $x=L_{0}$
, all particles are focused on the Segre–Silberberg annulus.
Evolution of the particle migration with axial position at relatively high
 $Re$
(
 ${<}\,$
1000 for
 $d/D\sim 0.08$
).

The two lengths of
 $L_{1}$
and
 $L_{0}$
may be evaluated from the
 $P_{i}$
curves shown in figure 10(a). The intersection of each
 $P_{i}$
curve and the horizontal line of
 $P_{i}=1$
corresponds to the length
 $L_{1}$
, at which the Segre–Silberberg annulus emerges. Similarly, the intersection with the horizontal line of
 $P_{i}=0$
corresponds to the length
 $L_{0}$
, which represents the entry length.
 $P_{i}$
curves shown in figure 10(a) are nearly parallel to each other, suggesting that
 $\unicode[STIX]{x1D6E5}=\log L_{0}{-}\log L_{1}=\log (L_{0}/L_{1})$
is almost independent of
 $Re$
. This implies that
 $Re$
dependence of
 $L_{0}$
and
 $L_{1}$
are roughly the same; both increase with
 $Re$
in a similar fashion. This shows a sharp contrast to the length scale
 ${\sim}Re^{-1}$
at very low
 $Re$
(Segre & Silberberg Reference Segre and Silberberg1962) and
 ${\sim}Re^{-0.16}$
from the asymptotic theory mentioned above (Matas et al.
Reference Matas, Morris and Guazzelli2009).
The estimate of the entry length
 $L_{e}\,({\sim}Re^{-0.16})$
based on the asymptotic theory may be plausible to describe the outward migration of particles between
 $x=L_{2}$
and
 $L_{1}$
or
 $L_{0}$
, since the flow has fully developed at
 $x>L_{2}$
. However, both of
 $L_{1}$
and
 $L_{0}$
increase steeply with
 $Re$
, whereas
 $L_{2}\,({\approx}L_{d})$
increases almost linearly, indicating that the differences
 $L_{1}{-}L_{2}$
or
 $L_{0}{-}L_{2}$
would increase with
 $Re$
. This dependence is also contrary to the above estimate
 $({\sim}Re^{-0.16})$
. Further studies will be needed to clarify the underlying mechanism of the length scale observed.
This trend of the length scale is different from that observed in the channel flow of square cross-sections (Miura et al.
Reference Miura, Itano and Sugihara-Seki2014; Nakagawa et al.
Reference Nakagawa, Yabu, Otomo, Kase, Makino, Itano and Sugihara-Seki2015), where the entry length is generally smaller for larger
 $Re$
in the
 $Re$
range considered here. It may be also noticeable that an increase in
 $Re$
beyond a certain value (
 ${\sim}150{-}200$
for
 $d/D\sim 0.1$
) generates an inward shift of the equilibrium position placed at the centre of the channel faces in the rectangular channel flow, while the Segre–Silberberg annulus in the circular tube flow shows a monotonic outward shift with increasing
 $Re$
. More detailed analyses are necessary to elucidate the cause of these differences, depending on the shape of the tube cross-section.
Matas et al. (Reference Matas, Morris and Guazzelli2004) performed experiments with wider ranges of parameter values,
 $0.024\leqslant d/D\leqslant 0.125$
and
 $67\leqslant Re\leqslant 1700$
, with
 $L/D=313$
. In the range of
 $Re$
studied here
 $(100<Re<1100)$
, our results were consistent with previous studies with regard to the
 $Re$
and
 $d/D$
dependence of the particle distribution, as discussed above. Although the present study suggested that the inner annulus is not an equilibrium position for
 $100<Re<1000$
and
 $d/D\sim 0.08$
, further studies are necessary for larger
 $Re$
and/or larger
 $d/D$
. The numerical study of Shao et al. (Reference Shao, Yu and Sun2008) indicated that the critical Reynolds number for the onset of the inner equilibrium position is 1500 for
 $d/D=0.1$
and 1000 for
 $d/D=0.15$
at
 $l/D=1$
. Our numerical study showed that the local minimum value of the radial force profile for
 $d/D=0.08$
decreases with increasing
 $Re$
, and it approaches zero at
 $Re=1000$
, as noted above. A further increase in
 $Re$
was found to decrease the radial force to be negative, implying that a new stable equilibrium position would appear closer to the tube centre than the Segre–Silberberg annulus (Yabu et al.
Reference Yabu, Itano and Sugihara-Seki2016). This may correspond to the emergence of the inner annulus, although we need more detailed assessments of the numerical accuracy. Experiments for
 $Re>1100$
could not be performed due to the limitation of the experimental apparatus mainly with regard to the height of the upstream tank. Our new experimental system that is currently in development will enable us to examine various cases of wider parameter values, including higher
 $Re$
as well as larger
 $d/D$
.
5 Conclusions
Experimental measurements of the distribution of neutrally buoyant spherical particles in circular tube flow for
 $d/D\sim 0.1$
and
 $100<Re<1100$
showed that, although the particles were observed on the inner annulus as well as on the Segre–Silberberg annulus at relatively high
 $Re$
, the ratio of the particles on the inner annulus decreased further downstream. These results suggest that the inner annulus would disappear and all of the particles would be focused on the Segre–Silberberg annulus as the flow goes downstream beyond the entry length from the tube inlet. The entry length was found to increase with increasing
 $Re$
in contrast to the conventional estimate, which may be related to the developing flow in the entrance region where the radial force profile is different from that of the fully developed Poiseuille flow and the Segre–Silberberg annulus may not be an equilibrium position.
Acknowledgements
We gratefully acknowledge the useful remarks of Professor Asmolov who was one of the reviewers of the paper. This research was partially supported by the ORDIST group fund at Kansai University.