


1. Introduction
Sea ice can in many cases grow under turbulent conditions (see, e.g. Reference Weeks and AckleyWeeks and Ackley, 1982). This process may be divided into several stages: (1) formation of tiny frazil crystals kept in suspension in the upper ocean by wind- and wave-generated turbulence; (2) accumulation of a surface frazil-ice or grease layer when the turbulence ceases; and (3) freeze-up of the mush into a solid-ice cover. Under the presence of a wave field, stage (3) is often accompanied by the formation of pancakes growing in size and thickness and, after some time, freezing together. During the grease– pancake transition the ice becomes less saline, colder and thus stronger (Reference Onstott, Grenfell, Perovich and SwiftOnstott and others, 1998; Reference Leonard, Shen, Ackley, Shen and BalkemaLeonard and others, 1999; Reference Doble, Coon and WadhamsDoble and others, 2003). It also changes its mechanical properties due to wave-induced convergence, pancake size growth and agglomeration. the process proceeds essentially by thermodynamic–dynamic coupling. For example, ice strength due to freezing may affect the size of pancakes and hence wave propagation (e.g. Reference Shen, Ackley and YuanShen and others, 2004), and, in turn, the dynamics may be expected to influence cooling rate and desalination of the ice cover.
While several studies have been concerned with the dynamics of grease ice in a wave field (e.g. Reference Martin and KauffmanMartin and Kauffman, 1981; Reference Leonard, Shen, Ackley, Shen and BalkemaLeonard and others, 1999;Reference Wang and ShenWang and Shen, 2010), rather little work has been concerned with its thermodynamics. of particular interest is the internal solid-ice volume fraction (v s) of the grease/pancake-ice–brine mixture, which is expected to have a strong impact on its mechanical properties and desalination rates (e.g. Reference Weeks and AckleyWeeks and Ackley, 1982).
Here we focus on the solid volume fraction of grease ice and examine how it evolves with ice temperature and salinity when it is transformed into pancakes, based on observations from a controlled tank experiment. After describing the experimental set-up we outline our thermodynamic calculations and methods. We discuss the results in terms of limited earlier work and relevance for future grease–pancake modelling.
2. Experiment and Instruments
The work described here is part of the REduced ice Cover in the ARctic Ocean (RECARO) project that took place at the Hamburg Ship Model Basin, Germany, where various scenarios of ice growth were tested in the temperature-controlled room (Reference WilkinsonWilkinson and others, 2009). the freezing experiment we describe was conducted between 31 October and 2 November 2007 in a 19 m long and 3 m wide tank filled with a NaCl water solution to 0.85m depth. A schematic layout of the tank and instrument set-up is given in Figure 1. Ice growth took place under the presence of waves generated by a single-stroke flap-type paddle located on one end of the tank. the opposite end of the tank consisted of a shallow water area (marked as ‘Beach’ in Fig. 1) designed to dampen the waves (Reference WilkinsonWilkinson and others, 2009; Reference Wang and ShenWang and Shen, 2010). We focus on the thermodynamic evolution of the ice cover during the final 25.3 hours of a 2 day long experiment. During the first day, under constant-frequency waves of 0.66 Hz and 5 cm amplitude, a grease-ice cover of 8–10 cm thickness had formed. the wave amplitude was then reduced to 2.6 cm and the transition from a predominately grease-ice to pancake-ice cover took place during day 2.
Tank and instrumental layout (not to scale).

2.1. Air, water and ice observations
Air temperature was recorded near the roof of the tank at approximately 2.5 m height. Underwater pressure transducers placed at the left wall of the tank (when facing from wave maker towards beach) recorded the wave amplitude. Several thermistors placed on this wall provided temperature information at different levels across the ice/water surface.
Water electrolytic conductivity and temperature were measured (with a sampling interval of 15 s) with two MicroCat SBE37-SM conductivity-, temperature- and depth-measuring devices (CTDs) placed stationary at the centre of the tank, at 0.6 and 0.8 m depth. To convert from conductivity to NaCl salinity we use the UNESCO algorithms (Reference Fofonoff and MillardFofonoff and Millard, 1983) modified to account for a higher conductivity of an aqueous NaCl solution compared with sea water (e.g. Reference KaufmannKaufmann, 1960). We apply a standard conductivity of 45.3172 mS cm–1 at 15˚C and 35 g kg–1 NaCl.
The sampling procedure of in situ frazil-ice samples was adopted from earlier studies (e.g. Reference WilkinsonWilkinson, 2005; Reference Smedsrud and SkogsethSmedsrud and Skogseth, 2006) using a transparent plastic cylinder of 89.07 mm diameter, open at both ends and with a 22.98 mm diameter stick through the middle with a bottom rubber lid. the cylinder was lowered through the frazil ice until the lower edge was well below the ice surface and the stick pulled up to entrap the sample and seal off the bottom with the rubber lid. the cylinder was then lifted to measure the undrained frazil-ice thickness (to ±0.5 cm accuracy) using a centimetre measuring scale fixed to the cylinder. Every 4 m along-tank (refer to Fig. 1) the frazil ice was collected in a hand-held sieve to drain off the water for several minutes, before melting it in bottles at room temperature. the salinity of the melted frazil/brine samples was inferred from measuring their conductivity with a hand-held WTW LP191 conductimeter (accurate to ±0.1 mScm–1). Sample weight and volume were obtained using a standard measuring scale (accurate to ±0.01 g) and a volumetric flask (accurate to ±0.1 mL), respectively.
Surface brightness temperature, T B, was recorded with a thermal infrared (IR) camera (VarioCAM hr 384 M, manufactured by JENOPTIK) mounted at 2.4m height above the water/ice surface. the instrument provided IR temperature images in the 7.5–14 μm band with 7.6 Hz sampling rate and a field of view (FOV) of 15˚×12˚. At the given height, the surface viewed was 66 cm×52cm (384×288 pixels) with 1.72 mm pixel resolution. To reduce side-lobe effects we omit rim pixels and use the inner 354×280 pixels for our image analysis. A 5 s running mean was applied to the T B fields to reduce the wave-induced fluctuations. the manufacturer reports a temperature resolution better than 80mK and an accuracy of ±1.5 K. As described in section 3, we convert brightness temperature to physical temperature (T B = ɛT s) on the basis of water temperature peaks.
3. Ice Temperature and Thermodynamics
The following framework of calculations and equations is used to estimate ice temperature, salinity and solid volume fraction of the evolving ice cover and to separate these into area contributions from frazil ice and pancake ice.
3.1. Surface emissivity and grease–pancake thresholding
To derive surface temperatures from the observed IR brightness temperatures (T s = T B/ɛ) one needs to know the emissivity, ɛ. However, literature values show a rather wide range due to variable background radiation, surface roughness and incidence angles (e.g. Reference Rees and JamesRees and James, 1992). We approach this problem by taking into account the character of the wavy ice field and assume that, due to convergence and divergence as well as brine convection, some pixels in our 60 cm ×50 cm FOV will always reflect the water temperature, T w, monitored below the ice. We hence calculate an effective ɛ by assuming that the 1% highest T B in each image determines ɛ = T B/T w. This approach yields ɛ between 0.9953 and 0.9978 for the IR images (Fig. 2a), with no apparent time dependence and a mean of 0.9968±0.0033. This standard deviation in ɛ corresponds to a temperature uncertainty of 0.09 K. That local pixel temperatures may occasionally exceed the water temperature by 0.1 K (Fig. 2b) may be interpreted as instrumental noise (within the temperature range of the IR camera resolution) and is not considered further here.
(a) Surface emissivity estimate for all IR T B image field maxima using T w as the ɛ = T B/T w calibration threshold. (b) Water temperature, T w, and freezing temperature, T f, in relation to T s maxima, with corresponding 0.5 hour running mean, and median frazil temperatures. (c) Median frazil T s and median and minimum pancake T s evolution. All T s in (b) and (c) were derived using mean ɛ = 0.9968 as a constant.

We attempted to classify the ice types by several automatic thresholding algorithms (HistThresh MATLAB Toolbox provided by A. Niemistö , 2004, http://www.cs.tut.fi/~ant/histthresh/). During the first 7 hours of the experiment, while frazil was dominant and few pancakes were visible, the algorithm from Reference Kittler and IllingworthKittler and Illingworth (1986) rendered the most stable threshold of 270.0±0.1 K. Other histogram-based algorithms produced much larger scatter of ±0.2–0.4 K. This is likely related to the fact that the frazil and pancake modes are not well separated in the histogram, and to the appearance of a third mode between the warm frazil and cold pancake peaks, associated with the rim of the pancakes. However, we found by manual threshold determination that the automatic threshold of 270.0 K overestimates the pancake fraction. A value of 269.5±0.1 K gives the most realistic pattern over the course of the experiment (see Fig. 3a and b). This revised threshold matches the intermediate mode associated with the pancake rim, which gives us confidence in our segmentation procedure.
(a) Evolution of frazil (white) and pancake (black) area cover during selected times, estimated from constant threshold set at 269.5. (b) Corresponding histogram for same times as given in (a), showing the constant threshold (dashed line) used to estimate frazil and pancake area covers. the histogram temperature range, T range, and mean difference, T diff, between frazil and pancake median temperatures are also given.

With the temperature threshold determined we calculated frazil and pancake area fractions, A Fr and A Pk, for each image by selecting the pixels above and below, respectively. Extreme temperature values were caused at times, particularly by pancake rims and by ice crystals falling from the rooftop onto the surface measured by the IR camera. We thus assign characteristic temperatures for pancake ice and for frazil ice by calculating the median temperature value of the distribution of temperatures for each ice class.
3.2. Solid-ice volume fraction
In the following we make the assumption that brine salinity (S b) in the ice is at its freezing point, for which we use:

obtained by Reference MausMaus (2007) on the basis of data compiled for NaCl solutions. For an NaCl salinity of 32 g kg–1 this gives T f = –1.912˚C.
Neglecting the air bubble content, we consider frazil and pancake ice as a mush of liquid (brine) and pure solid (ice) with densities ρ b and ρ s, brine volume fraction v b and solid-ice volume fraction v s = (1– v b). Frazil-ice density and salinity are then given as ρ i = ρ b v b + ρ s(1 – v b) and S i ρ i =v b ρ b S b, respectively. These then may be combined to obtain the solid-ice volume fraction
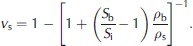
Ice density ρ s = 917 kgm–3 is assumed constant while ρ b = 1000 + 0.77S b kgm–3 sufficiently approximates the brine density of our NaCl solution for our purpose and property range. Equation (2) thus yields the dependence of v s on ice and brine salinities. Below we also apply it to obtain the ice salinity S i when v b and S b are known.
Our ice-sampling procedure involves the loss of some brine after which the salinity was reduced to S im. As we will discuss further in a future paper, the frazil solid fraction, v s, may be derived as
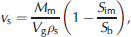
where V g is the measured grease/frazil-ice volume before drainage, M m and S im the measured mass and salinity of the samples after drainage, and S b the brine salinity. Although salinity S im depends on the drainage protocol which may vary widely, we can reconstruct the true frazil-ice salinity S i(Fr) before drainage by combining Equations (2) and (3). S b was not measured directly, but estimated by assuming thermodynamic equilibrium with the temperature in the ice (Equation (1)). For loose grease ice, observations indicate that only a thin surface layer is below the freezing point of sea water (Reference Martin and KauffmanMartin and Kaufmann, 1981).
We use S b corresponding to the freezing temperature T f of the tank salt water from Equation (1), but for solid pancake ice we assume a linear temperature profile between surface temperature T s and T f. By integrating Equations (1) and (2) we obtain an average v s.
3.3. Ice growth estimation
From the initial cooling period, prior to the onset of ice growth, we determined the heat flux in the tank from the cooling rate of the water as  with T
w as the water temperature, water depth H
w = 0.85 m, water density ρ
w = 1027 (kgm–3) and the specific heat capacity cp
= 4020.6 (J kg–1 K–1) assuming a salinity of 32 g kg–1 NaCl. We converted the heat flux Q
s~82.3± 5.0Wm–2 to an effective heat transfer coefficient for the air–water surface (Wm–2 K–1) as k
a = Q
s
/(T
w = T
a) = 6.9±0.3, with T
a being the air temperature measured at 2.5 m height near the roof of the tank. This cooling period was too short to discriminate clearly whether cooling and freezing in the tank proceeds with constant Q
s or constant k
a. However, evaluating the ice production during day 1 clearly supported the constant Q
s model used in the present work. Such a result is expected because the thermostat on the laboratory roof maintained a constant temperature and thus heat was extracted continuously. Based on the heat flux we can compute the change in the average solid-ice fraction, v
s, as

where L f is the latent heat of fusion (L f = 330.7 kJ kg–1 for an NaCl solution at –2˚C, as in Reference MausMaus, 2007), pure ice density σ s = 917 kgm–3 and H i is the mean thickness of the ice. the approach neglects changes in specific heat once freezing takes place (justified for the small temperature changes under consideration). Similar frazil- and pancake-ice thicknesses were observed over the duration of the experiment. This allows us to assume the same ice thickness for frazil and pancake ice and split up the average solid fraction into the pancake and frazil contributions as follows:

3.4. Ice salinity estimates
Our sampling procedure allows us to determine the undrained salinity S i(Fr) of frazil ice. However, due to rapid brine drainage upon lifting pancakes, the true in situ salinity is more difficult to obtain. an alternative estimate of overall (frazil and pancake) ice salinity may be obtained from the salinity increase in the tank water, assuming that all salt released from growing ice is well mixed into the water below and recorded with the CTD instruments. the salt balance may then be written as

where H o is the water level in the tank, ρ w the water density and ρ i the frazil- or pancake-ice density. Monitoring the change in water salinity, S w, from its initial value, S wo, at the onset of ice formation, and the ice thickness, H i, gives the ice salinity.
This average ice salinity, S i, may be further divided into the frazil and pancake contributions:

As in Equation (5), we made the assumption that frazil and pancake thickness are the same. We also neglect the small difference in frazil- and pancake-ice densities.
4. Results
During the investigation period, the air temperatures remained between –11.3˚C and –9.3˚C, with no apparent trend. Frazil-ice thickness determined by averaging over three sampling locations was between 7.5±1.5cm and 10.0±1.5 cm, with an average of 8.8 cm and no apparent temporal or spatial trend. the corresponding frazil-ice salinity derived from Equations (2) and (3) was also rather constant at 25.2 ±0.6 g kg–1. However, the overall tank water salinity increased by 0.7 g kg–1, while water temperature decreased by 0.04 K, consistent with the slight freezing-point lowering due to the salinity change.
4.1. Surface area cover and temperature evolution
The clearest transition that we observed by eye during the experiment is the evolution from a frazil-ice cover into a pancake-ice cover. According to our segmentation, this transition begins after 2–3 hours (Fig. 4). the fluctuations seen in Figure 4 are associated with a limited number of pancakes travelling through the FOV of the camera and are not expected to be representative of the entire tank. Also, the slight decrease of pancake area fraction towards the end of the experiment is most likely a consequence of the limited FOV. However, the surface temperature segmentation of frazil and pancakes indicates that the transition takes approximately 10–15 hours. Images and histograms that illustrate this transition and the evolution of the temperature modes are shown in Figure 3a and b.
Evolution of pancake percentage area cover (A Pk) derived from two methods: histogram thresholding within FOV of the camera (triangles), and salt and heat budget from Equations (2), (5), (6) and (7) (solid thick curve). Lighter curves show the respective ± standard deviation from the latter. Frazil cover may be estimated as A (Fr)=1–A (Pk).

Figure 2b shows that, in addition to its constant salinity and thickness, the median frazil surface temperature does not show a trend and appears to fluctuate by 0.1 K about its mean of –2.47˚C, while pancake temperatures decrease during the experiment (Fig. 2c). Also, the 30 min averaged maximum T s of the frazil ice remains typically 0.1 K below the freezing point (Fig. 2b). It shows, however, some low-frequency fluctuations and two distinct minima that appear to be associated with maxima in the pancake area fraction (after 8 and 16 hours), seen in Figure 4. Such a result appears reasonable as it suggests that divergence and upwelling of warm sea water decreases when pancakes are closely packed.
4.2. Ice salinity and solid fraction
We proceed to estimate the average ice salinity, S i(Fr+Pk), from the increasing water salinity according to Equation (6). However, uncertainties in ice thickness and the water salinity after the previous experiment (initial S wo at onset of freezing) likely correspond to a 20% uncertainty in the CTD-derived averaged ice salinity. We thus calibrate S wo by requiring Equation (6) to match the frazil salinity S i(Fr) = 25.2 after 2 hours, consistent with the onset of pancake formation. the resulting S i(Fr+Pk) is shown as the dashed curve in Figure 5. We then combined Equations (5) and (7) to estimate the pancake salinity evolution. the result, smoothed with a 0.5 hour running mean, is shown as the thick dashed line in Figure 5. As with the pancake area fraction, we do not expect the fluctuations to present true changes in basin-averaged pancake salinity. However, the range of 18–22 g kg–1 for the period when a substantial pancake-ice cover is established (after 7 hours) may be interpreted as typical salinities of young pancakes, obtained from salt budget and surface histogram thresholding. Thus, during the transition stage, pancakes are on average 3–7 g kg–1 less saline than the frazil ice from which they form.
Frazil-ice salinity (stars) from reconstructed undrained in situ samples S i(Fr) using Equations (2) and (3). the bars correspond to ±1 standard deviation. Total S i(Fr+Pk) estimate (thick dashed line) from water S w (Equation (6)), pancake-ice salinity S i(Pk) (thin dashed curve) estimated from histogram thresholding (Equation (7)) and S i(Pk) (thick solid curve) from salt and heat budget model (Equations (2), (5), (6) and (7)). the thin dashed curves above and below this last curve represent the error bounds when using Q s±5Wm–2. All curves are shown as 0.5 hour running means.

Combining the CTD-derived pancake- and frazil-ice salinities with ice surface temperatures for frazil and pancake, we computed, using Equations (1) and (2), the solid volume fraction, v s. As mentioned previously, for grease ice we assume the mush to be at the freezing point of the water below. For pancake ice we assumed a linear temperature profile between the ice surface and the freezing point at the ice–water interface. These results are shown in Figure 6. the mean solid fraction obtained from the observed frazil-ice salinity is 0.266±0.026. Owing to the small salinity variations, this value remains almost constant throughout the experiment. For the pancake ice, solid fractions rapidly increase at the beginning of pancake formation (3–7 hours), but this may in turn just be due to the frazil–pancake transition. Considering again the pancake results after measurement hour 7 as the most reliable, we find that the initial solid-ice fractions in pancakes lie within the range 0.5–0.6, increasing towards the end of the experiment. Largest values of 0.63 are associated with the lowest pancake temperatures.
Frazil solid-ice volume fraction, v s (stars), derived from undrained samples S i(Fr) (Equation (2)), total v s (thick dashed line) from atmospheric heat budget (Equation (4)), pancake v s (dotted curve) derived from salinity S i(Pk), area covers and T i profile estimated using median pancake T s, and pancake v s (thick solid curve) derived from salt and heat budget (Equations (2), (5), (6) and (7)). the thin dashed curves above and below this last curve represent the error bounds when using Q s±5Wm–2. All curves are shown as 0.5 hour running means.

So far we have only combined the salt budget (Equation (6)) with the area fractions from surface temperature segmentation. Our next step is to include the heat flux and corresponding solid fraction budget (Equations (4) and (5)). To be consistent with the salt budget we match the solid fraction 0.266 estimated for the frazil samples at the onset of pancake formation, after 2 hours. We then solve Equations (1), (2) and (4–7) iteratively to obtain the average salinity, solid fraction and area fraction of pancakes. This approach matches salt and heat budget and thus is not dependent on the limited FOV. the results are shown as solid curves in Figures 4–6, with the sensitivity to a 5 Wm–2 heat flux uncertainty indicated. Pancake salinities are lower than from the surface segmentation approach and decrease from 18 to 15 g kg–1, while solid fractions are higher, increasing from 0.6 to 0.7. the corresponding prediction of the pancake area coverage is much less than from surface segmentation.
5. Discussion
The focus of our study was to combine temperature and salinity data of air, ice and water to evaluate the thermodynamic and morphological evolution of grease ice to a pancake-ice cover. In the experiment the wave amplitude was changed, after establishment of an 8–10 cm thick grease-ice cover, from 5.0 to 2.6 cm. Since the ice thickness remains relatively constant from this time onward, dynamic ice growth is negligible and thus justifies the simplified thermodynamic evaluation presented. We have, based on the equations and data described in section 3, determined (1) the average salinity and solid-ice volume fraction of frazil-ice samples and obtained (2) the temporal evolution of frazil and pancake area fractions and surface temperatures. the latter was obtained from histogram-based segmentation of IR images. For constant grease properties we then derived (3) the average salinity and solid-ice volume fraction of the pancake ice from these segmentation results and the salt budget from the change in observed water salinity. We also determined (4) an alternative estimate of pancake area fraction, salinity and solid-ice fraction by a combination of salt budget, IR-based surface temperature and heat flux integrals.
The heat-flux-based method yields maximum pancake area fractions of 57% compared with the FOV-limited surface retrievals of 80–90%. This difference may be explained as follows: Pancakes are often observed to have a non-uniform thickness (e.g. Reference Onstott, Grenfell, Perovich and SwiftOnstott and others, 1998; Reference Doble, Coon and WadhamsDoble and others, 2003), rather than being column- or penny-shaped. If we approximate their shape as a half-ellipsoid, then the ratio of column to ellipsoid volume with the same surface area would be 3/2. This factor corresponds to the difference between our surface-based area fractions and the heat-flux-based results, making the values of 57% and 80–90% consistent. Hence, while the triangles in Figure 4 correspond to pancake area fractions, their volumetric fraction of the total ice mass is given by the solid curve. This consideration also implies that the salinities and solid-ice volume fractions from the heat budget are the correct pancake values in Figures 5 and 6, because surface-based values overestimate the pancake volume. This is an important result concerning proper simulation of thermodynamic–dynamic interactions.
We found a rather constant frazil-ice salinity of 25.2± 0.6 g kg–1 over the 25 hour course of the frazil–pancake transition. These stable frazil salinities represent a grease-ice stage close to the pancake transition, while early grease-ice salinities measured by us during RECARO were larger (29–31 g kg–1 or up to 90% of the sea-water salinity). We suppose that such high values have been overlooked in many previous studies where only salinities of ‘drained’ frazil samples were discussed (Reference Martin and KauffmanMartin and Kauffman, 1981; Reference Doble, Coon and WadhamsDoble and others, 2003; Reference WilkinsonWilkinson, 2005; Reference Smedsrud and SkogsethSmedsrud and Skogseth, 2006). However, we consider that it is the undrained salinity that should be used in thermodynamic and dynamic modelling of frazil ice. Our drained sample salinities were 17.3±0.6 g kg–1 and the corresponding derived undrained in situ values are thus 46% larger. For the early frazil samples we found even larger differences of >10 g kg–1 (not shown). Salinity variations of drained samples may, to some degree, reflect the structure and permeability of frazil ice. We expect them to depend on the drainage protocol, which makes intercomparison with previous studies difficult. However, we note that drained frazil salinities obtained in the same tank and similar growth stage by Reference WilkinsonWilkinson (2005) were 16–21 g kg–1 and similar to our observations.
Our heat-flux-derived pancake salinities decay, after an initial jump, from 18 to 15 g kg–1. Owing to the transition period, this result corresponds to an average over pancakes of different ages, and only at the onset of pancake formation do we find indications of larger pancake salinities approaching the frazil values. Values at this high end have been reported for both field and laboratory pancake ice (Reference Onstott, Grenfell, Perovich and SwiftOnstott and others, 1998; Reference WilkinsonWilkinson, 2005). However, salinities of pancakes, between a few hours and a day old, fall mostly between 10 and 15 g kg–1 (Reference Onstott, Grenfell, Perovich and SwiftOnstott and others, 1998; Reference Doble, Coon and WadhamsDoble and others, 2003; Reference WilkinsonWilkinson, 2005). Our derived rapid decay in average pancake salinity is consistent with the pancake desalination to half the frazil values during 10–14 hours reported by Reference Onstott, Grenfell, Perovich and SwiftOnstott and others (1998). Some loss of brine during sampling is also expected for pancakes, yet the problem appears to be much less serious than for frazil samples.
We emphasize, in addition to the stable frazil salinity, our finding of a rather constant frazil surface temperature (–0.5 ±0.1 K below freezing) and solid fraction 0.266±0.026. This indicates that grease ice, which may be arranged very loosely during early stages of accumulation, saturates at a certain solid fraction before it converts to pancakes. We note that Reference Martin and KauffmanMartin and Kauffman (1981) and Reference Smedsrud and SkogsethSmedsrud and Skogseth (2006) both use different derivations of solid-ice volume (the former did not account for residual salinity and the latter did not account for ice and water density difference). If we thus recompute the lowest ice volume fractions reported by them, according to our Equations (2) and (3), then we estimate minimum volume fractions of 0.12–0.15 and 0.19–0.22, respectively, from their data. Similar initial frazil samples were obtained during RECARO (not shown). We thus speculate that typical natural grease ice, first accumulated at solid volume fractions of 0.1–0.2, is compacted to 1.5–2.0 times this value before it transforms into pancakes. the details of this compaction will likely depend on the microstructure of frazil crystals, which may in turn depend on growth conditions and yield a variable growth-dependent grease– pancake transition threshold.
Our best estimate of the frazil–pancake transition surface temperature threshold is –2.78˚C. To compute the solid-ice volume fraction, we assume a linear temperature gradient between this temperature and a freezing point of –1.98˚C and integrate Equation (2) with S b determined by Equation (1). Together with the frazil salinity (25.2±0.6 g kg–1), marking an upper pancake salinity limit, Equations (1) and (2) yield a typical solid-ice volume fraction of 0.37–0.40 for the transition between grease ice and pancake ice. Furthermore, during the very early desalination, pancakes appear to approach very rapidly a value of 18–19 g kg–1, which, using the same linear temperature integration, corresponds to a solid fraction 0.54–0.57 after the transition. These values are in agreement with the solid-ice volume fractions seen in Figure 6 during the first hour of pancake-ice formation. the overall picture is consistent and pancake salinities compare well with other studies.
To understand how desalination of frazil ice towards pancake salinities proceeds physically, one needs to separate the effects of compaction, wave action and free gravity-driven brine convection. In our experiment, wave action and mixing in combination with a large number of pancakes of different age and transition stage likely smears out most of the small-scale brine convection variability associated with brine channels spaced by a few centimetres (e.g. Reference Weeks and AckleyWeeks and Ackley, 1982). the overall signal in the tank water salinity thus becomes rather homogeneous. However, our derived pancake salinity series indicates (1) a first very strong decay signal and (2) a periodicity of 1–2 hours in the desalination. Tank experiments with alternating wave and quiescent conditions, such as those carried out during RECARO by Reference Wang and ShenWang and Shen (2010), should be accompanied by detailed thermodynamic ice monitoring. Surface temperature fluctuations in the absence of waves as well as direct salt-flux observations below single pancakes could give valuable information about the desalination process.
The critical ranges that we derived may be relevant for proper dynamic modelling of grease/pancake-ice covers, for example as constraints on how ice strength and elasticity (typically related to solid-ice volume fractions) scale critically and may control wave dynamics and dissipation (Reference Shen, Ackley and YuanShen and others, 2004). the recent work by Reference Wang and ShenWang and Shen (2010) also points to the importance of including thermodynamics in dynamic grease–pancake-ice modelling. the predictability of solid-ice volume fractions and pancake growth from heat fluxes (Fig. 6) is one aspect to be studied in more detail. Our experiment finished when pancake solid-ice fractions reached 0.7 and the pancakes were still surrounded by 10–20% frazil area. of particular interest would be a longer experiment monitoring over the course of a few more days the joint effect of pancake-size-limiting waves and ice thermodynamics during freeze-up to a solid-ice cover.
Acknowledgements
This work was completed as part of the NorClim project, funded by the Research Council of Norway, as well as the RECARO project supported by the European Community’s Sixth Framework Programme through the grant to the budget of the Integrated Infrastructure Initiative HYDRALAB III (contract no. 022441, RII3). We thank the Hamburg Ship Model Basin (HSVA, www.hsva.de), especially the ice tank crew, for the hospitality, technical and scientific support and the professional execution of the test programme in the Research Infrastructure ARCTECLAB. J. Wilkinson from the Scottish Association for Marine Science organized this multidisciplinary project. We thank P. Haugan, L.H. Smedsrud, R. Wang and H. Shen for valuable discussions. We also thank P. Langhorne (scientific editor), M. Doble (reviewer) and an anonymous reviewer for their efforts.



