




No CrossRef data available.
Punishment and Democracy: Disenfranchisement of Nonincarcerated Felons in the United States
Published online by Cambridge University Press: 01 September 2004
Abstract
As levels of criminal punishment have risen in the United States, more and more citizens have been disenfranchised because of a felony conviction. This paper provides an overview and analysis of the unique practice of felon disenfranchisement in the United States today. We focus in particular on the political impact of disenfranchising large numbers of nonincarcerated felons—those who have served their entire sentences and those living in their home communities while completing a term of probation or parole. Our discussion is organized around three key issues relating to felon disenfranchisement: (1) the historical and legal origins of this practice; (2) its practical political impact on recent elections; and, (3) the racial dynamics that color both the history and contemporary effects of felon disenfranchisement in the United States. We discuss how felon disenfranchisement laws in many states appear to be out of step with both international practices and public opinion in the United States and consider contemporary policy proposals.Jeff Manza is the coauthor, with Clem Brooks, of Social Cleavages and Political Change: Voter Alignments and U.S. Party Coalitions. With Jeff Manza, Christopher Uggen is coauthor of the forthcoming Locked Out: Felon Disenfranchisement and American Democracy. Research was supported by grants from the National Science Foundation (No. 9819015) and from the Individual Project Fellowship Program of the Open Society Institute. The authors are indebted to the editors and anonymous reviewers for thoughtful comments and suggestions and to Angela Behrens and Sara Wakefield for research assistance.
Information
- Type
- SYMPOSIUM
- Information
- Copyright
- © 2004 American Political Science Association
No discussion of the current state of democracy in the United States can ignore the unique and growing impact of the disenfranchisement of felons and ex-felons.1
Felony is a generic term used to distinguish more serious crimes from lesser crimes, known as misdemeanors. Statutes typically define felonies as those offenses punishable by one year or more of incarceration in a penitentiary. In practice, however, many states count minor as well as the most serious offenses as felonies.
The appropriate citizenship status of criminal offenders in the polity has long been the subject of political, philosophical, and legal debate, considered by philosophers as diverse as Aristotle, John Locke, Jean-Jacques Rousseau, Charles Louis de Secondat Montesquieu, Immanuel Kant, and John Stuart Mill. In spite of their differences, they all converge on the position that offenders are not entitled to full participation in political life.4
See Plannic 1987 and Pettus 2002 for overviews of classical philosophical debates.
See, for example, remarks of Sen. George Allen (R-VA) in Congressional Record 2002. For further discussion, see the outstanding contribution of Ewald 2002a, who distinguishes liberal, Republican, and race-based defenses of felon disenfranchisement.
In addition to these long-standing political and philosophical questions about citizenship, disenfranchisement can also be viewed from the perspective of individual felons in their communities. The loss of voting rights is one of many “collateral consequences” of a felony conviction.9
Since the right to vote is an especially powerful symbol of inclusion, its denial may carry a particular sting to felons who must uphold other responsibilities of citizenship. Political theorists have widely asserted the importance of the right to vote as a certificate of social standing and as the basis for dignity and self-confidence.10For example, Rawls 1971; Shklar 1991.
Felon disenfranchisement also has significant implications for contemporary democratic and legal theory. Although democratic theorists have only recently begun to pay attention to the issue,12
Thompson 2002; Shapiro 2002; but cf. Ewald 2002a; Pettus 2002.
Finally, the racial dimension of felon disenfranchisement provides a central frame around which much of the scholarly and political controversy has been organized.16
Although felon disenfranchisement laws are facially race-neutral, historical antecedents and contemporary disparities have created the widespread perception that race underlies the practice. The major period of the expansion of these laws occurred after the Civil War, in the context of the implementation of the 14th and 15th Amendments. Many of the state laws adopted during this time appeared to target crimes for which African Americans were especially likely to be convicted. In the South, in particular, felon voting bans must clearly be situated alongside other moves to disenfranchise black voters.17 The very high proportion of disenfranchised African Americans today potentially provides a red thread back to the origins of the state laws, while also serving as a painful reminder of the incomplete civil rights revolution and lingering race-based political inequalities.18In this paper we address each topic (citizenship, democracy, and race) that lies at the center of political and scholarly controversies about felon disenfranchisement. We begin by examining the historical and legal origins of felon disenfranchisement in the United States, tracing the laws from their roots in premodern societies through their growing adoption or extension in the nineteenth and twentieth centuries, and the accompanying legal controversies over disenfranchisement. We then consider the contemporary impact of disenfranchisement on voting rights and recent elections. Finally, we turn to the recent policy debate, discussing public opinion, international practices, and the impact of disenfranchisement on offender reintegration.
Felon Disenfranchisement in the United States
Since the United States became a nation, states have punished malefactors by restricting the fundamental rights of citizenship, including rights of political participation. In light of their contemporary impact, it is important to ask how these laws came into existence.
Historical origins of felon disenfranchisement
Criminal disenfranchisement has an extensive history in Greece and Rome, as well as in medieval Europe and the English law of attainder.19
In ancient Greece, for example, imposition of the status of atimia (literally outlawry associated with the loss of rights either temporarily or permanently) upon criminal offenders carried with it the loss of many citizenship rights. The penalties for the ancient Roman punishment of infamia (a condition of disgrace or condemnation for those pronounced infamous by the courts)20 included the loss of suffrage and the right to serve in the Roman legions (a desired opportunity). In medieval Europe, the legal doctrine of “civil death” not only resulted in a complete loss of citizenship rights, but also it left offenders, in extreme cases, exposed to injury or death, since they could be killed by anyone with impunity.21 English law continued this tradition of disenfranchisement with the penalty of attainder, which in extreme applications led to the loss of all civil rights.The permanent removal of civil and political rights for criminal offenders practiced in premodern polities has been almost universally abandoned in the modern world. In the United States, however, the development of the right to vote followed a different path than in other democratic countries.22
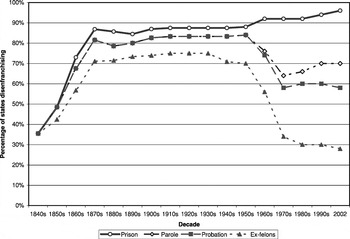
Nonpropertied white men generally gained the franchise earlier in the United States, although for other segments of the population the right to vote came much later in the nation's history and only after protracted struggles.23 Most state constitutions explicitly gave their legislatures the power to pass laws disenfranchising criminals. Yet, prior to the adoption of white male suffrage and the development of state criminal justice institutions, these laws were rare, and generally limited to a few specific common law offenses.24 In 1840 only 4 of the then 26 states had felon disenfranchisement statutes.25 From the 1840s onward, however, states began adopting and expanding their restrictions on felons and ex-felons, broadening the scope of crimes covered and the proportion of offenders involved.26Figure 1 charts the development of state laws since 1840. It shows the percentage of states with various types of disenfranchisement laws (distinguishing states with no ban, states disenfranchising inmates, states disenfranchising inmates plus parolees and/or probationers, and states disenfranchising ex-felons).

Changes in state disenfranchisement law by class of felons disenfranchised
The figure illustrates two noticeable waves of disenfranchisement laws in the nineteenth century. The first, beginning in the 1840s, followed the decline of property (and other) restrictions on white male suffrage. Although at least one scholar has suggested a clear link between the two,27
Elliott 1974.
The second wave occurred after the Civil War. In the South, both during and after Reconstruction, many states expanded their restrictions on the felon population (which for the first time began to contain large proportions of African Americans), the first step in a larger process of disenfranchising African American voters. These measures included the extension of disenfranchisement to cover a wide range of crimes not previously included among the common-law felonies.29
The extensions appeared directly targeted at crimes for which African Americans were primarily charged (this was especially true for all crimes of “moral turpitude” in the post–Civil War South).30 In the North, the controversial enfranchisement of African Americans following the adoption of the 15th Amendment may have encouraged a similar if less blatant race-based pattern.31In fact, our event-history analysis of the factors predicting the adoption of restrictive felon disenfranchisement measures by state governments between 1850 and 2002 finds that states with larger proportions of nonwhites in their prison populations were more likely to pass restrictive laws, even after statistically controlling for the effects of time, region, economic competition between whites and blacks, partisan control of government, and punitiveness.32
Ibid.
The twentieth century featured a third wave of change in disenfranchisement laws. As illustrated in figure 1, the proportion of states disenfranchising ex-felons declined sharply after the late 1950s. Throughout the twentieth century an increasing number of states disenfranchised some categories of felons and many states revised their laws to cover a wider range of crimes. Nevertheless, there was little systematic patterning of these changes during the century until the liberalization wave of the 1960s and 1970s, when 17 states repealed ballot restrictions for ex-felons.34
The period of liberalization began during the height of the civil rights movement. The increasing importance of black voters (outside the South), and possibly black legislators as well, appears to have promoted the adoption of more liberal voting regimes for criminal offenders; in contrast, though, the proportion of African American prisoners reduced the likelihood that a state would liberalize, as in the South.35Legal aspects of felon disenfranchisement
Unlike the constitutions of virtually all other democratic countries, the U.S. Constitution does not provide for a universal right to vote for all citizens. Since the Civil War, the federal government has adopted a series of amendments that require states to extend voting rights to various categories of citizens who had previously been denied (in some or all states) the franchise.36
The 14th Amendment defined national citizenship; the 15th Amendment extended the right to vote to African American men; the 19th Amendment provided for women's suffrage; the 23rd Amendment provided federal voting rights for residents of the District of Columbia; the 24th Amendment prohibited poll taxes; and the 26th Amendment extended the vote to 18-year-olds.
The 14th Amendment, in fact, features a relatively obscure passage that serves as a legal basis for felon disenfranchisement. Buried alongside the famed Equal Protection and Due Process clauses of Section 1 of that Amendment, Section 2 provided for the reduction of a state's representation in the House of Representatives in the proportion to which the state denied adult men the right to vote. However, Congress added the qualification that the provision did not apply for the exclusion of those convicted of “rebellion or other crimes.” Most legal scholars have rejected a narrow or literal reading of this passage when applied to the broader issues raised by ex-felon voting rights as they evolved after 1868, both because of the likely intent of Congress to link “other crimes” to war-related offenses37
and because of the vast expansion of the criminal justice system after 1868.38 Yet with very few exceptions, federal courts have allowed even the strictest of these bans—those on ex-felons who have finished their entire sentences—to remain in place. This has continued even in the post–Voting Rights Act era and in the face of strong evidence that these bans have a disproportionate racial impact. The controlling case, Richardson v. Ramirez,39 with a majority decision written by then Associate Supreme Court Justice William Rehnquist, upheld the constitutionality of felon disenfranchisement laws as consistent with the intent of the 14th Amendment.Recent legal challenges have not, to date, overturned that decision. Although the Court did strike down Alabama's broad disenfranchisement law in 1985—the Court found that the state's law was substantially motivated by racist intent in violation of Section 1 of the 14th Amendment40
—it only required the state to rework its law, not to eliminate its ex-felon restrictions altogether.Felon Disenfranchisement Today
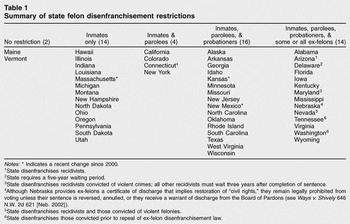
Reflecting an absence of national standards, there is wide variation in state laws regarding voting rights for felons and ex-felons. Four categories of criminal offenders are distinguished by state disenfranchisement laws: (1) convicted felons who are currently incarcerated; (2) felons who have been previously incarcerated and released from prison under parole supervision; (3) felons sentenced to probation rather than prison (and thus never incarcerated); and (4) ex-felons who have completed their entire sentence and no longer have any official contact with the criminal justice system. Only two states, Maine and Vermont, currently allow all felons to vote, including those serving time in prison. At the other extreme, fourteen states bar some or all ex-felons from voting (details are in notes to table 1).
Summary of state felon disenfranchisement restrictions

Table 1 summarizes the types of restrictions in place in each state at the end of 2002. In between the ends of the continuum (states that disenfranchise all ex-felons and those that allow all felons to vote), a variety of intermediate restrictions exist. For instance, 14 states disenfranchise only currently incarcerated felons, allowing felons who were released from prison or who were never sent to prison to vote; 4 disenfranchise both felon inmates and parolees, but allow those sentenced only to probation to vote; and another 16 states add probation to the list of proscribed offenders.
Given the wide variation in state policies regarding felon and ex-felon voting rights, determining the size and distribution of the disenfranchised felon population requires a state-by-state canvass. In other work, we have developed a demographic life-table analysis in order to estimate the overall distribution of disenfranchised felons in each state, taking into account each state's distinctive laws.41
While counts of the incarcerated, parole, and probation populations are fairly straightforward, determining the size of the disenfranchised felon population is far more complicated. Because many ex-offenders will commit further crimes (and receive further criminal justice sanctions), and others die, there is a danger of overcounting or double-counting the ex-felon population unless appropriate adjustments are made for both recidivism and mortality. Incorporating such adjustments, we estimate that approximately 4.7 million disenfranchised felons were prevented from voting during the 2000 presidential election.42Uggen and Manza 2002. Cf. Fellner and Mauer 1998, who estimated the disenfranchised felon population in the late 1990s at 3.9 million. Noncitizen immigrants, representing a small but unknown percentage of disenfranchised ex-felons in the United States, are generally unable to vote regardless of their felony conviction status. Because detailed data on noncitizens in the state criminal justice system are unavailable, we can only crudely estimate the size of this population. Applying figures based on an Urban Institute report on illegal aliens in the criminal justice system (Clark and Anderson 2000) and a U.S. Department of Justice report on Noncitizens in the Federal Criminal Justice System (1996a), we estimate that noncitizens could comprise approximately 3–5 percent of the ex-felon population.
Our estimates are likely to be conservative. But is there any chance they are too high? For example, it is possible that some felons are slipping through the cracks, improperly registering and voting because of poor bookkeeping practices in state voter registration systems. In fact, follow-up canvasses of a few hotly contested elections with recounts—including the Florida recounts of the 2000 presidential election—reveal evidence of such activity.44
Arthur, Dougherty, and Yardley 2002; Kidwell, Long, and Dougherty 2000; McBride and Spice 2000; Freedberg 1998. In the most detailed investigation available, the Florida 2000 case, alongside the handful of ex-felons improperly registered to vote were other nonfelons improperly purged from the voting rolls. Stuart 2002 develops a scholarly assessment of the consequences of Florida's attempts to purge felon voters from the rolls; a popular account documenting excessive purging may be found in Palast 2001.
But even if relatively large numbers of formally disenfranchised felons are voting, there are still good reasons to believe that, overall, we have significantly understated the full extent of the disenfranchised population. For instance, our estimate of 4.7 million disenfranchised felons does not include unconvicted felons whose entanglement in the criminal justice system makes it difficult or impossible to vote. These include the 275,500 jail inmates serving sentences for misdemeanor offenses and the approximately 321,000 unconvicted pretrial detainees who were in jail on the day of recent national elections.45
Both of these groups are practically, if not legally, disenfranchised in most states.Further, while some felons may be improperly voting, an even greater number of eligible ex-felons may be avoiding the polls due to the mistaken belief that they are subject to permanent disenfranchisement. In Minnesota, for example, our in-depth interviews with current felons (both in and out of prison) revealed that many were unaware that their right to vote would be restored after they complete their sentences.46
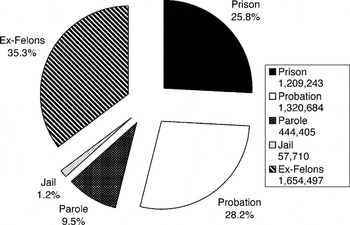
Thus, many former offenders who are actually eligible to vote may be inadvertently taking themselves out of the political process because they misunderstand the details of the laws governing voting rights in their state. Taking these points into account, it is likely that the de facto disenfranchised population is larger than our estimates assert and that our estimates understate the full impact.And who are the disenfranchised? Figure 2 provides a graphical display of the results of our analysis of the composition of the country's disenfranchised felon population. The figure is startling: only about one-quarter of the disenfranchised felon population is currently in prison. Because of the steady cumulation of their numbers over time (in those states that disenfranchise for life), more than one-third of the disenfranchised are ex-felons. The rest are either on probation (28 percent), on parole (10 percent), or serving felony sentences in jails (one percent).

Estimated distribution of legally disenfranchised felons in the United States 2000 (Manza and Uggen 2002)
Does the Disenfranchisement of Nonincarcerated Felons Matter for American Politics?
In view of the exceptional nature of the disenfranchisement regime, it is important to ask whether the disenfranchisement of nonincarcerated felons (as opposed to all felons) has any practical impact on American electoral politics. The nature of our question—how many of these felons would have voted if they had been allowed to?—is by definition counterfactual since they cannot currently participate.
We are hampered by the near-total lack of existing survey data that includes both information about criminal history and political behavior. Our solution to this problem is to “match,” as closely as we can, the characteristics of the felon and ex-felon population to the rest of the electorate using existing representative national election survey data. This procedure identifies two groups of otherwise similar individuals (“similar” on the social characteristics for which we have information about the felon population): one group is able to vote, the other is not. Historical changes in punishment are relevant for thinking of this as a kind of natural experiment. For example, far more individuals today are receiving felony convictions than in the period before 1972. If the punishment practices of that earlier era existed today, many of those currently disenfranchised would be able to vote. Thus, many disenfranchised felons have received a “treatment” that puts them in a different category than identically situated individuals in, say, 1970.
This matching exercise draws on data about the social characteristics of convicted felons available from the periodic Survey of State Prison Inmates data series, first carried out in 1974 and every five years or so thereafter.47
See, for example, U.S. Department of Justice 1993; U.S. Department of Justice 2003b.
We can use information about the felon population to develop estimates about what proportion of felons might have voted in recent elections if they had been eligible. We would predict that using sociodemographic information should both depress and inflate the impact of felon disenfranchisement. On one hand, we expect that felons would be far less likely to vote than the rest of the general public; on the other, we also expect (given low education levels, the high proportion of African Americans, and low mean incomes) relatively high levels of Democratic partisanship.
We used two datasets for this analysis: for turnout, we used data from the Current Population Survey's (CPS) Voter Supplement module; for voting behavior, the National Election Study (NES).48
See Uggen and Manza 2002 for further details.
Estimating turnout and voting behavior among “lost” felon voters
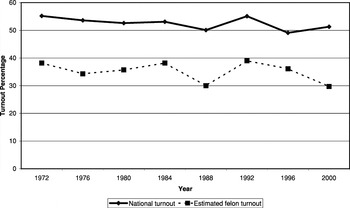
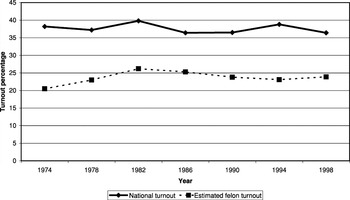
Figures 3a and 3b graph the results of a series of regression analyses predicting turnout rates among disenfranchised felons, if they had been allowed to vote, in presidential elections between 1972 and 2000 (3a), and the same trends for mid-term Congressional elections between 1974 and 2000 (3b).49
Ibid.

Overall turnout rates and estimated turnout among disenfranchised felons, presidential elections 1972–2000

Overall turnout rates and estimated turnout among disenfranchised felons, midterm elections 1974–1998
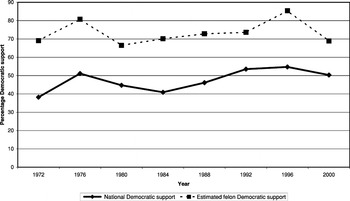
Figure 4 shows our estimates of the voting preferences—in U.S. presidential elections, although the patterns for U.S. Senate elections are generally similar50
Ibid.

Democratic preference overall versus felons, major party voters in presidential elections, 1972–2000
By removing those with Democratic preferences from the pool of eligible voters, then, we can conclude that felon disenfranchisement has provided a small but clear advantage to Republican candidates in every presidential and senatorial election from 1972 to 2000.
Electoral impact?
In our previous investigation, we asked the counterfactual question of whether, given estimated levels of political participation and Democratic partisanship among all disenfranchised felons, their votes could have altered the outcomes of recent elections.51
Ibid.
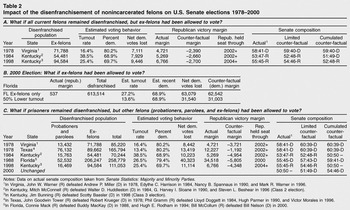
Focusing first on the impact of the most controversial type of restriction, that of ex-felons, we find evidence that a handful of close elections would have had different results if ex-felons had been allowed to vote (the top and middle tier of table 2 identifies these elections). Three Senate elections are likely to have been reversed if ex-felons had been allowed the ballot: Virginia in 1978 (John Warner [R] over Andrew Miller [D]), Kentucky in 1984 (Mitch McConnell [R] over Walter Huddleston [D]), and Kentucky again in 1998 (Jim Bunning [R] over Scotty Baesler [D]). In establishing these estimated results, we applied felon voting behavior estimates (as described earlier)52
Ibid.
Impact of the disenfranchisement of nonincarcerated felons on U.S. Senate elections 1978–2000

In the middle panel of table 2, we note that because Florida is a state that disenfranchises all ex-felons, it is certain that ex-felon votes would have helped Al Gore carry the state and thus the election in 2000. At that time, Florida had approximately 614,000 ex-felons. Had they been allowed to vote, we estimate that some 27.2 percent would have turned out, and that 68.9 percent would have chosen the Democrat, Gore. This would have resulted in a net Democratic gain of 63,079 votes, and a final Gore victory margin of 62,542. Even if we assume that turnout rates among the disenfranchised ex-felons were only half that of the rate projected by our estimates, Gore still would have carried Florida by more than 31,000 votes, a margin large enough to have insured victory even if all other disputed votes thought to favor the Republicans—such as those by overseas military personnel—had been counted.
What if voting rights were restored to all nonincarcerated felons, in keeping with the practice followed practically everywhere else in the world? Not surprisingly, the inclusion of these voters produces additional electoral impacts. The bottom panel in table 2 shows that as many as five Senate elections might have been reversed if probationers and parolees were added to the rolls. The two additional elections potentially reversed are in Texas in 1978, where Tower (R) defeated Krueger (D); and in Florida in 1988, where Mack (R) defeated MacKay (D).
Caveats
Such an analysis is subject to qualifications, and we urge appropriate caution in interpreting our results. Predicting participation and vote choice from a limited amount of information about the sociodemographic attributes of offenders is a fairly crude exercise, but we simply do not have any other information available about the partisan identities, political trust, knowledge or interest, or social networks of disenfranchised felons. Further, a number of unmeasured individual-level factors (such as the strength of citizenship norms or degree of social isolation among offenders) could either depress turnout or reduce Democratic partisanship in ways that we cannot measure. However, a follow-up investigation using the only available data with information about both the criminal history and political behavior of survey respondents (the Youth Development Study, a longitudinal study following a group of public high school students in St. Paul, Minnesota) found that once the same sociodemographic factors used in our investigation are controlled, the difference in turnout between offenders and nonoffenders was reduced to nonsignificance.53
Ibid.
Another potential objection is that our analysis makes the ceteris paribus assumption that electoral contests would be unaffected by the participation of some or all disenfranchised felons, that nothing else about the candidates or elections would have changed. The implications of this assumption for the distribution of votes are likely more substantial than for turnout, although the parties could also change their strategies for mobilizing voters as well. Whether and how the vote-getting strategies of electoral campaigns of any particular election would change is simply impossible to know. We do, however, believe it is likely that the effects on campaign strategies would be minor at best. Since there are a relatively small number of disenfranchised felon voters (even in the unlikely scenario in which all had been enfranchised), it seems highly implausible that either major party would alter otherwise viable campaign strategies—especially in this era of poll-driven “crafted talk”54
and sophisticated campaign management—because of the addition of a small group of previously excluded voters.Finally, it is important to restate an earlier point: because of the lack of systematic information about the precise neighborhoods and legislative districts where disenfranchised felons originate, we cannot easily estimate the political impact of disenfranchisement below the state level. While many urban districts are one-sidedly Democratic, and thus mute the potential impact, it is nonetheless certain that there is a considerable effect on local, state legislative, and House elections. If the appropriate data could be generated, a systematic canvass of such elections would add considerably to our understanding of the full electoral impact of felon disenfranchisement. Certainly given the heavy concentration of felony convictions in urban areas,55
we would expect that focusing on state-level or presidential elections understates the full electoral impact of felon disenfranchisement.Contemporary Policy Debates
The rapid growth in the size of the population disenfranchised by virtue of a felony conviction has not gone unnoticed. Because of the vast racial disparities in rates of felony convictions, African American men have suffered the greatest loss of voting rights, with one out of six currently disenfranchised due to a current or past felony conviction. In the face of a mounting civil rights campaign to restore voting rights for nonincarcerated felons,56
several states have recently amended their laws to expand felon voting rights. For example, in 2001 Connecticut and New Mexico both liberalized their felon disenfranchisement laws, with Connecticut allowing probationers to vote and New Mexico agreeing to restore voting rights to felons upon completion of their sentences. That same year, Nevada eliminated its five-year post-sentence waiting period to apply for the restoration of voting rights, although the restoration process for ex-felons is still not automatic. And in 2002 Maryland passed legislation to automatically restore voting rights upon completion of sentence for first-time offenders (and three years after completion for nonviolent recidivists). At the national level, a measure banning the states from placing any restrictions on the voting rights of ex-felons reached the floor of the Senate in February 2002, although it was defeated 63–31.57A number of states have also moved to adopt more conservative restrictions in recent years. Since 1997, Utah and Massachusetts have disenfranchised inmates, and Colorado and Oregon disenfranchised federal inmates (Colorado disenfranchised federal parolees as well). Overall, a very mixed picture of policy change at the state level emerges. Since 1975, 13 states have liberalized their laws, 11 states have passed further limitations on felons, and three states have passed both types of laws.58
In relation to this emerging policy debate, three pieces of empirical evidence are especially important: the public's opinion on disenfranchisement laws; the manner in which U.S. laws regarding voting rights for criminal offenders compare with those in other democratic countries; and the implications of disenfranchisement laws for the civic reintegration of offenders.
Public opinion
As state and national debates unfold, what do we know about public opinion in this area? The issue of disenfranchisement of felons and ex-felons intersects with two broad trends in public opinion since the 1950s: strong and growing support for civil liberties and civil rights for all citizens; and strong support for anticrime policies, including the harsh treatment of criminal offenders. In other words, public fear of crime and a desire to punish criminal offenders in ways that will reduce their propensity to commit crimes again in the future59
Roberts and Stalans 2000.
Over the last three years, two national surveys have examined the public's opinion on the disenfranchisement issue, and they provide some valuable hints about how respondents weigh these competing objectives. Brian Pinaire and Milton Heumann61
report results of a national telephone survey of 502 Americans, with a single item measuring a gradient of support for felon disenfranchisement. In this 2001 survey, about 10 percent of respondents stated that felons should never lose their right to vote; 32 percent favored suspending voting rights while felons are incarcerated (but not while on probation or parole); 35 percent supported disenfranchisement for prisoners, probationers, and parolees; 5 percent preferred disenfranchisement for parolees and probationers only; and 16 percent favored permanent restrictions on ex-felons as well as current felons (2 percent did not report a preference). Therefore, the Pinaire and Heumann study suggests that while a majority of citizens favor some restrictions on the voting rights of current prison inmates, an even stronger majority rejects the idea of disenfranchising former offenders who have completed their sentences.Our own national survey, employing a variety of question-wording experiments designed to tap different aspects of public attitudes on the issue, was undertaken in the summer of 2002. As part of its July monthly omnibus telephone survey, Harris Interactive asked 1,000 Americans a range of questions relating to the civil liberties and rights of criminal offenders, including voting rights.62
See Manza, Brooks, and Uggen, forthcoming, for full details about this survey.
One-quarter of the sample was asked about each group, although the ex-felon item was asked as part of a different question-wording experiment that followed immediately after the question asking split samples of respondents about voting rights for felon probationers, parolees, and inmates. The exact question wording for the ex-felon item was: “Now how about people convicted of a crime who have served their entire sentence, and are now living in the community. Do you think they should have the right to vote?” For this reason, the ex-felon result is not strictly comparable.
There has been some discussion recently about the right to vote in this country. Some feel that people convicted of a crime who are sentenced to probation, but not prison, and are living in the community should have the right to vote. Others feel that they should not have the right to vote. What about you? Do you think people on probation should have the right to vote?
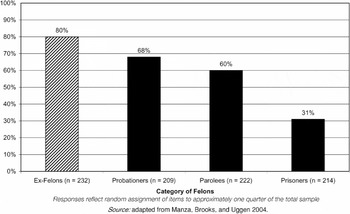
Respondent majorities of 80 percent, 68 percent, and 60 percent favored the idea of restoring voting rights to ex-felons, probationers, and parolees, respectively (see figure 5).Yet fewer than a third of those survey respondents asked about restoring voting rights for current inmates supported that possibility. It is clear from this experiment, as well as from the Pinaire and Heumann study,64
that public support for felon voting rights does not extend to those in prison.
Percentage supporting enfranchisement of ex-felons, probationers, parolees, and prisoners, 2002
U.S. voting laws in comparative perspective
Surveying international practice underscores the exceptional character of the restrictions on the political rights of criminal offenders in the United States. These can be seen in two ways. First, it has the highest incarceration and conviction rates in the world, with incarceration rates six to ten times those of the countries that are most similar to us. For example, the 2000 incarceration rate in the United States was 686 per 100,000, compared to rates of 105 in Canada, 95 in Germany, and only 45 in Japan.65
Similar cross-national disparities can also be found for other correctional populations.66For comparative probation and parole data, see United Nations 2003.
Current levels of incarceration and criminal conviction are unprecedented not only comparatively, but also historically within the United States. Incarceration and conviction rates remained relatively stable, with some essentially trendless fluctuation, between the 1920s and early 1970s. Since then, however, those rates have exploded. There were fewer than 200,000 prison inmates in 1972; today, there are over 1.4 million.67
With the addition of jail inmates, there are now slightly over 2 million people incarcerated in the United States.68Ibid.
Yet the full impact of the criminal punishment boom is tempered by some important limitations. Most convicted felons, for instance, eventually get their voting rights restored. In fact, we have estimated (with life-table demographic models adjusting for recidivism and mortality, the same approach used to estimate the disenfranchised ex-felon population) that there are now approximately 13.3 million Americans who have a felony conviction on their record (about 6.5 percent of the adult population).70
Uggen, Thompson, and Manza 2000.
The second source of American exceptionalism in regard to offender voting rights lies in the laws themselves.73
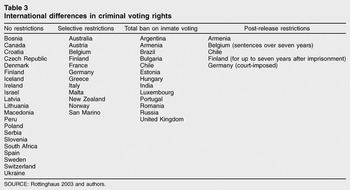
Table 3 summarizes cross-national differences in criminal voting rights, based on the comprehensive survey developed by Brandon Rottinghaus.74 As the table shows, many countries allow all criminal offenders to vote—including those currently incarcerated. Seventeen European democracies have no electoral ban on incarcerated prisoners. Israel, Peru, Canada, and South Africa also allow current inmates to vote (col. 1). Nine European nations, as well as Australia and New Zealand, disenfranchise only a portion of current inmates (col. 2; in these countries, restrictions on prisoner voting are typically based on either the length of the sentence, the nature of the crime committed, or the type of election). Thirteen countries bar all current prisoners from voting, but only a handful provide for restrictions on post-release offenders.International differences in criminal voting rights

The key point to draw from this comparative survey is that the United States is the only country in the democratic world that systematically disenfranchises large numbers of nonincarcerated felons (i.e., those out on probation or parole) and ex-felons.75
Although there are a few exceptions to this generalization, none involve the same proportion of offenders. In Germany, courts have the power to withdraw voting rights for up to five years after the completion of a prison sentence as an additional punishment, although the actual use of such a sanction is very rare (Nora Demleitner notes that in one recent year for which she had data, it was only applied in 11 cases76). French courts can also impose restrictions on political rights that extend beyond the prison sentence, but these are part of the original punishment (and hence do not apply to ex-felons). Finland and New Zealand disenfranchise some ex-felons for political offenses,77 while in Belgium, convicted offenders with long sentences can be disenfranchised for life. But the existence of ex-felon voting bans that affect millions of nonincarcerated citizens, such as those found in the United States today, is unparalleled. In fact, the closest parallels are to various premodern political regimes mentioned earlier, in which criminal offenders were precluded, once marked by legal conviction, from reentering the polity for life.78Felon disenfranchisement and civic reintegration
The policy contests over felon disenfranchisement raise important and increasingly pressing criminal justice questions that, although ordinarily ignored, should be considered in this debate. A record 630,000 people were released from prison in 2002, and prisoner reentry has emerged as a central concern for research and policy on crime.79
It is perhaps not surprising that, faced with significant disadvantages in the labor market80 and a variety of restrictions on their ability to obtain housing, receive government benefits, and enjoy other civil rights,81 almost two-thirds of released prisoners are rearrested within three years.82 Research on the factors promoting desistance from crime has shown it to be closely linked to a successful transition to work,83 family,84 and community85 roles. In a recent review of research on transitions from prison, Christy A. Visher and Jeremy Travis suggest a plausible connection between voting rights and successful reintegration, identifying factors such as joining a community organization and becoming politically active as potential milestones in the reintegration process.86 Denying voting rights to ex-felons, or to felons living in their communities on probation and parole, undermines their capacity to connect with the political system and may thereby increase their risk of recidivism.Conclusion
The case of felon disenfranchisement is a powerful reminder that even the most basic elements of democratic governance, such as a universal right to vote, can still be threatened in a polity otherwise asserting its democratic credentials. It exemplifies how “waves of democracy”87
Markoff 1996.
The variety of empirical evidence presented here provides a distinctive view of the disenfranchisement issue. Three points stand out in relation to the broader questions of democracy, citizenship, and race that we posed at the outset. First, our empirical investigation of the origins of felon disenfranchisement laws, as well as their significant impact on the African American community, suggests both a causal role for race and an important set of race-related impacts. Second, the evidence we have presented about the extent of the loss of voting rights, contemporary electoral impact, and strong public support for the restoration of voting rights for nonincarcerated felons raises vital issues for the American practice of democracy today. Finally, we have outlined evidence that the right to vote can be meaningfully connected to the civic reintegration of individual offenders, and have identified a sharp distinction in the citizenship status accorded nonincarcerated offenders in the United States relative to those in the rest of the democratic world. Taken as a whole, this evidence suggests a strong case for rethinking the current practice of disenfranchisement.
References
REFERENCES
Afroyim v. Rusk.
387 U.S. 253
(1967).
Arthur, Lisa,
Geoff Dougherty, and
William Yardley.
2002.
452 felons cast votes illegally in Broward.
Miami Herald, January 23. http://www.miami.com/mld/miamiherald/.Google Scholar
Behrens, Angela,
Christopher Uggen, and
Jeff Manza.
2003.
Ballot manipulation and the “menace of negro
domination”: Racial threat and felon disenfranchisement in the
United States, 1850–2000.
American Journal of Sociology
109 (3):
559–605.Google Scholar
Brooks, Clem.
2000.
Civil rights liberalism and the suppression of a Republican
political realignment in the U.S., 1972–1996.
American Sociological Review
65 (4):
482–505.Google Scholar
Brown-Dean, Khalilah.
2003.
The impact of elite framing on public attitudes toward felon
disenfranchisement laws.
Paper presented at the Annual Meeting of the American Political
Science Association, Philadelphia.
Clark, Rebecca L., and
Scott A. Anderson.
2000.
Illegal aliens in federal, state, and local criminal justice
systems.
Washington, DC:
Urban Institute Press.
Clear, Todd R.,
Dina R. Rose,
Elin Waring, and
Kristen Scully.
2003.
Coercive mobility and crime: A preliminary examination of
concentrated incarceration and social disorganization.
Justice Quarterly
20(1):
33–64.Google Scholar
Congressional Record.
2002.
107th Cong., 2nd sess. Vol. 148, S. 3565, Debate on Equal Protection
of Voting Rights Act of 2001,
S797–S809.
Coyle, Michael.
2003.
State-based advocacy on felony disenfranchisement.
Washington, DC:
The Sentencing Project.
Demleitner, Nora.
2000.
Continuing payment on one's debt to society: The German model
of felon disenfranchisement as an alternative.
Minnesota Law Review
84 (4):
753–804.Google Scholar
Ewald, Alec C.
2002a.
The ideological paradox of criminal disenfranchisement law in the
United States.
University of Wisconsin Law Review
2002 (5):
1045–1138.Google Scholar
Ewald, Alec C.
2002b.
Of constitutions, politics, and punishment: Criminal disenfranchisement
law in comparative context.
Paper presented at the Annual Meeting of the American Political
Science Association, Boston.
Fellner, Jamie, and
Marc Mauer.
1998.
Losing the vote: The impact of felony disenfranchisement laws in
the United States.
Washington, DC:
Human Rights Watch and The Sentencing Project.
Fletcher, George.
1999.
Disenfranchisement as punishment: Reflections on the racial uses of
Infamia.
UCLA Law Review
46:1895–1908.Google Scholar
Freedberg, Sydney P.
1998.
Special report: Felons vote too—but it's a crime.
Miami Herald, February 15,
sec. A.Google Scholar
Friedman, Lawrence M.
1993.
Crime and punishment in American history.
New York:
Basic Books.
Furman, Jesse.
1996.
Political illiberalism: The paradox of disenfranchisement and the
ambivalences of Rawlsian justice.
Yale Law Journal
106 (4):
1197–1231.Google Scholar
Goodwin-Gill, Guy S.
1994.
Free and fair elections: International law and practice.
Geneva:
Inter-Parliamentary Union.
Harvard Law Review.
1989.
The disenfranchisement of ex-felons: Citizenship, criminality, and
“the purity of the ballot box.”
102 (6):
1300–17.
Harvard Law Review
2002.
One person, no vote: The laws of felon disenfranchisement.
115 (7):
1939–63.
Harvey, Alice.
1994.
Ex-felon disenfranchisement and its influence on the black vote:
The need for a second look.
University of Pennsylvania Law Review
142 (3):
1145–89.Google Scholar
Hench, Virginia E.
1998.
The death of voting rights: The legal disenfranchisement of
minority voters.
Case Western Law Review
48 (4):
727–98.Google Scholar
Hunter v. Underwood.
471 U.S. 222
(1985).
Itkowitz, Howard, and
Lauren Oldak.
1973.
Restoring the ex-offender's right to vote: Background and
developments.
American Criminal Law Review
11 (1):
721–70.Google Scholar
Jacobs, Lawrence R., and
Robert Y. Shapiro.
2000.
Politicians don't pander: Political manipulation and the loss of
democratic responsiveness.
Chicago:
University of Chicago Press.
Keyssar, Alexander.
2000.
The right to vote: The contested history of democracy in the United
States.
New York:
Basic Books.
Kidwell, David,
Phil Long, and
Geoff Dougherty.
2000.
Hundreds of felons cast votes illegally.
Miami Herald, December 1,
National section.Google Scholar
Klinkner, Philip A., and
Rogers M. Smith.
1999.
The unsteady march: The rise and decline of racial equality in
America.
Chicago:
University of Chicago Press.
Kousser, J. Morgan.
1999.
Colorblind injustice: Minority voting rights and the undoing of the
second reconstruction.
Chapel Hill:
University of North Carolina Press.
Laub, John H.,
Daniel S. Nagin, and
Robert J. Sampson.
1998.
Trajectories of change in criminal offending: Good marriages and
the desistance process.
American Sociological Review
63 (2):
225–38.Google Scholar
Levinson, Joe.
2001.
Barred from voting.
London:
Prison Reform Trust.
Mauer, Marc, and
Meda Chesney-Lind.
2002.
Invisible punishment: The collateral consequences of mass
imprisonment.
New York:
New Press.
Manza, Jeff.
2000.
Race and the underdevelopment of the American welfare state.
Theory and Society
30 (6):
819–32.Google Scholar
Manza, Jeff,
Clem Brooks, and
Christopher Uggen.
2004.
Civil death or civil rights? Public attitudes towards felon
disenfranchisement in the United States.
Public Opinion Quarterly
68 (2):276–87.Google Scholar
Manza, Jeff, and
Christopher Uggen.
Forthcoming.
Locked out: Felon disenfranchisement and American democracy.
New York:
Oxford University Press.
Maruna, Shadd
2001.
Making good: How ex-convicts reform and rebuild their lives.
Washington, DC:
American Psychological Association.
McBride, Jessica, and
Linda Spice.
2000.
Felons turn up on city's list of November 7 voters: Spot check
shows at least 2 appear ineligible for ballots.
Milwaukee Journal-Sentinal,
November 29.
McDonald, Michael P., and
Samuel L. Popkin.
2001.
The myth of the vanishing voter.
American Political Science Review
95 (4):
963–74.Google Scholar
Mendelberg, Tali.
2001.
The race card, campaign strategy, implicit messages, and the norm
of equality.
Princeton:
Princeton University Press.
Pager, Devah.
2003.
The mark of a criminal record.
American Journal of Sociology
108 (5):
937–75.Google Scholar
Petersilia, Joan.
2003.
When prisoners come home: Parole and prisoner reentry.
New York:
Oxford University Press.
Pettus, Katherine.
2002.
Felony disenfranchisement in the contemporary United States: An ancient
practice in a modern polity.
PhD diss.,
Columbia University.
Pinaire, Brian, and
Milton Heumann.
2003.
Barred from the vote: Public attitudes toward felon
disenfranchisement of felons.
Fordham Urban Law Journal
30 (5):
1519–50.Google Scholar
Plannic, Zdarvko.
1987.
Should imprisoned criminals have a constitutional right to vote?
Canadian Journal of Law and Society
2 (2):
153–64.Google Scholar
Rajan, Sara.
2003.
A modified version of double jeopardy—Rehabilitated African
American felons barred from the voting box.
Paper presented at the Annual Meeting of the American Political
Science Association, Philadelphia.
Rawls, John.
1971.
A theory of justice.
Cambridge:
Harvard University Press.
Richardson v. Ramirez.
418 U.S. 24
(1974).
Rogers, Donald W., ed.
1992.
Voting and the spirit of American democracy: Essays on the history
of voting and voting rights in America.
Urbana:
University of Illinois Press.
Rothman, David J.
1980.
Conscience and convenience: The asylum and its alternatives in
Progressive America.
Boston:
Little Brown.
Rottinghaus, Brandon.
2003.
Incarceration and enfranchisement: International practices, impact, and
recommendations for reform.
International Foundation for Election Systems.
http://www.ifes.org/research_comm/08_18_03_Manatt_Brandon_Rottinghaus.pdf.
Sampson, Robert J., and
John H. Laub.
1993.
Crime in the making: Pathways and turning points through life.
Cambridge:
Harvard University Press.
Shapiro, Andrew.
1993.
Challenging criminal disenfranchisement under the Voting Rights
Act: A new strategy.
Yale Law Journal
103 (2):
537–66.Google Scholar
Shapiro, Ian.
2002.
The state of democratic theory.
Princeton:
Princeton University Press.
Shklar, Judith.
1991.
American citizenship: The quest for inclusion.
Cambridge:
Harvard University Press.
Smith, Tom W.
1990.
Liberal and conservative trends in the United States since World
War II.
Public Opinion Quarterly
54 (3):
479–507.Google Scholar
Stuart, Guy.
2002.
Databases, felons, and voting: Bias and partisanship of the Florida
felons' list in the 2000 elections.
Unpublished manuscript, Kennedy School of Government, Harvard
University.
Thompson, Dennis F.
2002.
Just elections: Creating a fair electoral process in the United
States.
Chicago:
University of Chicago Press.
Travis, Jeremy,
Amy L. Solomon, and
Michelle M. Waul.
2001.
From prison to home: The dimensions and consequences of prisoner
reentry.
Washington, DC:
Urban Institute Press.
Trop v. Dulles.
356 U.S. 86
(1958).
Uggen, Christopher.
2000.
Work as a turning point in the life course of criminals: A duration
model of age, employment, and recidivism.
American Sociological Review
65 (4):
529–46.Google Scholar
Uggen, Christopher, and
Jeff Manza.
2002.
Democratic contraction? The political consequences of felon
disenfranchisement in the United States.
American Sociological Review
67 (6):
777–803.Google Scholar
Uggen, Christopher, and
Jeff Manza
2004.
Lost voices: The civic and political views of disenfranchised
felons. In
Imprisoning America: The social effects of mass incarceration, ed.
Mary Pattillo,
David Weiman, and
Bruce Western,
165–204.
New York:
Russell Sage Foundation.
United Nations Office on Drugs and Crime, Centre for International
Crime Prevention.
2003.
The seventh United Nations survey on crime trends and the
operations of criminal justice systems (1998–2000).
http://www.unodc.org/pdf/crime/seventh_survey/7sv.pdf.
U.S. Department of Justice.
1993.
Survey of state prison inmates, 1991.
Washington, DC:
Government Printing Office.
U.S. Department of Justice
1996a.
Noncitizens in the federal criminal justice system.
Washington, DC:
Government Printing Office.
U.S. Department of Justice, Office of the Pardon Attorney
1996b.
Civil disabilities of convicted felons: A state-by-state survey.
Washington, DC:
Government Printing Office.
U.S. Department of Justice
2001.
Census of jails, 1999.
Washington, DC:
Government Printing Office.
U.S. Department of Justice
2002.
Probation and parole in the United States, 2001.
Washington, DC:
Government Printing Office.
U.S. Department of Justice
2003a.
Sourcebook of criminal justice statistics.
Washington, DC:
Government Printing Office.
U.S. Department of Justice
2003b.
Prison and Jail Inmates at Midyear 2002.
Washington, DC:
Government Printing Office.
Visher, Christy A., and
Jeremy Travis.
2003.
Transitions from prison to community: Understanding individual
pathways.
Annual Review of Sociology
29:
89–113.Google Scholar
Walker, Samuel.
1980.
Popular justice: A history of American criminal justice.
New York:
Oxford University Press.
Walmsley, Roy.
2002.
World prison population list. 3rd ed. Research Findings 116.
London:
Home Office Research, Development and Statistics Directorate.
http://www.homeoffice.gov.uk/rds/pdfs/r166.pdf.
Ways v. Shively.
264 Neb. 250
(2002).
Wiebe, Robert H.
1995.
Self-rule: A cultural history of American democracy.
Chicago:
University of Chicago Press.
Changes in state disenfranchisement law by class of felons disenfranchised
Summary of state felon disenfranchisement restrictions
Estimated distribution of legally disenfranchised felons in the United States 2000 (Manza and Uggen 2002)
Overall turnout rates and estimated turnout among disenfranchised felons, presidential elections 1972–2000
Overall turnout rates and estimated turnout among disenfranchised felons, midterm elections 1974–1998
Democratic preference overall versus felons, major party voters in presidential elections, 1972–2000
Impact of the disenfranchisement of nonincarcerated felons on U.S. Senate elections 1978–2000
Percentage supporting enfranchisement of ex-felons, probationers, parolees, and prisoners, 2002
International differences in criminal voting rights
 You have
Access
- 62
- Cited by