Implications
Both Wood (WD) and Dijkstra (DIJ) functions described the lactation data of dairy cattle well. However, adoption of the DIJ function, which was slightly superior to WD function, would imply a more stringed recording regime. This may not be feasible within the recording systems in Sub-Saharan Africa in the short run. The WD function would therefore be the function of choice in recording systems where recording is not consistent. The ability of the functions to describe the lactation curves of the cows provides an opportunity through interpolation and extrapolation, to include animals with missing records and incomplete lactations in evaluations. There were differences in the lactation curves between breeds of animals; therefore, in herd management and animal evaluation the differences in lactation curve shapes should be accounted for, if more plausible results are desired. The study has shown the ability to reduce the number of test day records per lactation without compromising the accuracy of the parameter estimates. Consequently, adopting a reduced frequency-sampling regime would save the producer the additional costs of recording.
Introduction
Recording of dairy cattle pedigree and performance in Kenya is important at both farm and national levels. At the farm level, pedigree and performance recording are important for monitoring individual animal productivity, which is critical in general management and farm profitability, checking inbreeding and selection of replacement stock. At the national level, records are important for selection of dams that join the national contract mating scheme for semen production and progeny testing.
Dairy cattle production in Kenya, like other countries in Sub-Saharan Africa, is dominated by low-to-medium input production systems. Pedigree and performance recording within these systems are inconsistent (Food and Agricultural Organization (FAO), 1998). The inconsistency is in form of missing pedigree information and missing test day (TD) milk yield records in incomplete lactations. These inconsistencies pose a great challenge to animal performance evaluation as they affect the availability and quality of data.
It is recommended that evaluation of milk production performance in dairy systems is carried out on animals that recorded 305 days of milk production (Jorjani et al., Reference Jorjani, Philipsson and Mocquot2001). In Kenya, only a small proportion of the dairy cow data under evaluation are complete, thus satisfying the edit criteria that would produce acceptable results. Therefore, data editing criteria set during evaluations to reduce the adverse effects of outliers, to enhance homogeneity of the dataset and to improve the accuracy of estimates result in considerable elimination of candidate animals. This leads to a reduction in the size of data and loss of information, which consequently minimise the precision of the estimates (Lynch and Walsh, Reference Lynch and Walsh1998; Mrode, Reference Mrode2005).
Mathematical functions to describe the lactation curve of dairy cows and to predict 305-day milk production in dairy cows are available (e.g. Wood, Reference Wood1967; Ali and Schaeffer, Reference Ali and Schaeffer1987; Dijkstra et al., Reference Dijkstra, France, Dhanoa, Maas, Hanigan, Rook and Beever1997; Pollott, Reference Pollott2000). Ostensibly, these functions aim at predicting the yield on each day based on the assumption of the standard lactation curve with minimum error in order to disentangle the continuous components from environmental influences (Olori et al., Reference Olori, Brotherstone, Hill and McGuirk1999; Macciotta et al., Reference Macciotta, Vicario and Cappio-Borlino2005). The functions developed are useful in genetic analysis of TD records to account for stage of lactation and modelling of covariance between TDs in random regression analysis (Guo and Swalve, Reference Guo and Swalve1995; Jamrozik et al., Reference Jamrozik, Schaeffer and Dekkers1997). Therefore, modelling of lactation curves offer a summary of longitudinal milk yield patterns by which accurate predictions of daily and total lactation milk yield would be made from incomplete data (Sherchand et al., Reference Sherchand, McNew, Kellogg and Johnson1995; Olori et al., Reference Olori, Brotherstone, Hill and McGuirk1999; Quinn et al., Reference Quinn, Killen and Buckley2005). This could thus effectively address issues of data quantity and quality that arise from missing records, as well as facilitating evaluation of bulls whose daughters may not have completed a full lactation in the young bull breeding schemes.
In order to adopt a mathematical function for prediction of cow lactation performance, the function should accurately describe the available data. Studies on accuracy of the mathematical functions to describe the lactation curve have reported varied results with no agreement on a function offering the best fit across studies (Sherchand et al., Reference Sherchand, McNew, Kellogg and Johnson1995; Olori et al., Reference Olori, Brotherstone, Hill and McGuirk1999; Silvestre et al., Reference Silvestre, Petim-Batista and Colaço2005 and Reference Silvestre, Petim-Batista and Colaço2006). A single curve function to describe the lactation properties of the dairy cow population in Kenya to enable extrapolation of incomplete lactations and interpolation of missing information is lacking. In addition, effects of missing records have not been quantified in a way that could enable recommendation of a more flexible TD sampling regime. Therefore, this study aims at (i) establishing a suitable lactation function to describe the dairy cattle data and (ii) assessing the effect of data characteristics on the parameters of the lactation curve functions in order to facilitate inclusion of partial lactations in national dairy cattle evaluation and to reduce the TD sampling frequency.
Material and methods
Milk yield records were obtained from the national dairy cattle database at the Livestock Recording Centre (LRC) in Naivasha, Kenya. The LRC is the national animal evaluation organisation and receives milk production data from the Dairy Recording Services of Kenya (DRSK). The DRSK is a dairy cattle producer organisation that facilitates and implements milk recording in Kenya. It is the national organisation mandated to perform official milk recording. TD milk records are taken using method B of the International Committee on Animal Recording (ICAR, 2009). To ensure the authenticity of the records, DRSK staff make impromptu visits on the farms when anomalies are detected in the data.
Dairy cattle in Kenya were raised under large-scale, medium-scale and small-scale production systems (Peeler and Omore, Reference Peeler and Omore1997). Recording among the small-scale producers was scanty; as a result, most of the producers who send their data to DRSK had either large-scale or medium-scale farms. These farms were located mainly in Kenyan Agro Ecological Zones (AEZ) 1, 2 and 3, although some were found in AEZ 4 where the annual rainfall ranges from 600 to 2700 ml (Karanja, Reference Karanja2006). From this benchmark rainfall ranges, variation in distribution and intensity existed between the zones over time. This led to variability in feeding management of animals between the farms as pastures in the farms were rain fed.
Generally, animals were raised on established pastures where they grazed on a rotational basis in paddocks in large-scale systems or were stall fed in medium-scale and in small-scale systems, during the day. Supplementary feeding on total mixed ration or commercial concentrates was carried out at milking, although the level of supplementation was higher in large-scale systems relative to medium-scale and small-scale systems. During dry seasons when feed resources were scarce, animals across the production systems were fed on conserved forages (hay and silage) and crop residues treated with urea and molasses. In addition, animals were provided with mineral lick and with water ad libitum. Owing to dependency of pasture on rainfall, the quantity and quality fluctuated in response to rainfall distribution and in response to intensity in the country. Disease management was through prophylactic treatment of endemic diseases and through curative treatment of occurrences. Control of parasites was through routine dipping or spraying and through drenching. Continuous mating of animals was practised, which led to calving throughout the year.
Sampling of milk yield on the farm was performed on a monthly basis, every 14th day evening and 15th day morning, throughout the entire lactation using a milk entry form provided by the DRSK. The earliest milk sample was taken 5 days post partum.
Data for these study consisted of TD milk yield records from parity one to six of Holstein Friesian, Ayrshire, Jersey, Guernsey and Sahiwal cows that calve down between 1990 and 2006. Data were edited for consistency of date of calving, the date of first TD and drying date. Animals with less than 5 TDs per lactation and lactation following abortion were excluded from the study. Moreover, TD milk records that were taken earlier than the 5th day post partum were discarded and the subsequent record was considered as TD 1. Therefore, TD 1 had records taken on the animal between the 5th day to the 30th day post partum. In case of multiple sampling in a month, only one record, taken on or around the 14th and the 15th day of the month, was used. For samples recorded on days other than the 14th and the 15th day of the month, the records were retained as long as no other record was made in the same month.
Cows lactated year round and sometimes beyond; therefore, lactation length of 365 days in milk (DIM) was considered to represent a true field scenario. For cows that lactated beyond 365 days, the lactations were right-truncated at 365 DIM. The entire lactation length was clustered into 12 TDs as follows: TD 1 = 5 to 30 DIM, TD 2 = 31 to 60 DIM, TD 3 = 61 to 90 DIM, TD 4 = 91 to 120 DIM…TD 12 = 331 to 360 DIM. From the original database, a total of 175 913 TD milk yield records of 9589 cows from 155 herds were available. This constituted the main dataset (DS-1) for analysis.
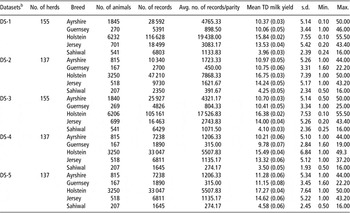
Two datasets were further extracted from DS-1 to depict various recording circumstances. Dataset two (DS-2) consisted of 10-TD milk yield records with no missing records. This dataset had animals with milk yield samples taken from TDs 1 to 10. Dataset three (DS-3) consisted of 10-TD milk yield records with some randomly missing records to depict a recording regime faulted by missing records. Animals that constituted this dataset had at least five milk yield records. From data DS-2, datasets four (DS-4) and five (DS-5) were extracted to examine the effects of missing data on the lactation curve parameters and the feasibility of reducing the number of TDs per lactation. DS-4 was a 7-TD dataset with only TDs 4 to 10 milk yield records present (i.e. milk yield records for TD 1, 2 and 3 were discarded). DS-5 consisted of 7-TD milk yield records. This included milk yield records for TD 1, 2, 3, 4, 6, 8 and 10, that is, from TD 4, the interval between records was increased to 2 months to depict reduced sampling frequency by discarding records taken on TD 5, 7 and 9. Table 1 shows the number of records and summary statistics for milk yield in the various datasets.
Structure of the data and summary statisticsFootnote a of TD milk yield (in kg)

TD = test day.
a Standard error for mean TD milk yield is given in parentheses.
b DS-1 = a 12-TD dataset with randomly missing TD records; DS-2 = a 10-TD dataset without missing TD records; DS-3 = a 10-TD dataset with randomly missing TD records; DS-4 = 7-TD record dataset (milk records taken from the 4th month post partum); DS-5 = a 7-TD dataset (TDs 1, 2, 3 and 4 taken on a monthly basis post partum and TDs 5, 6 and 7 taken bimonthly).
Six lactation functions were fitted to the datasets to determine the function that best described the lactation curve of the dairy cows under the varying recording conditions. Each lactation function was fitted on an individual cow lactation TD data with breed of the cow and parity fitted as classification variables and DIM as the predictor. The functions included:
(a) The incomplete gamma function (WD) described by Wood (Reference Wood1967)
![\[--><$$>\eqalign{\[{{Y}_t} = a{{t}^b} {{e}^{{\rm{ - }}ct}} \eqno (1)<$$><!--\]](https://static.cambridge.org/binary/version/id/urn:cambridge.org:id:binary:20160119061532948-0148:S1751731111000954_eqnU1.gif?pub-status=live)
where Yt is the TD milk yield at DIM t in all the functions and a, b and c in function (1) are parameters representing a scaling factor associated with initial milk yield, the pre-peak and post-peak curvatures, respectively.
(b) The exponential function (WIL) described by Wilmink (Reference Wilmink1987)
![\[--><$$>\eqalign{\[{{Y}_t} = a + b{{e}^{{\rm{ - }}kt}} + ct \eqno (2)<$$><!--\]](https://static.cambridge.org/binary/version/id/urn:cambridge.org:id:binary:20160119061532948-0148:S1751731111000954_eqnU2.gif?pub-status=live)
where a, b and c are parameters associated with the level of production, increase of production pre-peak and the subsequent post-peak decrease, respectively. Parameter k assumes a fixed value derived from preliminary analysis and is associated with time of peak lactation (Wilmink, Reference Wilmink1987).
(c) The mixed logarithm function (GUOS) of Guo and Swalve (Reference Guo and Swalve1995)
![\[--><$$>\eqalign{\[{{Y}_t} = a + b\sqrt t + c\:\ln \left( t \right) \eqno (3)<$$><!--\]](https://static.cambridge.org/binary/version/id/urn:cambridge.org:id:binary:20160119061532948-0148:S1751731111000954_eqnU3.gif?pub-status=live)
where a, b and c are the parameters.
(d) The polynomial regression function (ALIS) of Ali and Schaeffer (Reference Ali and Schaeffer1987)
![\[--><$$>\eqalign{\[{{Y}_t} = a + b\gamma + c{{\gamma }^2} + d\omega + \rho {{\omega }^2} \eqno (4)<$$><!--\]](https://static.cambridge.org/binary/version/id/urn:cambridge.org:id:binary:20160119061532948-0148:S1751731111000954_eqnU4.gif?pub-status=live)
where γ = t/305, ω = ln(305/t), a is a parameter associated with the peak yield, d and ρ are associated with the ascending part of the curve and b and c are associated with the descending curvature.
(e) The mechanistic function (DIJ) of Dijkstra et al. (Reference Dijkstra, France, Dhanoa, Maas, Hanigan, Rook and Beever1997)
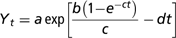
(f) The additive form of the mechanistic function (APOL) by Pollott (Reference Pollott2000)

The functions were fitted to the DSs using an iterative nonlinear curve-fitting procedure (PROC NLIN of SAS; SAS, 2004). A Marquardt algorithm computational strategy was used to search for the ‘best-fit’ solution. The ‘best-fit’ curve was assumed when the difference between error sums of squares in successive iterations was less than 10−6.
The ability of functions to fit the data was compared using adjusted coefficient of determination (R 2adj) calculated as
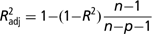
where R 2 = coefficient of determination (equal to 1−(RSS/TSS)), RSS = residual sum of squares, TSS = total sum of squares, n = number of observations and p = number of parameters.
Lactation functions that had R 2adj values greater than 0.75 were considered for the second step of analysis where predictive abilities of the chosen curves were assessed and the parameters of lactation curve functions were estimated. To establish the average lactation curves of cows within parities, the estimated parameters were averaged out weighting the estimates with their corresponding standard errors. The accuracy of prediction of the functions was evaluated by examining (i) the mean square prediction error (MSPE) calculated as

where et is the residual for the milk yield at DIM t of test and n is the number of predicted values obtained; (ii) the correlation between true milk yield and predicted milk yield (r) to quantify the degree of association between the real and estimated values; and (iii) the percentage of squared bias (PSB; Ali and Schaeffer, Reference Ali and Schaeffer1987). The PSB is computed as
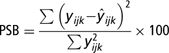
where yijk is the actual milk yield and  is the predicted milk yield.
Results and discussion
Fit of the lactation functions to the data
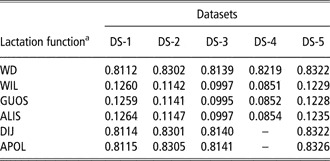
Estimates of R 2adj to determine the fit of the functions on the five datasets are presented in Table 2. Only WD, DIJ and APOL functions had R 2adj values large than 0.75. The APOL function had the highest value of R 2adj in its runs, which converged. However, most iterations of the APOL function failed to converge resulting in its elimination. Convergence failure could be attributed to over parameterisation of the function relative to the information in the data. Val-Arreola et al. (Reference Val-Arreola, Kebreab, Dijkstra and France2004) in analysis of data from small-scale dairy farms obtained insignificant lactation curve parameters arising from an over-parameterised APOL function. The DIJ and WD functions fitted the data competitively. The other functions (WIL, GUOS and ALIS) fitted the data poorly as indicated by the low R 2adj values ( < 0.127). The better fit of WD function relative to WIL and ALIS is in contrast to literature reports and could be attributed to differences in the data properties (Olori et al., Reference Olori, Brotherstone, Hill and McGuirk1999; Macciotta et al., Reference Macciotta, Vicario and Cappio-Borlino2005; Silvestre et al., Reference Silvestre, Petim-Batista and Colaço2006). Data used in this study were sparse in structure and in form as depicted by the summary statistics in Table 1.
Adjusted R 2 values of the lactation functions fitted to the five datasets depicting various recording conditions

aWD = incomplete gamma function of Wood (Reference Wood1967); WIL = exponential function of Wilmink (Reference Wilmink1987); GUOS = mixed log function of Guo and Swalve (Reference Guo and Swalve1995); ALIS = polynomial regression function of Ali and Schaeffer (Reference Ali and Schaeffer1987); DIJK = mechanistic function of Dijkstra et al. (Reference Dijkstra, France, Dhanoa, Maas, Hanigan, Rook and Beever1997); APOL = additive form of the mechanistic function by Pollott (Reference Pollott2000).
Cases of failed convergence of DIJ function were noted in several lactations. These failures could be attributed to data characteristics as high frequency of convergence failure was reported in lactations of breeds (Guernsey, Jersey and Sahiwal) and datasets (DS-2 and DS-3) that had less observations and missing records, similar to DS-4 and DS-5 (results not shown). The result also points to high data requirements of DIJ function. The function is thus not appropriate in systems where animal records are inconsistent. The fit of both functions in different lactations and different breeds varied. Differences between parities arose from differences in information available within individual parities. Breed differences depicted variation in milk secretion ability between the breeds, which has a physiological implication (Dijkstra et al., Reference Dijkstra, France, Dhanoa, Maas, Hanigan, Rook and Beever1997; Pollott, Reference Pollott2000).
Predictive ability of the lactation functions
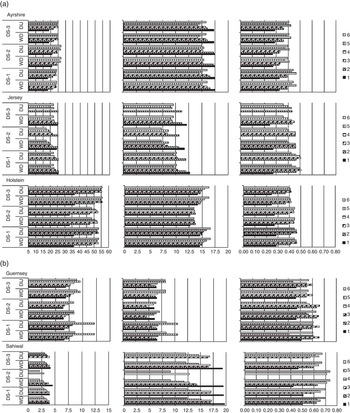
The prediction ability of the WD and DIJ functions are presented in Figure 1a and b. The ability of the lactation functions to predict TD milk yield was tested using MSPE, PSB and the correlation between actual and predicted TD milk yield. On the basis of MSPE, both functions predicted TD milk yield with a similar level of accuracy, although DIJ performed marginally better. The superiority of DIJ function over WD function was also reported in a study lactation curve of dairy cattle in Mexico (Val-Arreola et al., Reference Val-Arreola, Kebreab, Dijkstra and France2004). Prediction error in Ayrshire increased with parity, implying a decline in prediction accuracy with increasing parity. Accuracy of prediction for Jersey and Sahiwal generally increased with increasing parity as indicated by the decreasing prediction error in Figure 1b. Prediction of Holstein Friesian lactation curve was more accurate in the first lactation and decreased with increased parity to parity 3 after which the prediction accuracy fluctuated. Similarly, prediction of Guernsey lactation was more accurate in first lactation but dropped until fourth lactation when it improved again. Prediction was most accurate in Guernsey and Sahiwal, which incidentally had the lowest TD milk yield. The observed differences in the prediction error between breeds and parities may be attributed to the differences in curve characteristics, that is, curve shape (continuously decreasing, continuously increasing, the standard lactation curve and its reverse) and the gradient of the slope.
(a) Mean squared prediction error (left), percentage of squared bias (centre) and correlation between actual and predicted milk yield (right) in parities 1 to 6 of Ayrshire, Jersey and Holstein Friesian under three different field recording schemes (DS-1, DS-2 and DS-3) estimated by WD = incomplete gamma function of Wood (Reference Wood1967); DIJ = mechanistic function of Dijkstra et al. (Reference Dijkstra, France, Dhanoa, Maas, Hanigan, Rook and Beever1997). (b) Mean squared prediction error (left), percentage of squared bias (centre) and correlation between actual and predicted milk yield (right) in parities 1 to 6 of Guernsey and Sahiwal under three different field recording schemes (DS-1, DS-2 and DS-3) estimated using WD = incomplete gamma function of Wood (Reference Wood1967); DIJ = mechanistic function of Dijkstra et al. (Reference Dijkstra, France, Dhanoa, Maas, Hanigan, Rook and Beever1997).

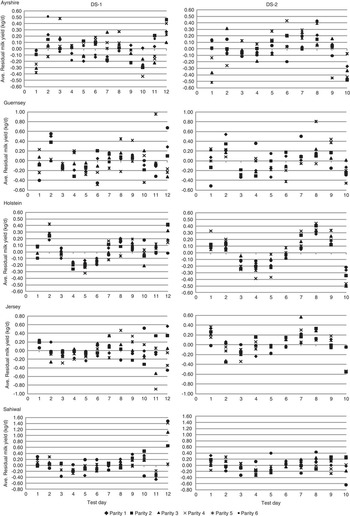
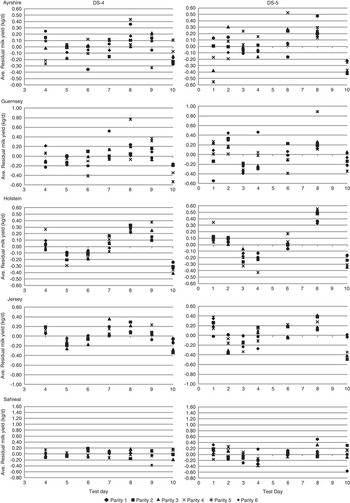
Distribution of residual milk yield along the lactation curve for datasets DS-1 and DS-2 estimated in various breeds using the WD function.

The generally lower MSPE in DS-2 (which was a 10-TD dataset without missing records) relative to other databases depicts the importance of consistent recording. Missing records have a negative impact on accuracy of prediction, especially when the data space was small as depicted by high MSPE values in DS-3 relative to DS-2 and DS-1. Consequently, a 10 TD recording regime calls for more consistent recording compared with a 12 TD recording regime to maintain accuracy.
PSB and the correlation emphasise on the agreement between the shapes of actual and predicted lactation curves (Ali and Schaeffer, Reference Ali and Schaeffer1987). Estimation of bias of lactation curve did not vary greatly between functions, although DIJ gave a less biased curve than WD implying similarity in the shape of curves between the functions. This is confirmed by the estimated correlation between actual and predicted curves whose difference between the functions was marginal. The varied PSB and correlations between breeds and parities indicate the differences in the ability of functions to model lactation curves of the individual breeds and lactations due to differences in the shapes of predicted lactation curves between breeds and lactations. This is further supported by plots of predicted TD milk yield in Figure 2. Variation in PSB could be attributed to the range in TD milk yield. Breeds that had large data ranges generally had more biased lactation curves. Olori et al. (Reference Olori, Brotherstone, Hill and McGuirk1999) observed the difficulty that functions encountered in predicting very high and low yields. Owing to these differences, high precision could be achieved through breed and lactation-specific performance evaluation. PSB and correlation between datasets were different indicating the influence of data characteristics on the shape of the estimated lactation curves. Bias was less in predicted lactation curve from DS-2, which did not have missing records than DS-1 and DS-3.
Distribution of residual milk yield along the lactation curve for datasets DS-4 and DS-5 estimated in various breeds using the WD function.

The distribution of residuals along the lactation curve is an indicator of presence or absence of autocorrelation between the function parameters that influence the bias and accuracy of prediction (Olori et al., Reference Olori, Brotherstone, Hill and McGuirk1999; Silvestre et al., Reference Silvestre, Petim-Batista and Colaço2006). The distribution of residual milk yield along the lactation curves of the various breeds is presented in Figure 2a and b. Random distribution of the residuals around zero was observed in Guernsey and in Sahiwal in both functions (results of DIJ not presented), implying that the functions more satisfactorily described the lactation curves of these breeds than in Ayrshire, Holstein and Jersey. For instance in the Holstein Friesian, milk yield was underestimated in early lactation, followed by overestimation in mid lactation before it was underestimated again in late lactation. This form of patterns (presence of sequences of positive or negative residuals longer than expected) indicate non-random distribution of the error (Silvestre et al., Reference Silvestre, Petim-Batista and Colaço2006). In evaluation of fit of standard models of lactation to weekly records of milk production, inconsistent patterns of deviations of the residuals about zero were observed and attributed to the satisfactory fit of the model to the data (Olori et al., Reference Olori, Brotherstone, Hill and McGuirk1999). Differences in the magnitude of the residuals indicate the variation in the level of accuracy of prediction of the various parts of the lactation function. Large estimates of residuals at the extreme ends of the lactation curves could be as a result of the inability of the function to model extremely high and low milk yield recorded in these parts of the curves.
Effects of data characteristics on estimates of lactation curve parameters and feasibility of reducing the number of TDs per lactation
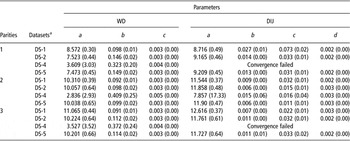
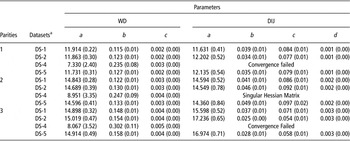
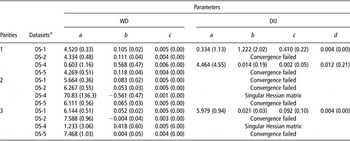
Estimates of lactation curve parameters of Ayrshire, Holstein Friesian and Sahiwal from different DSs are presented in Tables 3 to 5. Data structure affected the parameters as depicted by the variations in the estimates and their standard errors between datasets. Relative to DS-2, the parameter a associated with initial milk production was overestimated in DS-1 and underestimated in DS-4. Estimate of this parameter in DS-5 was close to DS-2. Conversely, the inclining slope of the curve (b) was underestimated in DS-1 and overestimated in DS-4. The estimate of this parameter was similar between DS-2 and DS-5. Parameters c and d, associated with the declining slope of the curve, were fairly constant especially in Tables 3 and 4. Changes in a and b parameters due to influence of data characteristics, especially missing information in inclining phase of lactation as observed in this study, would result in dramatic changes in the shape of the lactation curve, even when parameters c and d remained constant. This can be observed in the differences in the distribution of the residuals in Figure 2a and b.
Estimates of lactation curve parameters in the first three parities (with standard errors in parentheses) for Ayrshire from four datasets (DS-1, DS-2, DS-4 and DS-5) using Wood (WD) and Dijkstra (DIJ) functions

TD = test day.
aDS-1 = a 12-TD dataset with randomly missing TD records; DS-2 = a 10-TD dataset without missing TD records; DS-4 = 7-TD record dataset (milk records taken from the 4th month post partum); DS-5 = a 7-TD dataset (TDs 1, 2, 3 and 4 taken on a monthly basis post partum and TDs 5, 6 and 7 taken bimonthly).
Lactation curve parameters in the first three parities of the Holstein Friesian cattle (with standard errors in parentheses) from four datasets (DS-1, DS-2, DS-4 and DS-5) estimated using Wood (WD) and Dijkstra (DIJ) functions

TD = test day.
aDS-1 = a 12-TD dataset with randomly missing TD records; DS-2 = a 10-TD dataset without missing TD records; DS-4 = 7-TD record dataset (milk records taken from the 4th month post partum); DS-5 = a 7-TDdataset (TDs 1, 2, 3 and 4 taken on a monthly basis post partum and TDs 5, 6 and 7 taken bimonthly).
Estimates of lactation curve parameters for the first three parities (with standard errors in parentheses) for Sahiwal from four datasets (DS-1, DS-2, DS-4 and DS-5) using Wood (WD) and Dijkstra (DIJ) lactation functions

TD = test day.
aDS-1 = a 12-TD dataset with randomly missing TD records; DS-2 = a 10-TD dataset without missing TD records; DS-4 = 7-TD record dataset (milk records taken from the 4th month post partum); DS-5 = a 7-TD dataset (TDs 1, 2, 3 and 4 taken on a monthly basis post partum and TDs 5, 6 and 7 taken bimonthly).
The closeness of parameter estimates between DS-2 and DS-5 indicate that fairly accurate estimates could be achieved when recording is sparse in the declining phase of the lactation curve. This implies that TD milk sampling could successfully be reduced from 10 to 7 without adversely compromising on the accuracy of estimation. However, it is imperative that milk is consistently recorded in early lactation (inclining phase of the curve). Similar observations were made in evaluation of accuracy of mathematical functions to model dairy cattle lactation curves based on TD records from varying sample schemes (Silvestre et al., Reference Silvestre, Petim-Batista and Colaço2006). The functions’ ability to adapt to data characteristics varied with WD function showing more adaptability to adverse data conditions than the DIJ function. Incidences of convergence failure and singularity in the Hessian matrix increased with decline in the quality and quantity of data (Tables 3 to 5). Dijkstra et al. (Reference Dijkstra, France, Dhanoa, Maas, Hanigan, Rook and Beever1997) also reported incidences of convergence failure when DIJ function was used to describe milk production in a number of animals. The volume of data and connectivity between data points in the dataset is important for accurate estimation of the lactation curve parameters.
Conclusion
The WD and DIJ functions showed superior fit to the data. The WD function showed high adaptability to the various data characteristics and could be used in both situations where animal recording is being introduced and thus recording is not consistently practised, and in the situation where recording of animal performance is routinely practised. DIJ function, owing to easy physiological interpretation of its parameters, would be an ideal function for describing lactation performance of Kenyan dairy cattle. However due to its data requirements, it remains restricted to large-scale dairy systems with consistent recording. Data characteristics have a major influence on lactation curve parameters. Consequently, efforts should be made to ensure consistent records that would confer accurate estimates. The importance of early lactation records relative to records in later stages of lactation have been demonstrated through their influence on the lactation curve parameters. Producers should pay attention to these records if accuracy of estimation is to be attained. TD sampling could be reduced by minimising the sampling frequency in the later lactation while maintaining the monthly sampling frequency in early lactation.