



1. Introduction
The capture of a bubble under an impacting drop can have detrimental effects on the uniformity of spray coatings and interfere with precision inkjet-based manufacturing, like the printing of organic displays. For the lowest impact velocities or superhydrophobic surfaces, the air cushion can allow rebounding of the drop and prevent molecular contact with the substrate (Richard, Clanet & Quéré Reference Richard, Clanet and Quéré2002; Kolinski et al. Reference Kolinski, Rubinstein, Mandre, Brenner, Weitz and Mahadevan2012; de Ruiter et al. Reference de Ruiter, Oh, van den Ende and Mugele2012; van der Veen et al. Reference van der Veen, Tran, Lohse and Sun2012). However, above a modest impact velocity the drop always makes contact along a ring, entrapping a central bubble. Early snapshots of these bubbles are due to Chandra & Avedisian (Reference Chandra and Avedisian1991) and Thoroddsen & Sakakibara (Reference Thoroddsen and Sakakibara1998), but without any dynamical details. Van Dam & Le Clerc (Reference Van Dam and Le Clerc2004) also observed bubbles under small inkjet droplets. Thoroddsen et al. (Reference Thoroddsen, Etoh, Takehara, Ootsuka and Hatsuki2005) used high-speed video imaging to capture the air-disc formation and its contraction into a central bubble. They also observed pinch-off of a micro-droplet inside the entrapped bubble. This occurs when capillary waves converge to the axis of symmetry and their apex touches the substrate. Lee et al. (Reference Lee, Weon, Je and Fezzaa2012) used X-ray imaging to confirm these dynamics in renewed detail.
Previous time-resolved interferometric measurements of the air-layer shape under the drop have been limited to very low impact velocities (
 ${\leqslant}0.22~\text{m}~\text{s}^{-1}$
) mostly in the bouncing regime. These are by de Ruiter et al. (Reference de Ruiter, Oh, van den Ende and Mugele2012) who used a two-colour setup and by van der Veen et al. (Reference van der Veen, Tran, Lohse and Sun2012) who used white-light colour interferometry. Kolinski et al. (Reference Kolinski, Rubinstein, Mandre, Brenner, Weitz and Mahadevan2012) used a total internal reflection (TIR) setup to characterize the closest approach of the drop to the substrate. The focus has been either on the incompressible bouncing dynamics, which can occur even for hydrophilic surfaces (Kolinski, Mahadevan & Rubinstein Reference Kolinski, Mahadevan and Rubinstein2014; de Ruiter et al.
Reference de Ruiter, Lagraauw, van den Ende and Mugele2014), or on predicting the size of the entrapped bubble. Bouwhuis et al. (Reference Bouwhuis, van der Veen, Tran, Keij, Winkels, Peters, van der Meer, Sun, Snoeijer and Lohse2012) showed that there exists a maximum in the entrapped bubble size for a fairly low impact velocity. Klaseboer, Manica & Chan (Reference Klaseboer, Manica and Chan2014) formulated a unifying theory for drops entrapping bubbles, proposing a slightly different power law, based on a different velocity potential within the drop.
Driscoll & Nagel (Reference Driscoll and Nagel2011) used interferometry to image the central air disc for drop impacts under a reduced pressure environment and showed that it becomes flatter. Liu, Tan & Xu (Reference Liu, Tan and Xu2013) have recently reported the first interference imaging under similar impact conditions to those herein. However, the imaging in these studies was not time-resolved.
Theoretical modelling of the air cushioning under the drop started with the two-dimensional (2-D) theories of Smith, Li & Wu (Reference Smith, Li and Wu2003) and Korobkin, Ellis & Smith (Reference Korobkin, Ellis and Smith2008). These are based on the lubrication approximation for the air flow within the thin film, while using inviscid potential theory for the deformations within the drop. Later, Hicks & Purvis (Reference Hicks and Purvis2010) reformulated the theory for the three-dimensional (3-D) axisymmetric configuration, which allows for a more direct comparison with experiments.
Mandre, Mani & Brenner (Reference Mandre, Mani and Brenner2009) expanded the lubrication theory to allow for compression of the gas, when the impact velocity becomes large enough. They used the ideal gas law to predict the minimum air-disc thickness for either isothermal or adiabatic gas compression. Their subsequent work used the same equation of state with various values of the ratio of the specific heats
 ${\it\gamma}$
to describe drop skating on a thin layer of air (Mani, Mandre & Brenner Reference Mani, Mandre and Brenner2010) and then focused on the isothermal case, to study the related precursors of splashing (Mandre & Brenner Reference Mandre and Brenner2012). Hicks & Purvis (Reference Hicks and Purvis2013) followed up the studies of gas compression, with full analysis of the energy conservation in the gas. They further tested their theories by comparison with large-scale experiments on the impact of spherical solid sections (Hicks et al.
Reference Hicks, Ermanyuk, Gavrilov and Purvis2012).
Herein we exploit the latest high-speed video technology to observe the air entrapment at about two orders of magnitude faster frame rates than in earlier observations (Driscoll & Nagel Reference Driscoll and Nagel2011; Kolinski et al. Reference Kolinski, Rubinstein, Mandre, Brenner, Weitz and Mahadevan2012; de Ruiter et al. Reference de Ruiter, Oh, van den Ende and Mugele2012; van der Veen et al. Reference van der Veen, Tran, Lohse and Sun2012; Liu et al. Reference Liu, Tan and Xu2013). This allows us, for the first time, to obtain time-resolved interface shapes over the entire process, for high impact velocities well into the regime where gas compressibility is important (Mandre et al. Reference Mandre, Mani and Brenner2009).
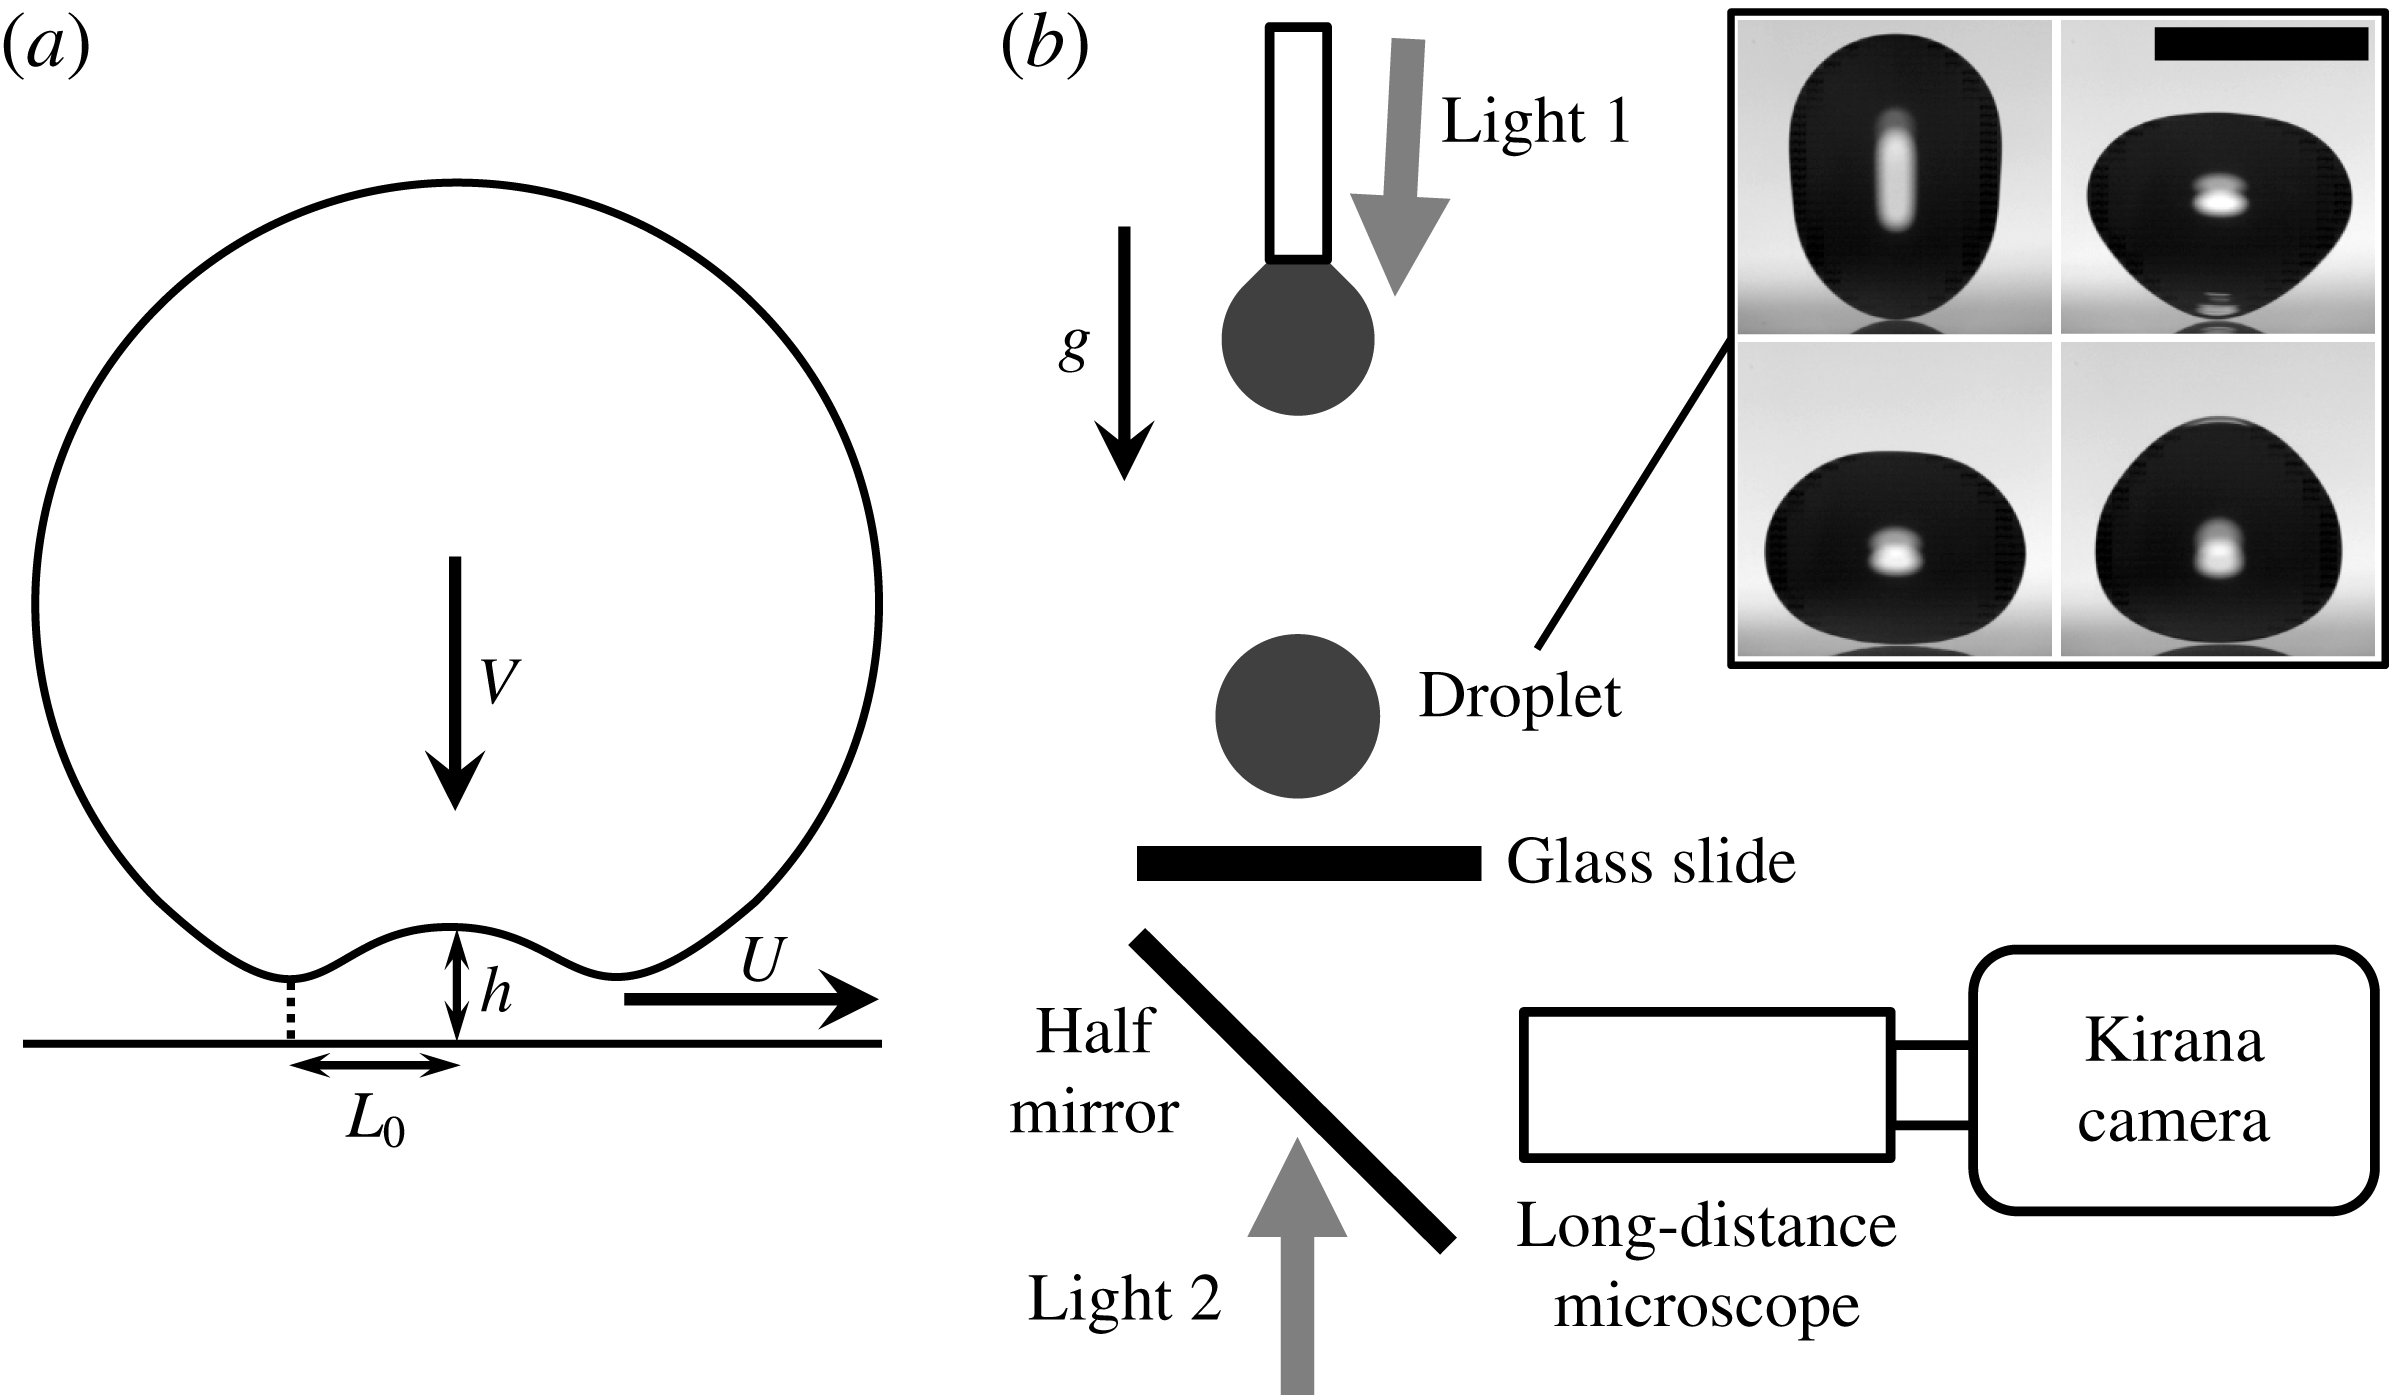
Experimental setup. (a) Definition of the radial width
 $L_{o}$
and
 $h(r,t)$
is the air-layer thickness profile with the characteristic thickness
 $H$
at the centerline. (b) Optical setup and a range of drop shapes (scale bar is 5 mm). We use either lighting from below with a half-silvered pellicle beam splitter, or a solid bottom mirror with lighting from the top going through the drop. Drop shapes are shown at
 $t=86~\text{ms}$
(top left); 106 ms (top right); 111 ms (bottom left) and 116 ms (bottom right) after pinch-off from the nozzle.
The observed interference fringes taken from 5 Mf.p.s. video clips. (a) For impact velocity
 $V=1.06~\text{m}~\text{s}^{-1}$
and bottom radius of curvature of the drop
 $R_{b}=4.1~\text{mm}$
. Shown at times
 $t=-15.6$
, 0 and
 $2.2~{\rm\mu}\text{s}$
(from left to right) relative to first contact along the ring. Lighting from bottom. (b) Fringes for
 $V=2.53~\text{m}~\text{s}^{-1}$
,
 $R_{b}=1.6~\text{mm}$
, at
 $t=-3.8$
, 0 and
 $2.2~{\rm\mu}\text{s}$
from first contact. Lighting from top. (c) Fringes for
 $V=4.05~\text{m}~\text{s}^{-1}$
,
 $R_{b}=3.2~\text{mm}$
, at
 $t=-1.6$
, 0 and
 $2~{\rm\mu}\text{s}$
from first contact. Lighting from top. The middle column shows in all cases the frame closest to first contact, whereas the last panel in each row shows the first maximum expansion at the centerline. Scale bars are all
 $200~{\rm\mu}\text{m}$
long. See supplementary movies available online at http://dx.doi.org/10.1017/jfm.2015.466.

2. Experimental setup
Our imaging is made possible by the Kirana-05M ultra-high-speed video camera (Specialised imaging, Tring, UK), see Crooks et al. (Reference Crooks, Marsh, Turchetta, Taylor, Chan, Lahav and Fenigstein2013), which is capable of capturing 180 frames at up to 5 million frames per second (Mf.p.s.). The sensor has
 $910\times 764$
active pixels, irrespective of the frame rate. Triggering is accomplished by the falling drop cutting the view of a horizontal line sensor (SI-OT3). The optical setup is sketched in figure 1(b). In combination with a long-distance microscope (Leica Z16 APO) at magnification of 29.5 we achieve a spatial resolution of
 $1.03~{\rm\mu}\text{m}~\text{pixel}^{-1}$
, even at the highest frame rates. We use 1-mm-thick microscope glass slide (Corning micro-slides 2947–75
 $\times$
50) as the substrate. The root-mean-square (r.m.s.) roughness measured with an atomic force microscope (AFM) is of the order of 7 nm, with the largest asperities around 20 nm. The impact is viewed from below, through the glass slide, with columnated illumination coming either through the drop, or through a bottom beam-splitter. Top lighting gives clearer images of the initial contact line. To minimize angular deflection of the columnated beam, we align it close to the vertical. For illumination we use 180 pulsed diode lasers (SI-LUX640) with monochrome light, with
 ${\it\lambda}=640~\text{nm}$
wavelength. This gives us depth resolution, or spacing between a bright and dark fringe, of
 ${\it\lambda}/4=160~\text{nm}$
. The laser pulses can be synchronized with the framing and their duration controlled down to 50 ns, thereby freezing the motion of the fringes. The 200 ns interframe time allows us to follow the individual fringes and thereby extract the shape evolution with time from the initial drop deformation through the contact with the solid surface and during the subsequent decompression and contraction of the entrapped air disc. This removes some of the ambiguity in tracking the absolute layer thickness, without applying the more sophisticated colour interferometry techniques employed by Mugele’s and Lohse’s research groups (de Ruiter et al.
Reference de Ruiter, Oh, van den Ende and Mugele2012; van der Veen et al.
Reference van der Veen, Tran, Lohse and Sun2012).
We use large water drops to increase the space and time scales of the impact, thereby extracting the best resolution from the instrumentation. This is characterized by a global Reynolds number,
 $Re={\it\rho}_{l}RV/{\it\mu}_{l}\sim 2600{-}15\,700$
, and Weber number
 $We={\it\rho}_{l}RV^{2}/{\it\sigma}\sim 36{-}1300$
, where
 $R$
is the equivalent spherical drop radius (2.6 mm) and
 $V$
is the impact velocity (
 ${\sim}1{-}6~\text{m}~\text{s}^{-1}$
);
 ${\it\rho}_{l}$
,
 ${\it\mu}_{l}$
and
 ${\it\sigma}$
are respectively the density, dynamic viscosity and surface tension of the liquid. Equivalently, a subscript
 $g$
is used to indicate gas properties.
3. Results
3.1. Shape evolution of the air disc
Figure 2 shows examples of the interference fringes for different impact velocities and drop sizes. Figure 2(a) uses bottom reflection interferometry, which gives us better image contrast, compared to the top transmission-light interference fringes shown in figure 2(b,c). Furthermore, the liquid–solid contact zone in the right-most panel of figure 2(a) appears dark as most of the light passes directly through this liquid–solid interface and shines away from the camera. On the other hand, this contact zone is bright in figure 2(b,c) as the light passes through the liquid–solid interface towards the camera. The wiggled circular lines in the right-most column represent the location of the inner contact lines at the edge of the enclosed air disk. The smooth circular lines in the upper right corners of figure 2(a,b) are the outer edges of the wet region.
Keep in mind that we use the bottom radius of curvature,
 $R_{b}$
, as the characteristic drop dimension, to account for the large shape oscillations following the release from the nozzle, as has been highlighted in other impact studies (Thoroddsen et al.
Reference Thoroddsen, Etoh, Takehara, Ootsuka and Hatsuki2005; Hicks & Purvis Reference Hicks and Purvis2010; Liu et al.
Reference Liu, Tan and Xu2013; Thoraval et al.
Reference Thoraval, Takehara, Etoh and Thoroddsen2013; Wang, Kuan & Tsai Reference Wang, Kuan and Tsai2013). The shape at impact was monitored from a side view, with a separate high-speed video camera (Phantom V1610), at 20 kf.p.s. and with a
 $3~{\rm\mu}\text{s}$
exposure. Figure 1(b) shows some of the varied shapes of drops studied. The fringes remain axisymmetric, both for top and bottom illumination. Note that for the largest
 $V$
, at first contact there are many fewer fringes, which indicates a thinner air disc.
The air-layer thickness profiles under the drops, measured from the interferometric video clips at 5 Mf.p.s. The black dashed horizontal line marks the surface of the solid glass substrate. (a–c) For
 $V=2.43~\text{m}~\text{s}^{-1}$
and
 $R_{b}=8.2~\text{mm}$
(
 ${\it\epsilon}^{-1}=6.0$
,
 $St=9.2\times 10^{-7}$
). (a) The bottom deformation of the approaching drop. The black curves are spaced by 400 ns, with the bottom curve at
 $2.2~{\rm\mu}\text{s}$
before touchdown, which is shown by the red curve. The dots mark the centre locations of the dark or bright fringes, with interpolations at the centreline and at the tip of the downwards kink in (b, f). (b) Detail of the formation of the bottom dimple and touchdown of the outer kink, to entrap the air disc. Note the different vertical scales. The dashed red curve denotes the last profile in (a). Profiles spaced by 200 ns. (c) Rapid expansion of the air disc, after first contact. Profiles spaced by 400 ns. The thickness of the edge of the contracting air disc cannot be measured and we simply draw it as a flat segment, but it is much thicker than the disc, see Thoroddsen et al. (Reference Thoroddsen, Etoh, Takehara, Ootsuka and Hatsuki2005), Lee et al. (Reference Lee, Weon, Je and Fezzaa2012) and Liu et al. (Reference Liu, Tan and Xu2013). (d) Shapes for
 $V=4.05~\text{m}~\text{s}^{-1}$
and
 $R_{b}=3.2~\text{mm}$
(
 ${\it\epsilon}^{-1}=14.4$
,
 $St=1.4\times 10^{-6}$
). Profiles shown at
 $t=-2$
,
 $-1.8$
,
 $-1.6$
,
 $-1.4$
,
 $-1.2$
,
 $-1$
,
 $-0.8$
, 0,
 $2.2~{\rm\mu}\text{s}$
relative to first contact. In this case the last three profiles before contact (not shown) cannot be determined accurately. The open red squares show the shape of the air disc at first contact and the open blue circles at the end of the rapid expansion. (e, f) Shapes for
 $V=1.06~\text{m}~\text{s}^{-1}$
and
 $R_{b}=4.1~\text{mm}$
(
 ${\it\epsilon}^{-1}=0.69$
,
 $St=4.3\times 10^{-6}$
). (e) Bottom deformation of the drop, at
 $t=-22$
,
 $-20$
,
 $-18$
,
 $-16$
,
 $-14$
,
 $-12.6$
,
 $-11$
and
 $-10.4~{\rm\mu}\text{s}$
before contact (red curve). (f) Closeup of central dimple and downwards kink. Times shown at
 $t=-10.4$
,
 $-9.8$
,
 $-9.2$
,
 $-8.6$
,
 $-8$
,
 $-7.4$
,
 $-6.4$
,
 $-5.6$
,
 $-4.6$
 $-3.8$
,
 $-2.8$
,
 $-1.6$
and
 $0~{\rm\mu}\text{s}$
relative to first contact (red curve).

The radial velocity of the minimum thickness kink in the bottom surface, which first touches the substrate, compared with the theoretically predicted power law from (3.1). The data encompass the entire range of impact velocities, including the compressible regime.

Figure 3 shows the surface shapes,
 $h(r,t)$
, extracted from the fringes, when the drop approaches, deforms and contacts the glass substrate. The deceleration of the drop bottom is very abrupt, the drop retaining at least 80 % of
 $V$
to within
 $10~{\rm\mu}\text{m}$
from the solid surface. The measured deceleration of the bottom of the drop for
 $V=4.05~\text{m}~\text{s}^{-1}$
is
 $\simeq 3\times 10^{5}~\text{g}$
. Then the motion at the axis of symmetry reverses and a dimple forms under its centre, which is bounded at the outer edge by a kink in the surface, highlighted schematically in figure 1(a). The kink moves radially outwards at rapid horizontal velocity
 $U$
. This kink makes the first circular contact with the solid, thereby entrapping the air disc (Korobkin et al.
Reference Korobkin, Ellis and Smith2008; Mandre et al.
Reference Mandre, Mani and Brenner2009; Duchemin & Josserand Reference Duchemin and Josserand2011; Hicks & Purvis Reference Hicks and Purvis2013). From the video clips we can measure
 $U$
. In figure 4 we plot this velocity normalized by the drop impact velocity. For the largest impact velocity,
 $V=6~\text{m}~\text{s}^{-1}$
, we get
 $U/V\simeq 50$
, which is even larger than the velocity of the ejecta moving along the substrate, see Thoroddsen, Takehara & Etoh (Reference Thoroddsen, Takehara and Etoh2012).
Mandre et al. (Reference Mandre, Mani and Brenner2009) found a self-similar solution of the simplified equations for the shape and radial velocity of this kink at the outer edge of the dimpled region. This solution makes contact with the solid surface in finite time and the horizontal velocity of the kink location is dominated by radial advection within the liquid. The similarity gives the scaling
 $U\sim V(h_{min}/R)^{-1/2}$
, where
 $h_{min}$
is the minimum gap under the kink, while
 $h_{min}/R\sim St^{2/3}$
, resulting in
 $$\begin{eqnarray}U\sim V\;St^{-1/3}\end{eqnarray}$$
with a prefactor of
 $O(1)$
. Here
 $St$
is defined as the inverse of the conventional Stokes number, i.e.
 $$\begin{eqnarray}\displaystyle St=\frac{{\it\mu}_{g}}{{\it\rho}_{l}VR_{b}}. & & \displaystyle\end{eqnarray}$$
Our data in figure 5 show good correspondence with this scaling with a prefactor of 0.42. Mandre & Brenner (Reference Mandre and Brenner2012) (their figure 3) show the same power law with a similar prefactor of 0.34 for the 2-D case, at lower impact velocities. See also the axisymmetric simulations of the surface shapes by Duchemin & Josserand (Reference Duchemin and Josserand2011).
The shape evolution shown in figure 3(b, f) is very similar to those obtained from solutions of the lubrication theory, see for example figure 2 in Duchemin & Josserand (Reference Duchemin and Josserand2011) and figure 2(a) in Hicks & Purvis (Reference Hicks and Purvis2013).
The subsequent contraction of the air disc, after liquid–solid contact, into a bubble was successfully modelled by Thoroddsen et al. (Reference Thoroddsen, Etoh, Takehara, Ootsuka and Hatsuki2005) assuming an increasing but uniform disc thickness. However, the edge of the contracting air disc grows in size, forming a rim. Liu et al. (Reference Liu, Tan and Xu2013) improved upon this model by taking into account this thickening of the edge.
3.2. Size of the initial air disc
The deformation of the bottom of the drop, leading to the dimple formation and entrapment of the air disc, is governed by a balance between the lubrication pressure in the air trying to escape the oncoming drop
 $P\sim {\it\mu}_{g}VR_{b}/H^{2}$
, and the inertia of the drop, which must be decelerated before contact,
 ${\it\rho}_{l}V^{2}/H^{\ast }$
, where
 $H^{\ast }$
is the thickness of the air layer at the start of drop deformation. This gives a layer height
 $H^{\ast }\sim R_{b}St^{2/3}$
. Based on this, one can use simple geometric arguments for the horizontal size of the air disc (
 $L=\sqrt{R_{b}H}$
, Mandre et al.
Reference Mandre, Mani and Brenner2009) to get
 $L/R_{b}\sim St^{1/3}$
, in the incompressible case. However, the horizontal extent of the air disc, where the drop contacts the solid, is determined by the touchdown of the kink in the free surface, described by the above-mentioned similarity solution from Mandre et al. (Reference Mandre, Mani and Brenner2009). The drop liquid deforms inviscidly, funnelling liquid away from the central stagnation point, thereby increasing the velocity components of the kink, which in turn is resisted from contact by the increased pressure in the air layer. This is repeated on ever smaller length scales until contact is made in finite time, see discussion in Mandre & Brenner (Reference Mandre and Brenner2012).
Theoreticians prefer to tackle the 2-D configuration (Mandre et al. Reference Mandre, Mani and Brenner2009; Hicks & Purvis Reference Hicks and Purvis2013), representing cylindrical drops. While their scaling arguments carry over from 2-D, only the axisymmetric theory allows quantitative comparison to experiments. Hicks & Purvis (Reference Hicks and Purvis2010) formulated such a theory for the incompressible case, where they predicted the initial contact radius of the disc,
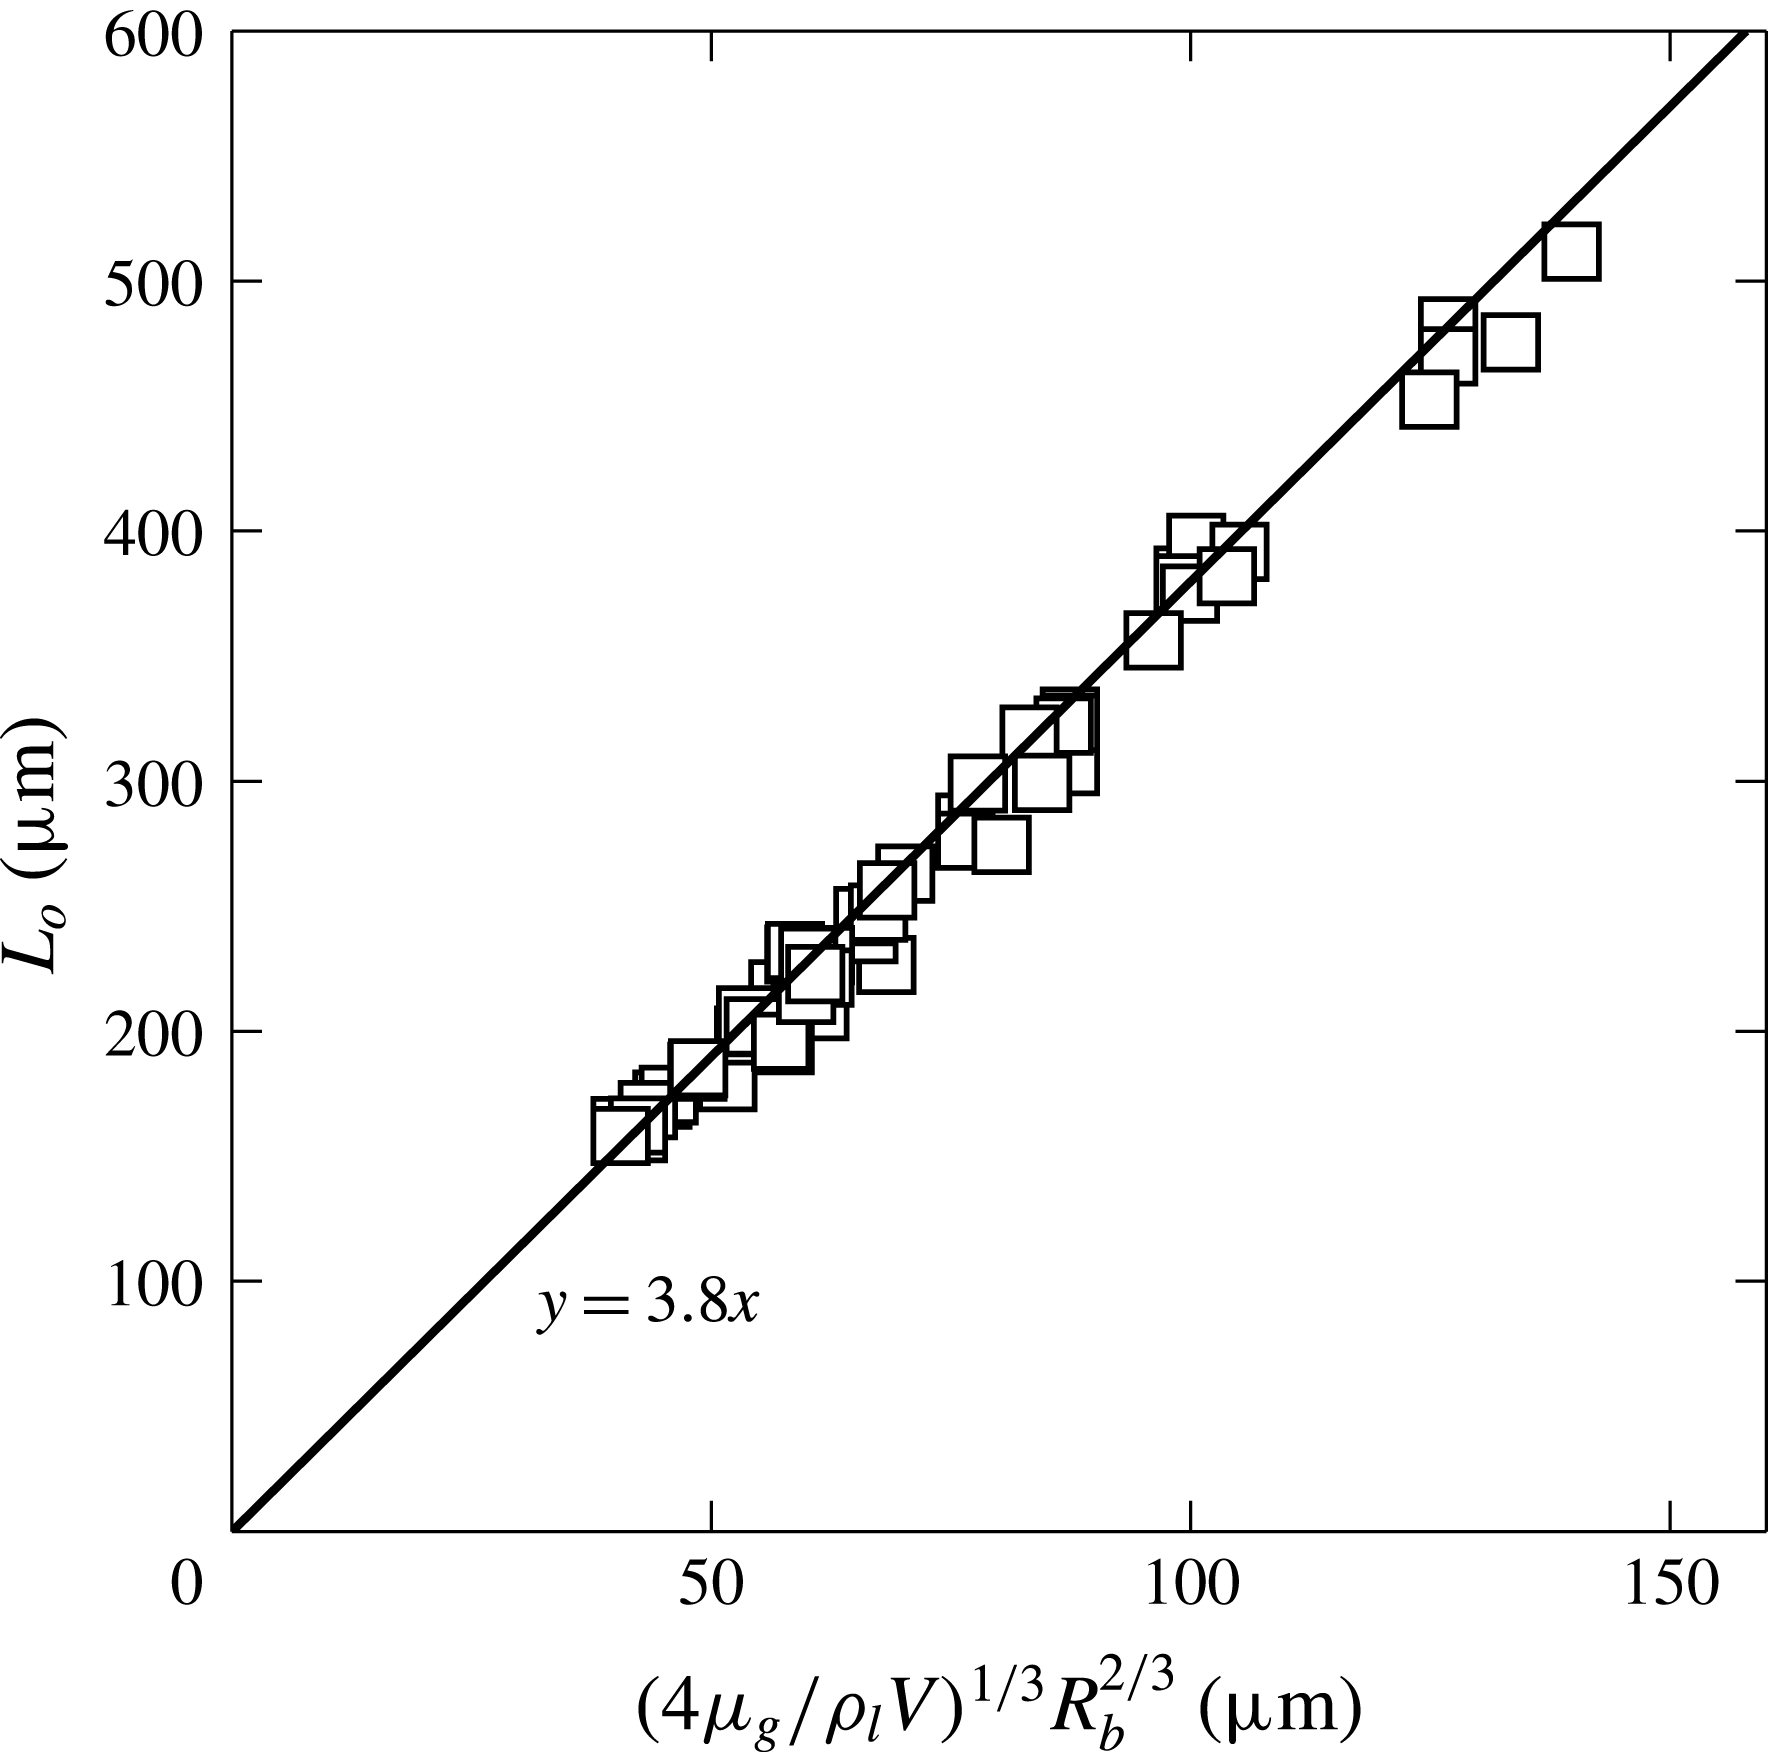
 $$\begin{eqnarray}L_{o}=3.8\left(\frac{4{\it\mu}_{g}}{{\it\rho}_{l}V}\right)^{1/3}R_{b}^{2/3}.\end{eqnarray}$$
Hicks et al. (Reference Hicks, Ermanyuk, Gavrilov and Purvis2012) showed this to be in reasonable agreement with impacting solid spheres and the available droplet data of Thoroddsen et al. (Reference Thoroddsen, Etoh, Takehara, Ootsuka and Hatsuki2005), without any adjustable constants. However, while their compressible theory (Hicks & Purvis Reference Hicks and Purvis2013) is limited to 2-D, they have also shown that
 $L_{o}$
is not dependent on the gas compressibility. This is indeed born out by our data, in figure 5, which shows a perfect fit of
 $L_{o}$
to their expression, over a large range of impact values. This contradicts earlier results by Liu et al. (Reference Liu, Tan and Xu2013), where smaller water drops were used and
 $L_{o}$
was essentially independent of
 $V$
.
Hicks & Purvis (Reference Hicks and Purvis2013) mention that the adiabatic case of Mandre et al. (Reference Mandre, Mani and Brenner2009) predicts that
 $L_{o}$
should decrease when
 ${\it\epsilon}^{-1}$
increases, where
 ${\it\epsilon}$
is the compressibility factor, defined below. Teasing out these subtle differences will require future experiments at reduced pressure.
The size of the initial air disc, measured at first contact with the wall, versus (3.3), which is based on the theory of Hicks et al. (Reference Hicks, Ermanyuk, Gavrilov and Purvis2012).
 $R_{b}$
is the bottom radius of curvature of the drop.
3.3. Thickness of the disc and compression of the gas
Building on previous incompressible theory (Smith et al. Reference Smith, Li and Wu2003; Korobkin et al. Reference Korobkin, Ellis and Smith2008), Mandre et al. (Reference Mandre, Mani and Brenner2009) derived conditions for when compressibility of the gas will come into play for higher impact velocities. This formulation compares the static atmospheric pressure to the lubrication pressure, the ratio of which forms a compressibility factor
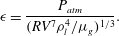 $$\begin{eqnarray}{\it\epsilon}=\frac{P_{atm}}{(RV^{7}{\it\rho}_{l}^{4}/{\it\mu}_{g})^{1/3}}.\end{eqnarray}$$
If
 ${\it\epsilon}^{-1}>3$
one expects significant compression of the air disc and thereby smaller values of
 $H^{\ast }$
. According to Mandre et al. (Reference Mandre, Mani and Brenner2009), when using adiabatic compression, the normalized thinning should scale with the compressibility factor as
 $H^{\ast }/(R_{b}St^{2/3})$
 $=3.2{\it\epsilon}^{1/3}$
. For isothermal compression the power law is different, i.e.
 ${\sim}{\it\epsilon}^{1}$
. Our values of
 ${\it\epsilon}^{-1}$
reach
 ${\sim}40$
for the large impact velocities
 $V$
and large bottom radii of curvature
 $R_{b}$
, which takes us well into the compressible regime.
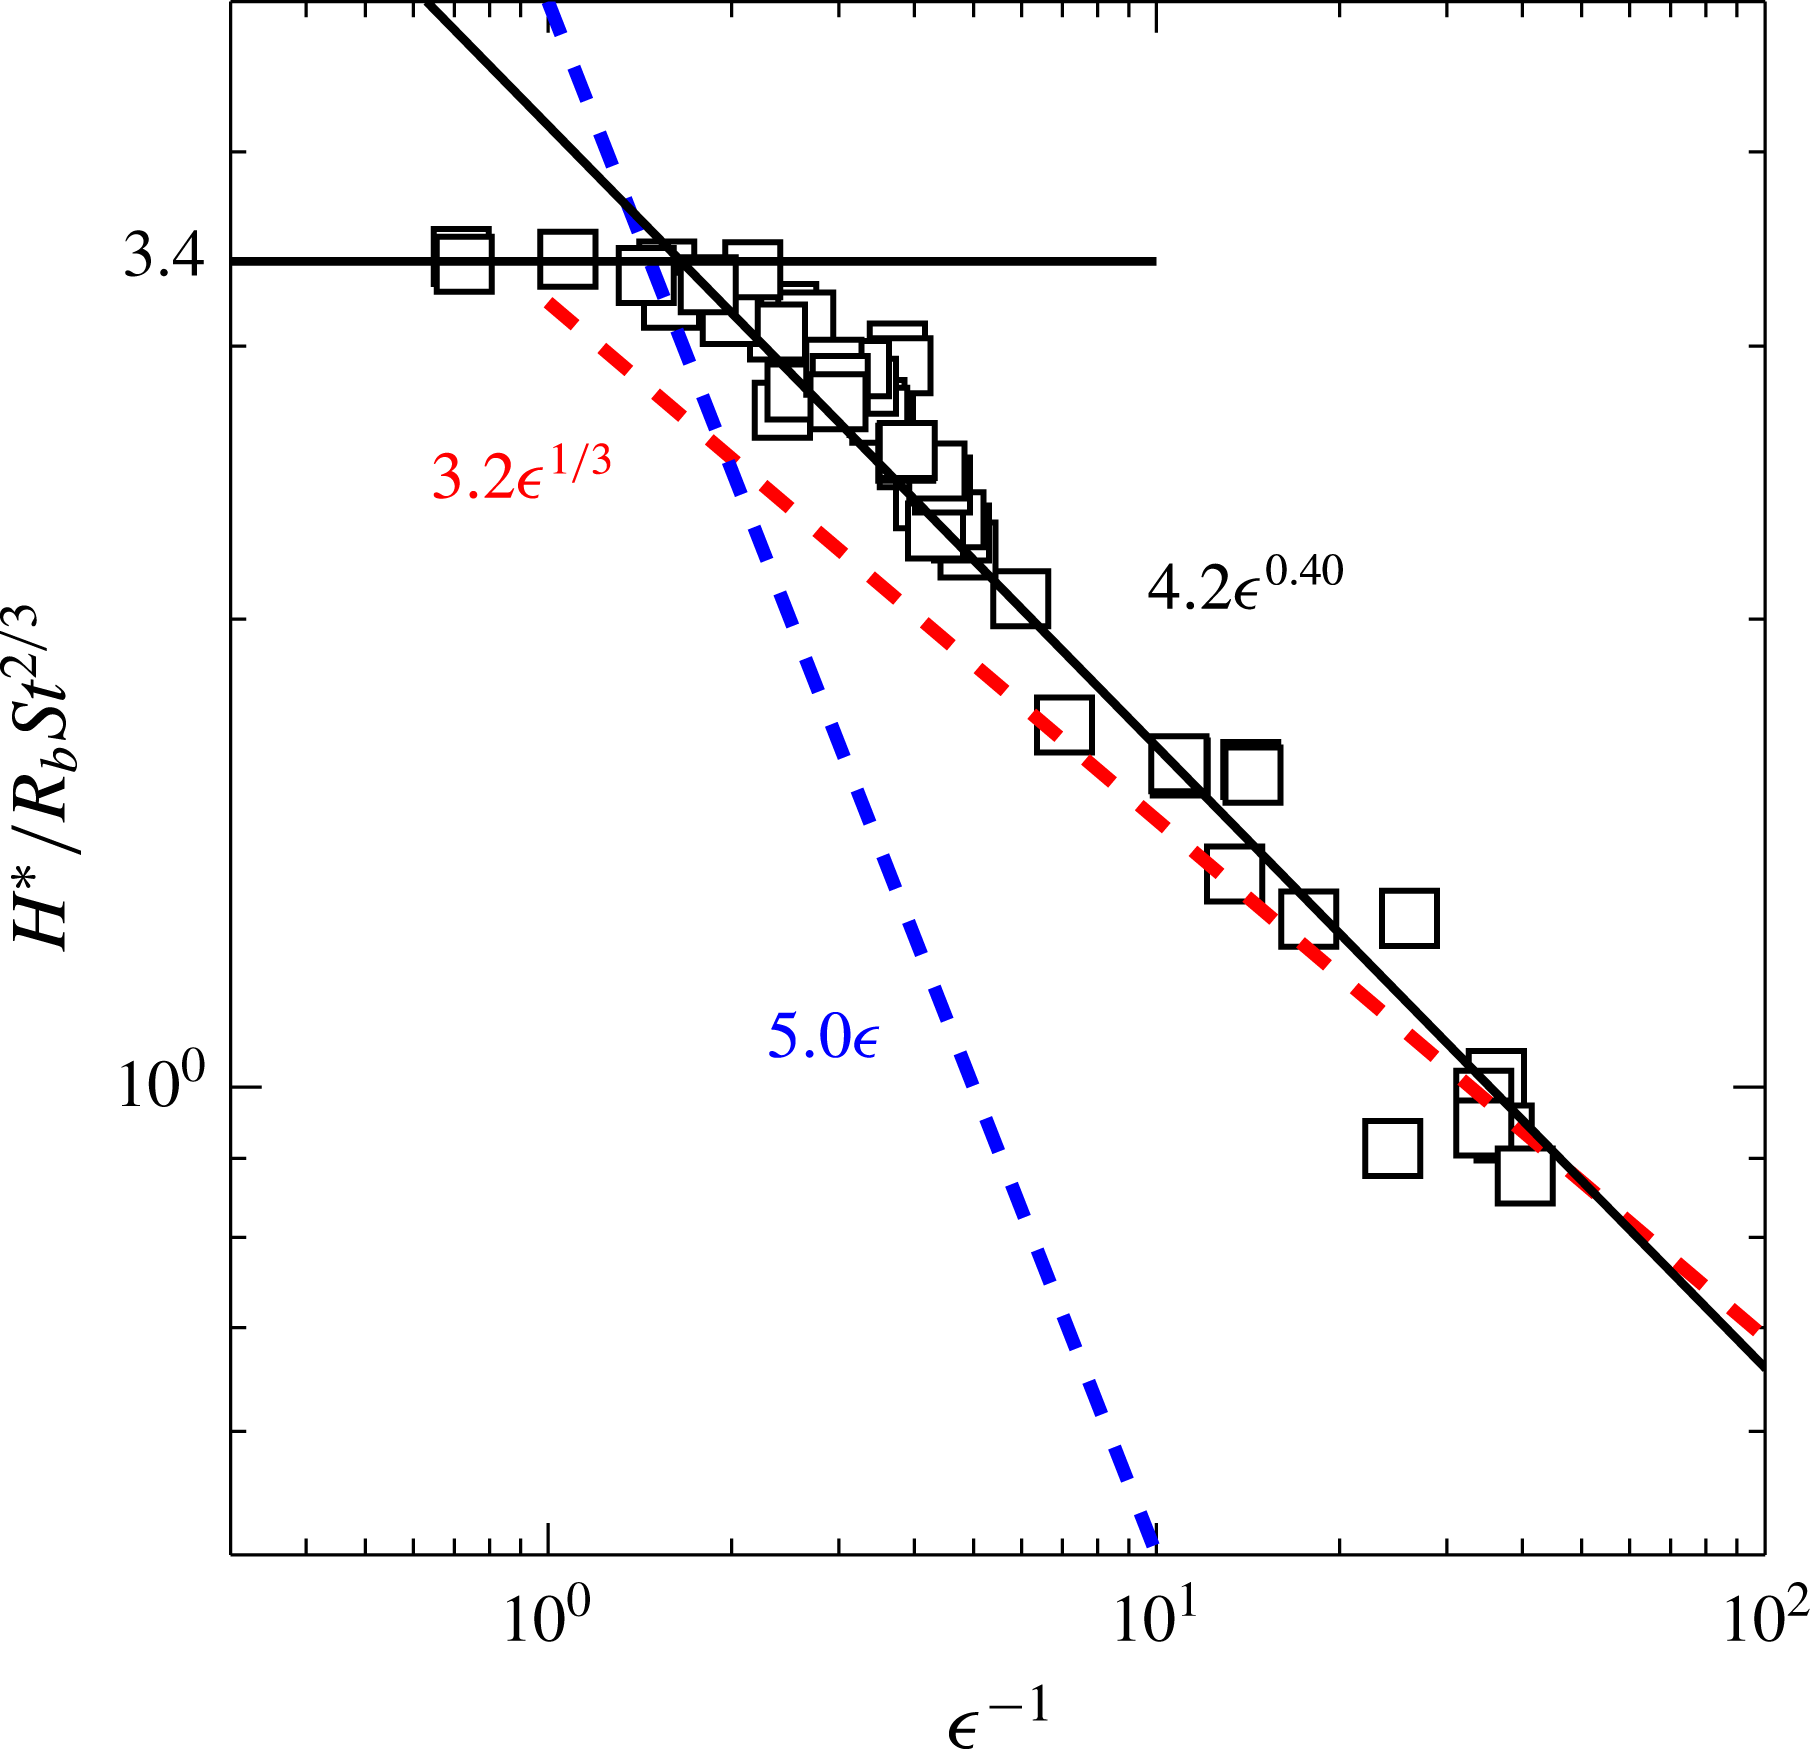
In figure 6 we plot the air-layer height at the centreline
 $h=H^{\ast }$
, at the instant of first contact. Note that our definition of
 $H^{\ast }$
, taken at first contact, differs from that used in Smith et al. (Reference Smith, Li and Wu2003) and Mandre et al. (Reference Mandre, Mani and Brenner2009), where they look at
 $H^{\ast }$
at the onset of deformation. The two should only differ by a small factor, but our definition is much easier to quantify experimentally. The data fit the theory and numerics of Mandre et al. (Reference Mandre, Mani and Brenner2009) reasonably closely, when we use their adiabatic case,
 ${\it\gamma}=1.4$
(see their figure 2). Our incompressible asymptote is at 3.4 versus 4.3 in their 2-D case. Our measurements show that the thinning of the air layer, as compressibility sets in, follows an empirical power law of
 $4.2{\it\epsilon}^{0.40}$
. This mirrors closely their numerical results when using the ratio of specific heats
 ${\it\gamma}=1.4$
, for an adiabatic process, where they see essentially the same exponent of 0.40. This is significantly steeper than their theoretical prediction of an asymptote of
 ${\it\epsilon}^{1/3}$
, which may be realized at much larger
 ${\it\epsilon}^{-1}$
than in our experiments. Here again our prefactor differs from the value of 3.2 observed in their 2-D case. Liu et al. (Reference Liu, Tan and Xu2013) observed a much smaller exponent for their impacts of water drops. Note that our results are far from the isothermal (
 ${\it\gamma}=1$
) power law
 ${\sim}{\it\epsilon}^{1}$
, which is also drawn in the figure.
Selecting the instant of first contact will not show the minimum value of
 $H^{\ast }$
, as figure 3(b,d, f) shows that the height at the centre has rebounded somewhat from its minimum. This is also seen in theoretical studies (Mandre et al.
Reference Mandre, Mani and Brenner2009; Duchemin & Josserand Reference Duchemin and Josserand2011; Hicks & Purvis Reference Hicks and Purvis2013). We estimate the minimum centreline separation for the
 $V=4.05~\text{m}~\text{s}^{-1}$
video (figure 3
d), as being
 $\simeq 480~\text{nm}$
. For the highest impact velocity
 $V\simeq 6~\text{m}~\text{s}^{-1}$
we estimate the minimum height at only one dark and one bright fringe, using top lighting, i.e.
 $H^{\ast }\simeq 320~\text{nm}$
.
The air-film thickness at the centreline, measured at the instant of contact along the outer ring, versus the compressibility parameter in (3.4). Compared to the theory of Mandre et al. (Reference Mandre, Mani and Brenner2009) for isothermal conditions (
 ${\it\gamma}=1$
) (blue dashed line) and for adiabatic conditions (
 ${\it\gamma}=1.4$
) (red dashed line).
Immediately following the contact, the trapped air disc undergoes a rapid expansion, see figure 3(c,d). For
 $V=2.43~\text{m}~\text{s}^{-1}$
the height at the centre has risen by a factor of
 ${\sim}2$
in
 $5.6~{\rm\mu}\text{s}$
after first contact, while for
 $V=4.05~\text{m}~\text{s}^{-1}$
it has grown by a factor of 3 in only
 $2.2~{\rm\mu}\text{s}$
. This highlights the importance of our rapid imaging, to catch the detailed dynamics. At the end of this expansion, we see some overshoot and slight oscillations. For
 $V=2.43~\text{m}~\text{s}^{-1}$
, in figure 3(c), the time from first contact to first maximum is
 ${\rm\Delta}T=5.6~{\rm\mu}\text{s}$
, while the duration until the subsequent expansion maximum after the last curve in figure 3(c) is
 ${\rm\Delta}T=15.6~{\rm\mu}\text{s}$
. For the highest impact velocity (
 $V=6.0~\text{m}~\text{s}^{-1}$
) the expansion is faster and we can observe more oscillation cycles, with each subsequent expansion cycle to subsequent maxima, taking longer, i.e.
 ${\rm\Delta}T=0.4$
, 3.4, 4.4 and
 $5.2~{\rm\mu}\text{s}$
.
Compression of the air disc versus the impact parameter in (3.4). The compression of the air disc at the first contact along the ring (▫) and after the first vertical expansion at the centreline (▵).
 ${\it\Omega}_{disc}$
comes from integrating the thickness profile from the interferometry, whereas
 ${\it\Omega}_{b}$
is the volume of the final bubble, left behind after the contraction of the air disc.
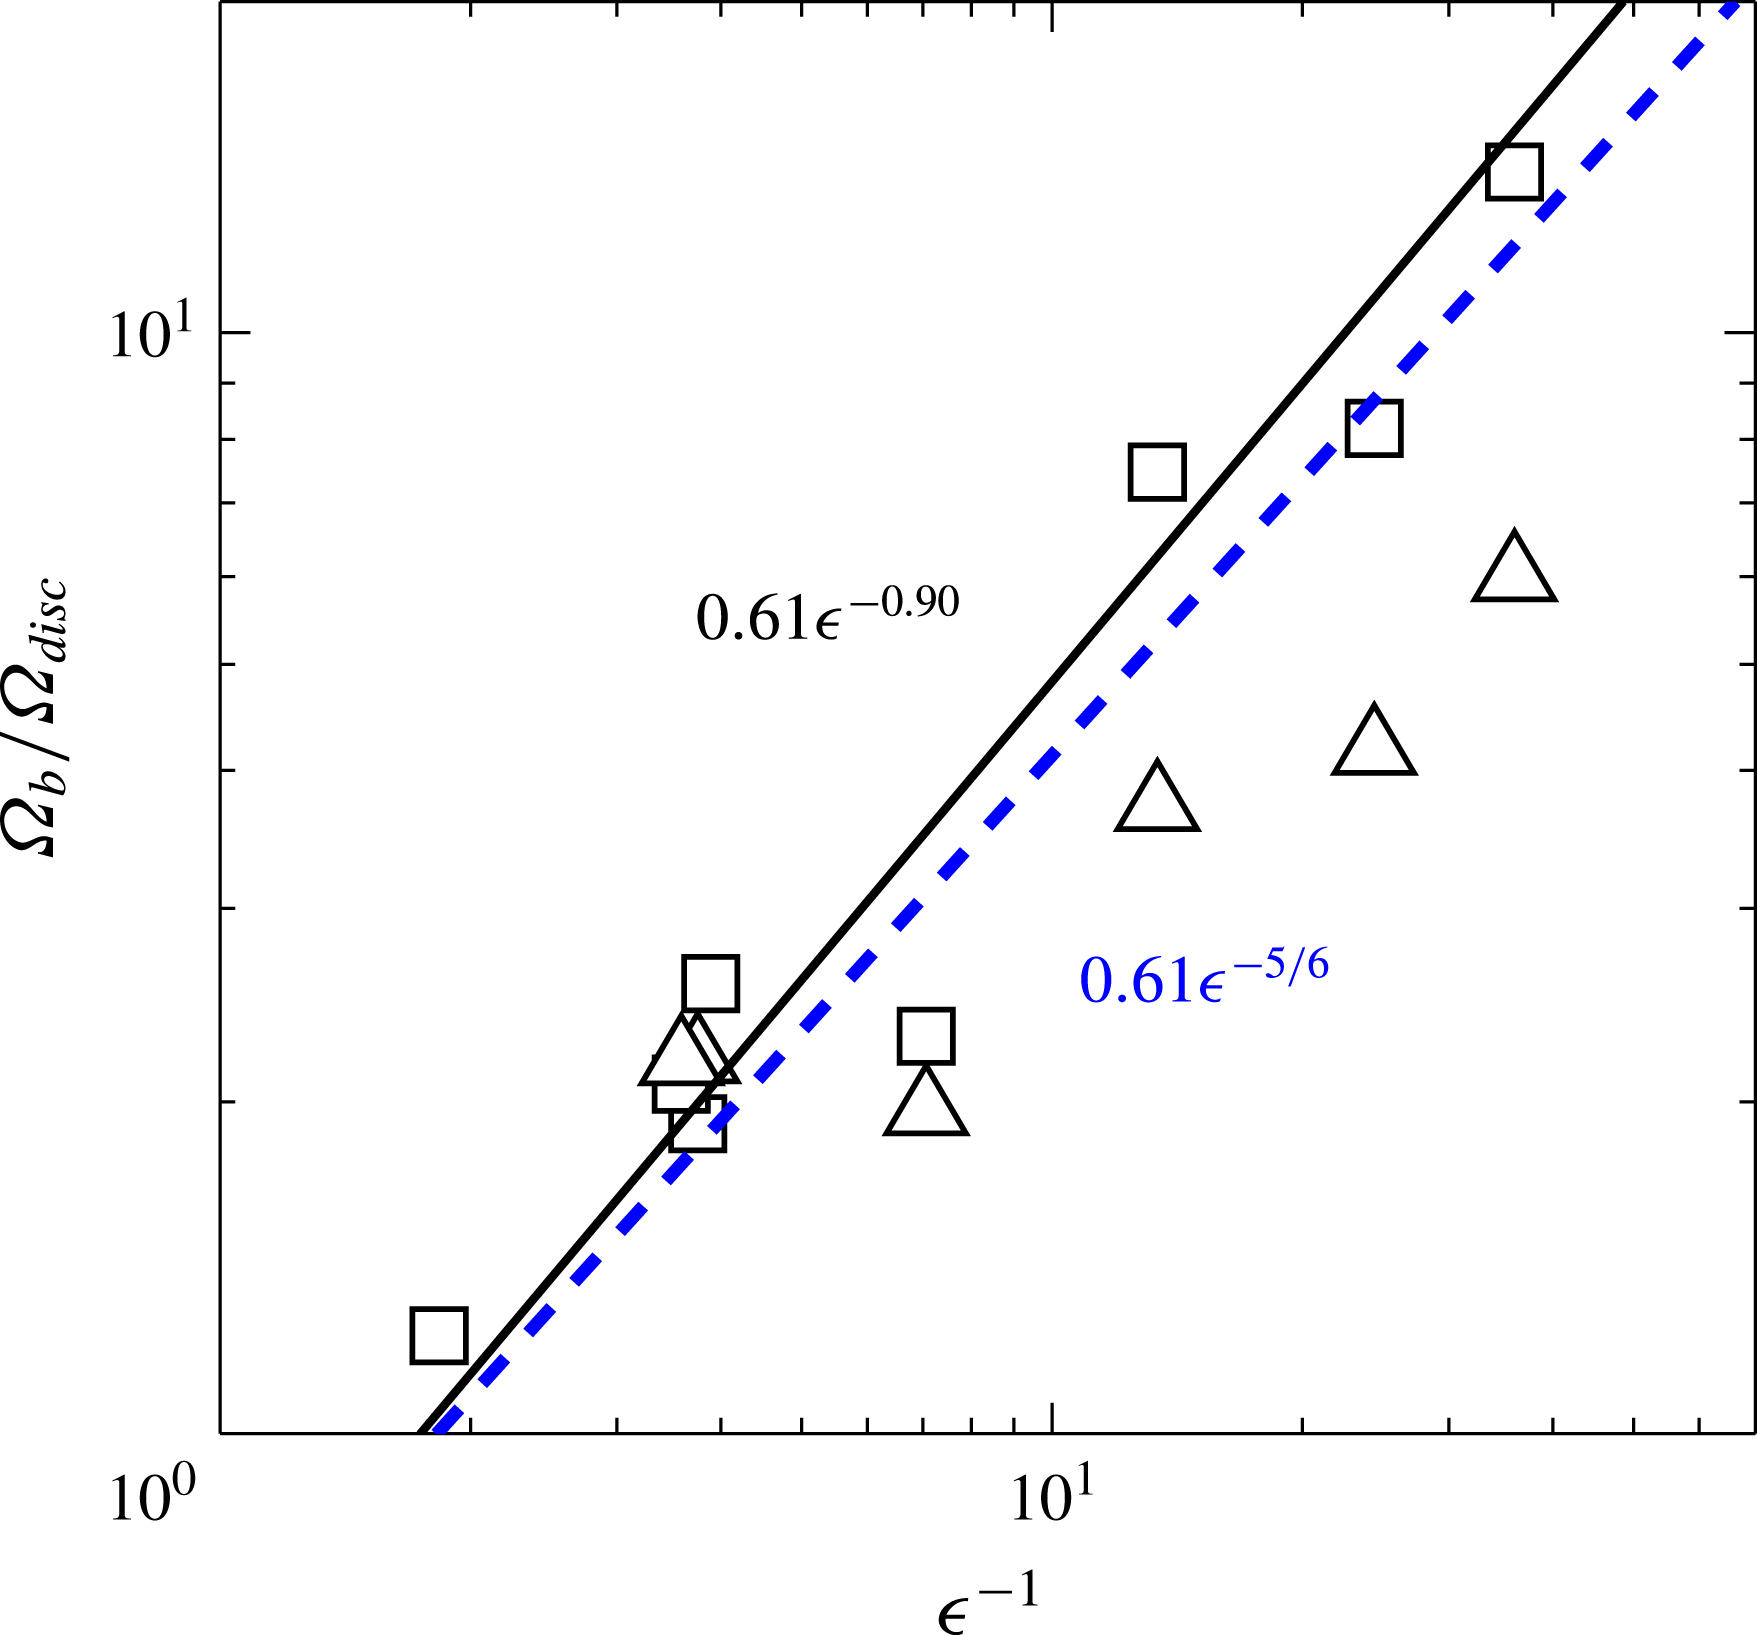
We integrate the air volume at first entrapment and after the maximum early expansion, from the video frames. This can be compared to the theory of Mandre et al. (Reference Mandre, Mani and Brenner2009), which gives the air-film thickness at the start of compression as
 $H_{c}\sim R({\it\mu}_{g}V/(RP_{0}))^{1/2}=R\,St^{2/3}{\it\epsilon}^{-1/2}$
and maximal compression at
 $H_{min}\sim R\,St^{2/3}{\it\epsilon}^{(2-{\it\gamma})/(2{\it\gamma}-1)}=R\,St^{2/3}{\it\epsilon}^{1/3}$
, for
 ${\it\gamma}=1.4$
;
 $P_{0}$
is the ambient pressure. The ratio of these two gives the volume compression
 ${\it\Omega}_{b}/{\it\Omega}_{disc}\sim {\it\epsilon}^{-5/6}$
, or incorporating our experimentally obtained empirical result
 $H^{\ast }\sim {\it\epsilon}^{0.40}$
we get a slightly different power law
 ${\it\Omega}_{b}/{\it\Omega}_{disc}\sim {\it\epsilon}^{-0.9}$
. Figure 7 shows reasonable correspondence with this theory, with the ratio growing as large as a factor of 5 (▵) for the largest
 $V$
. However, comparing this expanded air volume to that contained in the final spherical bubble detached from the surface, additional volume increase is observed (▫ in figure 7). This was also observed by Liu et al. (Reference Liu, Tan and Xu2013), but their lower frame rate could not catch the earliest part of the expansion. With
 $\text{d}t=7~{\rm\mu}\text{s}$
their images are essentially snapshots of the earliest evolution. We propose that the conical air disc is still subject to significant dynamic pressure, due to the ongoing impact so soon after first contact. This pressure is released later as the disc pulls into a bubble, further increasing the volume ratios. We observe a total compression as large as a factor of 14 for the largest
 $V$
.
The very large pressure produced just prior to the first contact could potentially deform the solid locally. To probe possible effects on the air disc, we conducted a few separate experiments using a much thinner,
 $150~{\rm\mu}\text{m}$
-thick, glass slide (Menzel-Deckglacer), seeing no change in the thickness of the entrapped air disc.
4. Discussion and conclusions
Herein we have used the latest high-speed video technology for time-resolved interferometry to measure the lubricating air layer under an impacting drop, for higher velocities than previously possible. We have thereby characterized the dynamics well into the regime where the gas compressibility is significant. The results are overall in good agreement with theoretical models based on the lubricating air layer and inviscid drop dynamics (Mandre et al.
Reference Mandre, Mani and Brenner2009; Hicks & Purvis Reference Hicks and Purvis2010; Mandre & Brenner Reference Mandre and Brenner2012). Our result for the size of the air disc
 $L_{o}$
shows a perfect fit to the expression from Hicks & Purvis (Reference Hicks and Purvis2010), without any adjustable constants.
Furthermore, our measurements of the air-layer thickness shed new light on the thermodynamics of the gas. The compression and entrapment of the air disc occurs very rapidly and one can thereby expect non-equilibrium thermodynamics within the gas. Mandre et al. (Reference Mandre, Mani and Brenner2009) and Mani et al. (Reference Mani, Mandre and Brenner2010) used the ideal-gas equation of state,
 $$\begin{eqnarray}\displaystyle p=P_{0}\left(\frac{{\it\rho}}{{\it\rho}_{0}}\right)^{{\it\gamma}}, & & \displaystyle\end{eqnarray}$$
to model the compression of the gas, where
 $p$
is the gas pressure,
 ${\it\rho}$
is the gas density,
 $P_{0}$
is the ambient pressure of the gas at density
 ${\it\rho}_{0}$
. The value of
 ${\it\gamma}$
is chosen to be 1.4 for adiabatic, or 1 for isothermal, gas compression. Later, Mandre & Brenner (Reference Mandre and Brenner2012) argued that for highly thermally conducting substrates like metal or glass, the solid has a much larger thermal capacity than the gas layer and the time scale of the impact is larger than that required for the gas temperature to become uniform. Therefore, one should use
 ${\it\gamma}=1$
. Liu et al. (Reference Liu, Tan and Xu2013) also argued for the use of the isothermal (
 ${\it\gamma}=1$
) value in their study, estimating a typical conduction time of 30 ns, for atmospheric gas density. We suggest that greatly increased gas density during the compression may increase this time significantly.
On the other hand, Hicks & Purvis (Reference Hicks and Purvis2013) conducted a full thermodynamics analysis of the energy conservation in the gas and found that ‘the previous use of either an isothermal or an adiabatic equation of state is inappropriate in this regime’. Hicks & Purvis (Reference Hicks and Purvis2013) demonstrated large differences in the temperature profiles and in the density profiles at touchdown, between their compressible model and the earlier isothermal or adiabatic theories. They also showed another key difference between their compressible model and the earlier adiabatic case, i.e. the initial radius of the air pocket (
 $L_{o}$
in our study) is independent of the compressibility in their full analysis, while they explain that
 $L_{o}$
will decrease as compressibility rises in the adiabatic case, as implied by Mandre et al. (Reference Mandre, Mani and Brenner2009).
Our comparison of the measured thickness of the air layer with the theory of Mandre et al. (Reference Mandre, Mani and Brenner2009) shows that in the context of their simplified thermodynamic model, the adiabatic dynamics (
 ${\it\gamma}=1.4$
) gives a much better fit than the isothermal dynamics, where the power law should be much steeper, with an exponent of 1. We find empirically that the best fit is
 $H^{\ast }=4.2{\it\epsilon}^{0.40}$
, with a steeper exponent than the theoretical prediction of
 $1/3$
in Mandre et al. (Reference Mandre, Mani and Brenner2009). To test these power laws at even larger values of the dynamic compression
 ${\it\epsilon}^{-1}$
will require future experiments at reduced ambient pressures.
Experiments at even higher impact velocities than presented herein would be of interest, but are challenging. This is especially true at the largest optical magnifications, owing to the random lateral drift of the centre of the drop, which over a 2 m free-fall is much larger than the 1 mm-wide field of view of the camera. For the largest impact heights, we need dozens of trials to catch any part of the disc, even for a reduced magnification of
 $2~{\rm\mu}\text{m}~\text{pixel}^{-1}$
.
The leap in video frame rate and pixel numbers of the camera used in our study (Crooks et al.
Reference Crooks, Marsh, Turchetta, Taylor, Chan, Lahav and Fenigstein2013) opens many other aspects of the drop impact to future detailed scrutiny. This includes the effects of reduced air pressure, Xu, Zhang & Nagel (Reference Xu, Zhang and Nagel2005), or surface roughness, Latka et al. (Reference Latka, Strandburg-Peshkin, Driscoll, Stevens and Nagel2012). For example, for our drops of
 $D=2.6~\text{mm}$
, impacting at
 $V=2.5~\text{m}~\text{s}^{-1}$
, Mandre & Brenner (Reference Mandre and Brenner2012) suggest that the air film can stay intact and the drop skate on it, if the surface roughness is smaller than 10 nm. This technique is also ideal to study the breakup of the levitated films at the outer edge of the lamella, see Driscoll, Stevens & Nagel (Reference Driscoll, Stevens and Nagel2010) and Thoroddsen, Takehara & Etoh (Reference Thoroddsen, Takehara and Etoh2010).
Acknowledgement
Research reported in this publication was supported by funding from King Abdullah University of Science and Technology (KAUST). We acknowledge anonymous referees for helpful suggestions.
Supplementary movies
Supplementary movies are available at http://dx.doi.org/10.1017/jfm.2015.466.



