Recent developments in new photonic materials and structures for photovoltaics motivate a strategy for future photovoltaics development, both for the near-term and also the long-term, that can enable terawatt-scale photovoltaic deployment. The near-term assessment will focus on promising approaches now emerging from the lab or at the early commercial stage. These approaches can accelerate the subsidy-free penetration of photovoltaics to achieve substantial U.S. electricity generation by 2030. The longer-term assessment requires a significant rethinking of the materials and components for solar energy conversion. These approaches include the rapidly developing science of new light-management structures for solar energy conversion, as well as candidate new materials for photovoltaics.
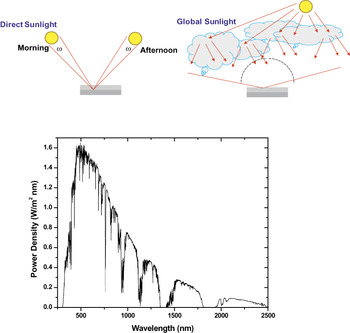
Considerable scientific effort has been devoted in recent years to understanding the absorption, propagation, nonlinear interactions, localization, and dispersion of light in complex optical structures, such as photonic crystals,Reference Yablonovitch1 photonic bandgap media,Reference Joannopoulos, Johnson, Winn and Meade2 plasmonic materials,Reference Atwater3 and metamaterials.Reference Smith, Pendry and Wiltshire4 Likewise, over four decades, enormous effort has been devoted to photovoltaic and other light-energy conversion devices, and also in the realm of communications technology, to the study of optoelectronic devices such as lasers, waveguides, electro-optic devices, and photodetectors. However, to date, there has been remarkably little interplay between any of these fields. We are now at a moment when insights about the flow of light in materials can be harnessed to precisely and efficiently guide optical energy to nanostructured absorbers, enabling revolutionary advances in photovoltaic energy conversion and photoelectrochemical fuel synthesis from sunlight. Previously, photonic materials have been designed for applications such as optical communication where highly collimated, polarized, monochromatic, coherent light sources are utilized so that component designs can exploit these aspects of the light source. By contrast, the solar spectrum is blackbody-like, unpolarized, and sunlight has a variable angle of incidence for both global and direct illumination conditions, as illustrated in Figure 1. Therefore photonic materials for solar energy conversion must be able to accept a wide range of incidence angles and must be useful over a broad range of wavelengths. For photovoltaics, this wavelength range usually corresponds to the absorption characteristics of the absorbing semiconductor material.
The solar spectrum is blackbody-like, solar photons are unpolarized, and sunlight has a variable angle of incidence (ω) for both global and direct illumination conditions. Therefore photonic materials for solar energy conversion must be able to accept a wide range of incidence angles and must be useful over a broad range of wavelengths.

Light trapping beyond conventional limits in thin-film plasmonic solar cells
Since 2001, there has been an explosive growth of scientific interest in the role of surface plasmons in optical phenomena, including guided-wave propagation and imaging at the subwavelength scale, nonlinear spectroscopy, and “negative index” metamaterials. The unusual dispersion properties of metals enable excitation of propagating surface plasmon modes both near and away from the plasmon resonance. At frequencies near the plasmon resonance frequency, the excited localized resonant modes in nanostructures access a very large range of wave vectors over the visible and near infrared frequency range. Both resonant and nonresonant plasmon excitation allow for light localization in ultrasmall volumes in metallodielectric structures.
Only recently has systematic thought been given to the question of how plasmon excitation and light localization might be exploited to advantage in high-efficiency photovoltaics.Reference Atwater and Polman5 Conventionally, photovoltaic absorbers must be optically “thick” to enable nearly complete light absorption and photocarrier current collection. They are usually semiconductors whose thickness is typically several times the optical absorption length. Thus solar cell design and material synthesis considerations are strongly dictated by this simple optical thickness requirement.
Dramatically reducing the absorber layer thickness could significantly expand the range and quality of absorber materials that are suitable for photovoltaic devices by enabling efficient photocarrier collection across short distances in low-dimensional structures such as quantum dots or quantum wells, and also in polycrystalline thin semiconductor films with very low minority carrier diffusion lengths. An interesting feature of plasmonic structures is that they are metallic and thus can be used as a conducting contact to a photovoltaic absorber layer. One could design metallic contacts whose plasmon resonant spectral absorption features are well-matched to the photovoltaic absorber properties, rendering metallic contacts more transparent at photon frequencies at or above the bandgap for strong absorbers by designing the plasmon resonance frequency to lie below the bandgap frequency. Incident sunlight can be converted into propagating guided modes that enable efficient light absorption in extremely thin (10s–100s of nanometers thick) photovoltaic absorber layers.
Since the seminal statistical ray optics theory by Yablonovitch in 1982 on light trapping in solar cells,Reference Yablonovitch and Cody6 it has been widely believed in the photovoltaics community that the optimal structure for light trapping in solar cells consists of a sheet-like or film absorber with a randomly textured surface. Indeed, this general “random surface texture is best” approach has been widely used in solar cell design. Notably, thin-film solar cells, such as those whose active material is amorphous silicon, are deposited on a randomly textured reflector layer, such as a Ag/ZnO-coated Asahi U (a type of transparent conductive oxide) glass surface, to enhance light trapping. Recently several groups have developed a new type of ultrathin amorphous silicon solar cell that utilizes a different type of light trapping structure consisting of an engineered plasmonic back reflector.Reference Derkacs, Lim, Matheu, Mar and Yu7–Reference Biswas, Zhou, Curtin, Chakravarty and Dalal10 For the first time, it was recently demonstrated that an engineered nanopatterned back reflector can show better light trapping performance than the randomly textured substrate conventionally used for light trapping. This and related findings have reopened the field of light trapping in thin-film solar cells, and will guide research toward optimal nonrandom plasmonic light-trapping structures.
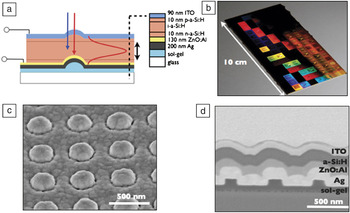
An example is the thin-film amorphous silicon solar cell fabricated using periodically engineered textured back reflectors, shown in Figure 2. This example demonstrates efficiency enhancements due to light trapping that exceed the light-trapping enhancements for randomly textured thin film silicon solar cells. These cells exhibited a 6.6% efficiency with a 500 nm pitch pattern and are one of the first examples of patterned plasmonic scatterers showing absorption enhancement superior to traditional light-trapping techniques. Light is preferentially coupled into waveguide modes of the ultrathin (160 nm) semiconductor active layer of the cell, enhancing the absorption of light that would otherwise reflect from the cell. The nanopatterns are fabricated via an inexpensive and scalable nanoimprint lithography technique that can be adopted into standard solar cell production, such as roll-to-roll methods.
Plasmonic light trapping amorphous Si (a-Si) solar cell design. (a) Schematic cross section of the patterned solar cell. Patterns are made on the rear glass substrate, and there is conformal deposition of all layers over the patterns through the top indium tin oxide contact. Incident blue and red arrows indicate that blue light is absorbed before reaching the back contact, while red light interacts more with the back patterns. (b) Photograph of finished imprinted patterned solar cell substrate. Each colored square is a separate device, with different particle diameter and pitch. (c) Scanning electron microscopy (SEM) of Ag overcoated patterns showing 290 nm diameter particles with 500 nm pitch. (d) SEM image of a cross section of a fabricated cell, cut using focused ion-beam milling. Note that the ultrathin a-Si:H layer constitutes only a small part of the cell.

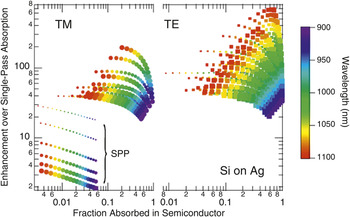
Theoretical models have recently been developed to assess the achievable absorption enhancements in waveguide-based cells with plasmonic scatterers and suggest that over certain wavelength regimes and for specific design conditions, the optical path length and absorption enhancements in thin-film cells can exceed the predicted maximum path length enhancement of 4n 2, where n is the refractive index, for randomly textured cells in the ray-optics limit, as illustrated in Figure 3.Reference Saeta, Ferry, Pacifici, Munday and Atwater11 The so-called “ergodic” limit assumes a randomly textured surface such that scattering is random, and all possible ray optical modes are excited and are based on a detailed balance of light absorption and light emission. By viewing a set of somewhat idealized plasmonic structures as an array of sequential dipole-like point scatterers embedded in the active layer of a metal-backed solar cell, the path length is enhanced by coupling to waveguide modes of the structure. While this type of analytic approach makes approximations by assuming lossless dipoles and incoherent scattering over the whole structure, it yields useful insights about light trapping from nanostructured ridges on a metallic back contact. Through systematic study of the waveguide modes and their respective absorption overlap with the semiconductor, it is possible to specify positions and spacings of dipoles that allow for path length enhancements exceeding 4n 2. Plasmonic light-trapping structures enhance absorption both for relatively weak absorbers (such as crystalline Si) and for strong direct bandgap absorbers (such as a-Si:H, amorphous Si, and GaAs) near their respective band edges.
Absorption enhancement η in a silicon layer on silver compared to a single pass at normal incidence for transverse magnetic (TM) modes (left panel) and transverse electric (TE) modes (right panel) as a function of the fraction of energy absorbed in the silicon layer. The marker size shows the thickness of the silicon layer from 100 to 1000 nm, and color indicates the wavelength. The surface plasmon polariton (SPP) mode shows significantly smaller enhancement than other modes, decreasing with increasing layer thickness. For the photonic modes, the absorption enhancement tends to rise with layer thickness. Note that the calculation here assumes that light does not scatter out of the mode.Reference Saeta, Ferry, Pacifici, Munday and Atwater11

Light trapping in wire array solar cells
Si wire arrays are a promising architecture for solar-energy-harvesting applications and may offer a flexible alternative to Si wafers for photovoltaics.Reference Kayes, Atwater and Lewis12–Reference Peng, Xu, Wu, Yan, Lee and Zhu18 To achieve competitive conversion efficiencies, the wires must absorb sunlight over a broad range of wavelengths and incidence angles, despite occupying only a modest fraction of the array’s volume. It has recently been shown that arrays having less than 5% areal fraction of wires can achieve up to 96% peak absorption, and they can absorb up to 85% of day-integrated, above-bandgap direct sunlight.Reference Kelzenberg, Boettcher, Petykiewicz, Turner-Evans, Putnam, Warren, Spurgeon, Briggs, Lewis and Atwater19 In fact, they exhibit enhanced near-infrared absorption that allows their overall sunlight absorption to exceed the ray-optics light-trapping absorption limitReference Kelzenberg, Boettcher, Petykiewicz, Turner-Evans, Putnam, Warren, Spurgeon, Briggs, Lewis and Atwater19 for an equivalent volume of randomly textured planar Si over a broad range of incidence angles. We furthermore demonstrated that the light absorbed by Si wire arrays can be collected with a peak external quantum efficiency of 0.89, and that they exhibit broadband, near-unity internal quantum efficiency for carrier collection via a radial semiconductor/liquid junction at the surface of each wire. The observed absorption enhancement and collection efficiency enable a cell geometry that not only utilizes 1% to 5% of the silicon material of traditional wafer-based devices, but also may offer increased photovoltaic efficiency due to an effective optical concentration of up to ~20×. Arrays of Si wires can be grown on commonly available (e.g., glass or re-usable) substrates using the vapor-liquid-solid (VLS) growth process.Reference Wagner and Ellis20 Wire array solar cells grown by the VLS process have demonstrated up to 7.9% conversion efficiency.Reference Biswas, Zhou, Curtin, Chakravarty and Dalal10, Reference Putnam, Boettcher, Kelzenberg, Turner-Evans, Spurgeon, Warren, Briggs, Lewis and Atwater21 Si nanowire arrays also have been shown to have beneficial optical absorption properties for photovoltaic applications, due to the sub-wavelength scale of the wires.Reference Smith, Pendry and Wiltshire4–Reference Garnett and Yang13
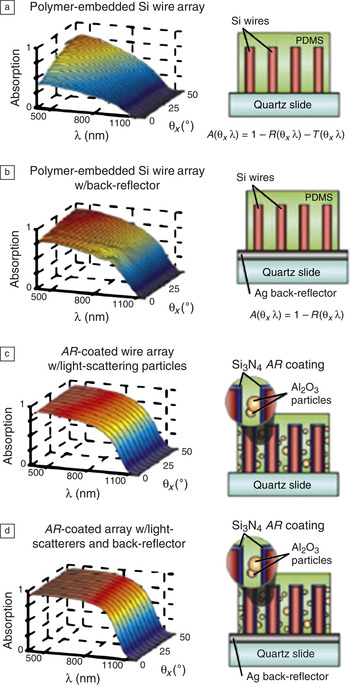
Figure 4 demonstrates the light-trapping techniques that were employed to maximize the absorption of a square-tiled array of 67-μm-long Si wires. With an areal packing fraction of ηf = 4.2%, this array contained the same volume of Si as a 2.8 μm-thick Si film. As expected, its peak absorption was relatively low at normal incidence (< 0.5) and increased at steeper angles of incidence (Figure 4a). The wire array was then placed on a mirror-like Ag back-reflector (Figure 4b) to emulate a metal back contact to a prototypical wire array solar cell, as well as to increase the optical path length within the array. Although this step substantially increased the absorption of the array (approaching peak normal-incidence values of 0.8), the normal-incidence absorption remained significantly weaker than that at off-normal-incidence angles. To further improve absorption, two additional light-trapping measures were implemented on a different portion of the wire array. Prior to being embedded in polydimethlysiloxane (PDMS), a SiNx AR (antireflection)-coating (80 nm nominal thickness) was conformally deposited onto the tops and sides of these wires (Figure 4c–d). Additionally, Al2O3 particles (0.9 μm nominal diameter) were added to the PDMS infill to scatter the light that might otherwise pass between the wires. We note that PDMS and alumina are materials chosen because they have negligible absorption across wavelengths spanning the range.
(a,b) Measured absorption and schematic of a Si wire array with 4.2% area fraction on a quartz slide (a) and on a Ag back-reflector (b). (c,d) Measured absorption and schematic of the same array as in (a,b) with an antireflective coating and embedded light-scatterers, measured on a quartz slide (c) and on a Ag back-reflector (d). PDMS, polydimethlysiloxane.

Optical metamaterials
Metamaterials are artificial materials that exhibit extraordinary electromagnetic properties not observed in their constituent materials. In resonant element–based metamaterials, an unusual “left-handed” behavior of light can form subwavelength resonant elements that behave like “artificial-atoms,” with an engineered diamagnetic resonance that gives rise to a negative permeability and thus to an effective negative index. Negative refraction was first demonstrated experimentally in arrays of millimeter-sized copper strips and split-ring resonators operating at microwave frequencies.Reference Smith, Padilla, Vier, Nemat-Nasser and Schultz22 This discovery sparked a considerable effort to scale down the size of constituent resonant components to enable operation at higher frequencies. For example, micrometer-sized structures were successfully fabricated, giving rise to a negative refractive index at THz frequencies. However, the operation of functional negative index materials (NIMs) so far has been limited to frequencies ranging from the microwave regime to the near-infrared. For operation at optical frequencies, the typical size of the sub-wavelength scatterers is in the 10–100 nm range, very close to practical fabrication limits. So far, the highest reported operational frequency of NIMs was demonstrated at the deep-red side of the visible spectrum (~780 nm) using structures with features as small as 8 nm. Moreover, to achieve significant scattering from the constituent elements at visible frequencies, the material was built up from a stack of multiple functional layers. This complicates the fabrication of a NIM based on scattering elements in the visible regime.
Recently, a conceptually different approach using waveguides was taken to achieve a negative refractive index in the visible. Investigation of the mode structure of coaxial metal/insulator/metal (MIM) plasmonic waveguides revealed that certain MIM waveguide geometries exhibit a negative index of refraction at visible frequencies. Arrays of negative-index coaxial MIM waveguides can serve as a single-layer, all-angle, quasi three-dimensional metamaterial.Reference Burgos, deWaele, Polman and Atwater23
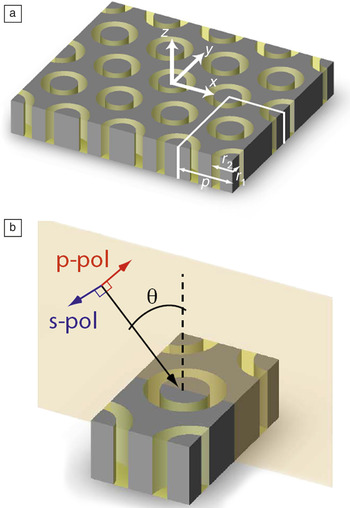
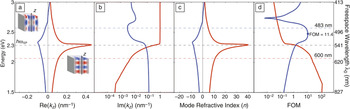
In a coaxial MIM geometry, a structure with a metal core, surrounded by a dielectric cylinder and a metal cladding, is designed (see Figure 5). Calculations for individual coaxial plasmonic MIM waveguides show a negative refractive index, which is relatively insensitive to the angle-of-incidence and polarization due to the cylindrical symmetry. A two-dimensional array of vertically oriented coaxial MIM waveguides arranged in a dense hexagonal configuration can function as a three-dimensional isotropic single-layer negative index material at visible frequencies down to the blue. We have demonstrated that the refractive index of this new geometry is insensitive to both the angle and polarization of incident light. By varying the array pitch, it is shown that wave propagation and index of the metamaterial strongly depend on the coupling strength between waveguides, providing a large degree of tunability of the negative refractive index.
(a) Single-layer negative index metamaterial slab consisting of a hexagonal array of subwavelength coaxial waveguide structures. The inner radius r 1, outer radius r 2, and array pitch p are defined in the image. (b) Unit cell of the periodic structure. The angle-of-incidence (θ) is shown, as well as the in-plane (p-) and out-of-plane (s-) polarization directions associated with the incident wavevector k.

Figure 5a schematically depicts the NIM, consisting of a hexagonal array of Ag/GaP/Ag MIM coaxial waveguides with GaP annular channels separating cylindrical Ag cores from the Ag cladding. Figure 5b shows the unit cell of the periodic metamaterial. We have investigated the metamaterial response both by analytic waveguide modal analysis for single coaxial structures and by using finite-difference time-domain simulations with Bloch boundary conditions, reflecting the material periodicity of the material’s response (Figure 6).
The coaxial waveguide consists of a 25 nm GaP annular channel with a 75 nm inner diameter embedded in Ag. Plotted are the two lowest order linearly polarized modes that most strongly couple to free space radiation. (a–c) Energy is plotted versus (a) β', (b) β", (c) mode index n mode, and (d) the figure-of-merit FOM = β'/β". The Ag/GaP planar surface plasmon energy at 2.3 eV (540 nm) is indicated by the black dashed horizontal line. All panels show one mode with positive index (red curve) and one mode with a negative index (blue curve) below an energy of 2.7 eV (460 nm). The insets in (a) show the Re(Hy) (out-of-page) field distribution in the waveguide at a wavelength of 650 nm for the positive-index mode and at 483 nm for the negative-index mode.Reference Smith, Padilla, Vier, Nemat-Nasser and Schultz22h, reduced Planck’s constant; β', real part of the propagation constant; β", imaginary part of the propagation constant.

Summary
This article has articulated just a few of the many new findings that are emerging in the field of solar energy photonic materials. The design, fabrication, and characterization of complex, heterogeneous three-dimensional photonic materials for solar energy conversion is an enormous and exciting challenge that lies at the intersection of optical physics, chemistry, and materials science. Further advances in interdisciplinary research will rely on the interplay of fundamental insights about the physics of photon-matter interactions, innovative materials synthesis, and recognition of the opportunities for application in future photovoltaic and photoelectrochemical energy conversion.
Harry Atwater is currently the Howard Hughes Professor and the Professor of Applied Physics and Materials Science at the California Institute of Technology. His research interests center around two intertwined research themes—photovoltaics and renewable energy and plasmonics and optical metamaterials. Atwater received his BS (1981), SM (1983), and PhD (1987) in electrical engineering from the Massachusetts Institute of Technology. He currently serves as Director of the DOE Energy Frontier Research Center on Light-Matter Interactions in Solar Energy Conversion and was recently named Director of the Resnick Institute of Science, Energy and Sustainability at Caltech. Atwater can be reached by e-mail at haa@caltech.edu.