At the start of the nineteenth century, British MPs were sovereign. They could start a debate, talk virtually indefinitely, take the floor to speak on any motion and freely interrogate Cabinet ministers. Over the past 200 years, however, MPs have implemented a wide range of restrictions, including procedures to end debates, time limits on speeches, and a speaker with the power to adjourn legislative debates and discipline members. Over the course of the twentieth and twenty-first centuries, the Commons has transformed from a ‘legislative state of nature’ (Cox Reference Cox, Weingast and Wittman2006) to a party-dominated institution in which debate is severely restricted.
As decisions on procedures are made by majority votes, this raises an important puzzle: why do MPs vote to reduce their own power? Three competing perspectives have emerged in the US literature. First, the ‘efficiency’ account of legislative organization argues that, as its workload increases, a parliament adopts restrictive rules in order to deal with the pressures imposed by its busy agenda and increases in membership (for example, Cooper and Young Reference Cooper and Young1989; Jenkins Reference Jenkins1998).Footnote 1 In the UK, authors have suggested that the House of Commons adopts reforms to escape a ‘tragedy of the commons’ when its workload increases (for example, Cox Reference Cox1987, 60–61).
Secondly, ‘partisan’ theories of procedural choice focus on the strength and needs of the majority party. Procedural cartel theory, for example (Cox and McCubbins Reference Cox and McCubbins1993; Cox and McCubbins Reference Cox and McCubbins2005), posits that when parliament is polarized, party members delegate negative agenda powers to their leaders, who then form a procedural cartel with the aim of manipulating the agenda such that only proposals that benefit the majority of the party make it to the floor. Further, the conditional party government (CPG) thesis points to the role of the homogeneity of the majority party and its ideological distance from the opposition (Aldrich Reference Aldrich1995; Aldrich and Rohde Reference Aldrich, Rohde, Dodd and Oppenheimer2009). Majority MPs give up their right to obstruct in order to expedite legislative business, and minority MPs are simply overruled. In studies of the UK parliament, obstruction by the Irish Home Rulers has also figured as an explanatory variable of procedural choice (for example, Koß Reference Koß2015; Rutherford Reference Rutherford1914).
Thirdly, in an ideological balance-of-power model, Schickler (Reference Schickler2000) argues that when the floor median legislator moves closer to the median member of the majority party, they support procedural reform that increases the majority's control over the agenda, and vice versa. Here, MPs accept or even actively promote a diminution of their rights if doing so enhances the probability that the government will propose a bill that reflects their preferred position.
Such theories are derived, by and large, from a rich tradition of studies of procedural choice in the US Congress. Until recently, the procedures of the ‘mother of parliaments’, the UK House of Commons, have received comparably little attention from scholars, with some important exceptions (for example, Cox Reference Cox1987; Redlich Reference Redlich1908). The new research agenda of British Political Development attempts to address some of these deficiencies (for example, Eggers and Spirling Reference Eggers and Spirling2014; Eggers and Spirling Reference Eggers and Spirling2018; Moser and Reeves Reference Moser and Reeves2014; Spirling Reference Spirling2014). Given the lack of historical data on the House's internal rules of procedure, however, a comprehensive study of the determinants of procedural choice of the UK Parliament has been impossible until now. In this article, I address this lacuna in the literature, and analyse an original dataset of all changes to the House of Commons' rules of debate from 1811 to 2015. The analysis focuses on anti-dilatory reform, that is, changes limiting individual legislators' use of dilatory (delay) tactics during debates. The article presents, to my knowledge, the first systematic and directional test of a range of competing theories of parliamentary reform in the UK context, in what is otherwise a heavily US Congress-dominated field.
This article tests a new theory of procedural choice that builds on Diermeier and Vlaicu (Reference Diermeier and Vlaicu2011). In contrast to established theories, I argue that procedural choice is not dependent on the strength of the majority party alone. Instead, rules change is dictated by an intraparty delegation dynamic within all parties, which hinges on the degree of intra- and interparty polarization across all parties in the chamber.Footnote 2 In this non-partisan, consensus model of procedural choice, obstruction that undermines parliament creates a need for reform. But polarization dictates the speed with which MPs are able to commit to implementing procedural changes: intraparty homogeneity among the government or the opposition, as well as interparty ideological proximity, leads to faster procedural change.
This analysis of the UK Parliament's rules of debate is an important undertaking for two reasons. First, parliamentary debate serves as a pivotal strategic tool to communicate with the electorate (for example, Proksch and Slapin Reference Proksch and Slapin2015). Consequently, it is crucial to understand how and why opportunities for MPs to use rules of debate strategically changes over time. Secondly, in the ‘mother of parliaments’, discussion has traditionally played an important role in the policy formation process. Even in today's parliament, legislative proposals are almost entirely examined through the process of debate, including public and delegated legislation (Blackburn, Kennon and Wheeler-Booth Reference Blackburn, Kennon and Wheeler-Booth2003). Additionally, established theories show that procedural rules can have important policy consequences (Baron and Ferejohn Reference Baron and Ferejohn1989; McCarty Reference McCarty2000). Since debate affects public policy, it is important to understand the procedural environment in which it takes place.
Theory: Obstruction, Polarization and Rules of Debate
Under what conditions are legislators willing to give up the powerful policy-influencing tool that dilatory tactics afford them? My theory proposes that the adoption of procedural changes to rules of debate relies on factors that put a parliament at risk of breakdown, and factors that influence whether MPs will combine forces to mitigate that risk. My argument proceeds through two logical steps. First, a parliament is at risk of reform when legislators employ obstructive tactics that undermine the institution of parliament. Secondly, the speed with which MPs respond to such obstructive behaviour depends on their ability to maintain policy influence when giving up dilatory tactics.
Why MPs Speak
Rules of debate occupy a rather unique position in a parliament, because they are fundamentally intertwined with the sine qua non of legislation: plenary time. Unlimited debate – that is, debate that is not subject to anti-dilatory rules – is valuable because it allows legislators who oppose a bill to leverage opportunity costs to extract policy concessions. The minister who proposes a piece of legislation is primarily interested in governing efficiently and can therefore less afford to delay the implementation of the Cabinet's legislative agenda. If MPs can speak about an issue for a considerable amount of time, the minister may make a number of concessions to expedite the implementation of new policies.Footnote 3
Meanwhile, as long as MPs toe the party line in voting, where defection can be seen as the ultimate act of defiance (cf. Proksch and Slapin Reference Proksch and Slapin2015, 7), they may enjoy relative freedom to engage in debate as they choose (Schwarz, Traber and Benoit Reference Schwarz, Traber and Benoit2015). Stalling debate is therefore an important policy-influencing mechanism. I assume here that MPs are primarily policy interested (Krehbiel Reference Krehbiel1998) and use debate to advance their policy agenda (see also Martin Reference Martin2011; Morris Reference Morris2001). From this, it follows that individual members’ procedural choices should be informed by their views on policy (see also Binder Reference Binder1996, 11). Consequently, we should consider debate and the rules that guide it through the lens of filibustering. The ability of MPs to make speeches without constraints is, I argue, a potent policy tool; the value of this tool to MPs varies according to circumstance.Footnote 4
Obstruction: Generating a Latent Need for Reform (Hypothesis 1)
While a majority of legislators are committed to wielding their speaking power to influence policy, we cannot discount the fact that some MPs, in doing so (whether by design or not) undermine parliament as a whole by employing dilatory tactics. The sound operation of parliament is a collective good, and the division of the common pool resource of time presents a collective action problem. The consequences of over-exploitation of the commons – in this case, plenary time – threatens the survival of the institution itself. The Irish obstructive tactics employed in the late nineteenth-century House of Commons are a case in point (for instance, Bryce Reference Bryce1921; Cox Reference Cox1987; Fraser Reference Fraser1960).Footnote 5 Such behaviour should inspire a latent desire among legislators to ‘save’ the institution of parliament through the implementation of (stricter) formal rules (see in particular Rutherford Reference Rutherford1914).
MPs can collaborate to solve this collective action problem by enforcing new, restrictive rules, even in the absence of a central authority (Ostrom Reference Ostrom1990, 13–15). However, while a parliament may be at risk of reform when obstruction is rife, legislators do not necessarily commit to changing the rules to impede the use of dilatory tactics. For legislators, enforcing anti-dilatory rules presents a procedural dilemma: while they recognize the need to act, abdicating their dilatory rights amounts to surrendering policy power. Consequently, obstruction creates a ‘procedural dilemma’ that puts a parliament at risk of reform only:
Hypothesis 1 (Obstruction Hypothesis): Parliament is more likely to be at risk of anti-dilatory reform when levels of obstruction are high
The creation of new anti-dilatory rules is an intraparty delegation problem. By accepting limitations on their right to speak, legislators transfer power from themselves to the party leadership. Legislators may recuperate some of that influence by building a coalition of members who share similar interests on an ad hoc basis. Subsequently, such a group can designate an MP who will take the floor to defend their interests. Employing this strategy places the coalition in a principal-agent framework (Kiewiet and McCubbins Reference Kiewiet and McCubbins1991), in which their agreement may fall victim to ‘shirking’: the designated MP (the ‘agent’) has an opportunity to move away from the agreed-upon stance and pursue a strategy that brings legislation closer to their own preferences. Abandoning dilatory rights therefore exposes MPs to the risk that legislation is passed that is far removed from their ideal point, while dilatory tactics can no longer be used to influence policy.
Government Polarization: The Duration of the Procedural Status Quo (Hypothesis 2)
When a parliament is at risk of reform (because of obstruction), the speed with which MPs can commit to and implement an anti-dilatory procedural change depends on the presence of an alternative policy-influencing mechanism: polarization. To build this part of the theory, I turn to an important – and empirically untested – contribution on this topic by Diermeier and Vlaicu (Reference Diermeier and Vlaicu2011). The Diermeier-Vlaicu model (hereafter: DVM) argues that legislators face policy-driven incentives to commit to in-egalitarian agenda rules when legislator preferences in parties are correlated.Footnote 6
DVM emphasizes the reduction in transaction costs that can be achieved by relying on like-minded colleagues. MPs, in this view, have incentives to empower their party's leaders to capture the bargaining benefits of a more homogeneous party membership. In contrast, I emphasize the policy influence that MPs lose when adopting a particular set of new rules that limit filibustering, and the mechanism through which they may compensate for such a loss (that is, relying on colleagues). It is a commonly accepted outcome of game-theoretic models of cooperation that group cohesion and a smaller size positively affect a group's ability to rely on informal modes of governance. Both variables are associated with an increase in the quality of information about violations of norms (for example, not sticking to a bargain that is struck on a bill) and the credibility of punishment (Abreu Reference Abreu1998; Abreu, Milgrom, and Pearce Reference Abreu, Milgrom and Pearce1991; Dixit Reference Dixit2004; Ostrom Reference Ostrom1990). When preferences within a political party are concentrated, the (ideological) costs of building coalitions with colleagues within the party are minimal: it pays to empower them by reducing one's own rights.
The speed with which legislators are able to prioritize protecting parliament against obstructive behaviour therefore depends on the concentration of preferences within parties: legislators need to build up expectations of their colleagues' behaviour with respect to legislation. When preferences are concentrated, MPs will expect that colleagues will support their views more quickly than if preferences are not concentrated, and opinion will more rapidly converge around changing the status quo to tackle obstruction. This certainly applies to the majority party, which by and large is the first mover on proposals for procedural reforms:
Hypothesis 2 (Government Homogeneity): The duration of an institutional equilibrium within a parliament is likely to be shorter (longer) when preferences are homogeneous (heterogeneous) within the government party or coalition parties.
Opposition Polarization: The Role of the Opposition (Hypotheses 3 and 4)
DVM emphasizes that any form of party influence stems from a situation in which preferences coalesce, thereby setting it apart from partisan theories that emphasize party power (Cox and McCubbins Reference Cox and McCubbins2005). In partisan theories, the role of the government party is prime. When the majority party is ideologically homogeneous, it has an interest in changing procedural rights to its advantage, at the expense of the opposition (Aldrich Reference Aldrich1995; Aldrich and Rohde Reference Aldrich, Rohde, Dodd and Oppenheimer2009; Binder Reference Binder1996).Footnote 7 However, this perspective is decidedly partisan in nature: in CPG, strong and homogeneous parties are able to manipulate procedural rules to accommodate their purposes, and to shield their legislative agenda from attacks by the opposition.
In the UK context, we may expect a more consensual policy-making style for procedural reforms, at least when it comes to interparty dynamics. Unlike in the United States (for example, Cox and McCubbins Reference Cox and McCubbins1993), the party does not enforce the whip on key procedural votes, even though sponsorship by a minister is often necessary for proposals to make it onto the parliamentary agenda (cf. Russell Reference Russell2011, 613). While procedural changes are often proposed to the floor directly by the government (such as Gladstone's 1882 closure rule and its amendment in 1887 (for example, Koß Reference Koß2015)), in a majority of cases a special committee is charged with revising the rules. The recommendations made by such a committee are subsequently put to the floor. As time in the UK House has historically been divided along government-opposition lines, the fight over the distribution of this scarce resource plays out among individual MPs within their respective parties. Dilatory rules in the UK House of Commons therefore mainly concern the power relations between party members and their leaders, who will be better able to control access to the floor.
Just as the majority of government party members can commit to enforcing anti-dilatory reform, opposition MPs are able to overcome concerns about empowering their party leaders when they are more likely to share similar preferences on issues. For the opposition, the benefits of empowering party leaders are slightly different: instead of expecting similar proposals to be tabled, they may expect their party leaders to challenge the government's bills on the same grounds as they would have. When opposition MPs are more likely to share opinions across issues, the benefits of being able to stand on a united platform outstrip the potential risk of empowering the government. This is particularly the case as, over time, a consensus has emerged in the Commons that the government has the responsibility to legislate (cf. Kelso Reference Kelso2009), whereas the opposition primarily seeks out opportunities to challenge legislation and embarrass the government (see in particular Eggers and Spirling Reference Eggers and Spirling2014). In addition, given that power may change hands relatively quickly between elections, the opposition should not be particularly concerned about empowering the government through its support of anti-dilatory reforms, as it may expect to benefit from these same prerogatives in the future (cf. Kelso Reference Kelso2009, 45):
Hypothesis 3 (Opposition Homogeneity): The duration of an institutional equilibrium within a parliament is likely to be shorter (longer) when preferences are homogeneous (heterogeneous) within the opposition party or parties.
A further implication of the consensus model is that greater homogeneity between the opposition and government should also positively affect the speed of procedural reform. In other words, smaller divergences between the opposition and government should make anti-dilatory reform more likely, and vice versa. In CPG, the ‘party condition’ is a function of the degree to which the majority party agrees that it desires different legislative outcomes than the opposition (Aldrich and Rohde Reference Aldrich and Rohde1998, 5). Similarly, DVM emphasizes the need for distinct ideological camps on either side of the median for restrictive procedures to be adopted. In sum, both views on procedural choice imply that the government is able to enforce procedural changes when its members expect that legislators from the opposite side of the aisle are likely to support substantially different legislation.
Conversely, a more consensus-oriented model implies the opposite: when, faced with potential obstruction, MPs can expect that members from the opposite benches are not too far removed from their ideal point, it will be easier to relinquish their individual dilatory rights to their party leaders. In this scenario, an alternative policy-influencing mechanism derives from being able to count on legislators from different parties to defend similar policies. In this scenario, opinions will again more quickly converge around changing the status quo in the interest of saving the collective good (that is, Parliament):
Hypothesis 4 (Interparty Polarization):The duration of an institutional equilibrium within a parliament is likely to be longer (shorter) when preferences are heterogeneous (homogeneous) between the government party or parties and the opposition party or parties, respectively.
The perspective of procedural choice that I have outlined above presents a more nuanced picture of procedural reform that draws from insights of conditional party government, but with several important modifications. First, while my theory similarly emphasizes the role of obstructive behaviour and government party homogeneity, it adds a temporal dimension and highlights the longer-term calculations about policy power that motivate members to change the House's procedures. Unlike CPG, therefore, my perspective does not present a partisan view in which the creation and/or suppression of anti-dilatory rights is inspired by short-term policy preferences (see in particular Binder Reference Binder1996, 11). Instead, my theory draws attention to the complex calculations that MPs make with respect to giving up procedural rights, explains why a parliament may be at risk of reform, and why in the context of such a risk legislators may (or may not) be able to pass the necessary reforms to ‘save’ their institution.
Thus a response to obstructive behaviour is not framed in terms of protecting one's legislative agenda, but rather the longer-term harm it may inflict on the institution of parliament. Unlike the dominant theories from the US Congress, MPs are not expected to support the reform to protect their party against attacks from the opposition. It is also not the case that procedural changes are achieved when the party enforces discipline on key procedural votes (for instance, Cox and McCubbins Reference Cox and McCubbins1994, 218). Instead, changes to the rules of debate in the UK lower house depend on the degree of consensus within and between parties.
Coalitions to introduce procedural reforms may, therefore, emerge on either a partisan or non-partisan basis. Within-party coalitions for change form when preferences are concentrated among their members. Such coalitions may cut across parties that are close to each other on the political spectrum, and the removal of dilatory rights is less likely to pass control over policy from one political party to the other.Footnote 8
Data and Measures
Dependent Variable: Anti-Dilatory Reform
To test the argument developed above, I focus on historical instances of anti-dilatory reform. The unit of analysis is the (non-)occurrence of such procedural changes in every session of parliament from 1811 to 2015. To construct my dependent variable, I analyse all changes to the standing orders for this period. The House of Commons adopts new rules for each yearly session. I first ‘reconstructed’ consolidated versions of the standing orders of the UK lower house for each amendment date over this period by manually comparing successive versions of the rules. An updated, more comprehensive and machine-readable version of these data in xml and json format is available in Goet, Fleming, and Zubek (Reference Goet, Fleming and Zubek2019). Details of the dataset and sources used are provided in Appendix A.
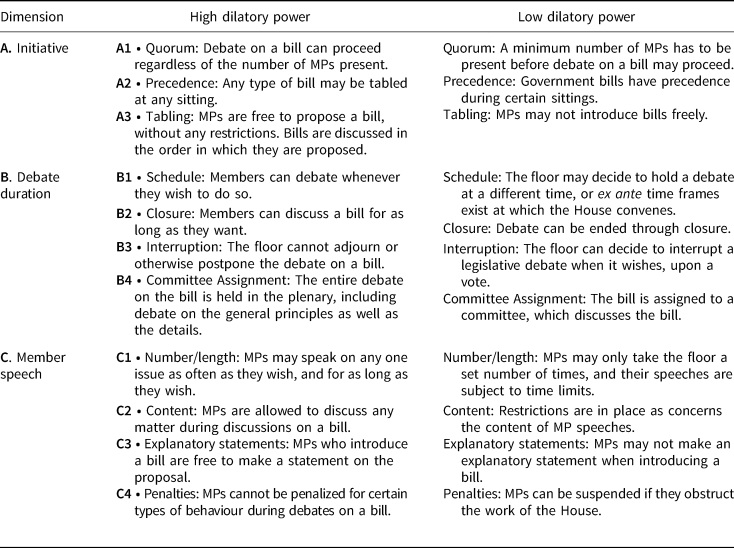
Subsequently, I analyse the changes using a coding scheme that identifies three key dimensions of rules that MPs may use to filibuster (Table 1). Appendix Table A1 provides a detailed overview of the typology of parliamentary rules as well as the coding. First, the initiative category looks at an MP's ability to submit motions, resolutions or proposals that compete with the Cabinet programme for the attention of the House. Secondly, after the debate has started, a set of rules determines the overall duration of the discussions. Thirdly, at the micro level, there are procedures to manage individual MPs’ floor time, and their ability to compete with the Cabinet (member speech). I code reforms as follows:
+1, for each change to the standing orders that on balance weakens members' dilatory power in legislative debate;
−1, for each alteration to the standing orders that on balance strengthens the dilatory power of MPs in legislative debate;
0, for each transformation that on balance neither reinforces nor weakens the dilatory power of MPs in legislative debate.
A typology of rules of debate (simplified)

To determine the final score for each session, I analyse changes in a number of sub-dimensions for each session (Appendix Table B1). Subsequently I sum across the dimensions. If the overall sum is positive, the session is coded 1, and 0 otherwise. The dependent variable thus reflects the (non-)occurrence of dilatory power for each session of the House of Commons during the study period (1811–2015).Footnote 9 The dataset comprises 233 observations (sessions), representing instances of change (or a lack thereof) to the rules for legislative debate in the plenary. Details of the reforms and coding decisions are shown in Appendix Table A2.
Independent Variables
Obstruction
To measure the use of obstructive tactics in the House, I take the proportion of unsuccessful motions to adjourn that were proposed in the House in each session, of the total adjournment motions made.Footnote 10 Similar to the US Congress (Binder Reference Binder1996, 12), motions to adjourn were used in an obstructive fashion; indeed, Rutherford (Reference Rutherford1914, 169) describes it as ‘probably one of the most effective weapons used by obstructors’.Footnote 11 Appendix B provides a validation exercise of the obstruction variable using change-point analysis.
Measuring polarization with text analysis
To construct measures of within- and between-party polarization, I apply a new text analysis method to estimate the ‘partyness’ of legislators from their speeches (cf. Peterson and Spirling Reference Peterson and Spirling2018). I train a classifier on records of over 6.2 million speeches for each parliamentary session in the period 1811–2015, using party labels associated with speeches as the outcome of interest.Footnote 12 Subsequently, the trained model is used to predict the party label of held-out data from that same parliamentary session. The probability of a speech belonging to one's own party is taken to be an MP's ‘position’ for that speech. By using k-fold cross-validation, we obtain such values for each individual speech. In so doing, I extend Peterson and Spirling's application to new data that include the period prior to 1930, back to 1810.Footnote 13
Speech-based analyses offer significant advantages over traditional roll-call-based estimates. The latter do not travel well in parliamentary systems (Hix and Noury Reference Hix and Noury2010; Spirling and McLean Reference Spirling and McLean2007), as career incentives and government allegiance rather than bill-specific preferences drive voting (Benedetto and Hix Reference Benedetto and Hix2007; Kam Reference Kam2009). While voting against the party may be considered the ‘nuclear option’, speeches afford MPs the opportunity to express their views while minimizing harm to the party brand, which allows them to communicate their standpoint in a more nuanced way (rather than rely on the simple ‘against’, ‘in favour’ or ‘abstain’ that is characteristic of voting) (Proksch and Slapin Reference Proksch and Slapin2015, 7). Speeches are therefore more likely to give us meaningful information about the stance of legislators on different issues.
I use text analysis to construct novel measures of within-party polarization. Whereas Peterson and Spirling (Reference Peterson and Spirling2018) use the predictive accuracy of the machine classifier to estimate polarization, I consider the estimated probabilities that the speech belongs to a particular party label. This approach allows us to drill down to the level of individual legislators, to consider the spread of opinions within the party on a wide range of issues. Three measures of intra- and interparty polarization are developed in this article: government polarization, opposition polarization and government-opposition (interparty) polarization.
Government polarization
Polarization in the government party (or for coalitions: parties) is measured as the standard deviation of the estimated class probability of its members' speeches for their own party label, for all of their party's speeches in a session. This measure captures the degree to which members are linguistically (and, by assumption, ideologically) proximate to their party colleagues across the issues on which they spoke.
Opposition polarization
Polarization in the opposition party/parties is similarly measured as the standard deviation of the probability of its members' speeches belonging to their party label.
Government-opposition (interparty) polarization
To construct a measure of government-opposition polarization, I take the probability for all members of belonging to the government party (or parties), and subsequently calculate the mean for each group (government and opposition). The difference between the means is taken as a measure of interparty polarization. This estimate can therefore grow either when government members become more homogeneous within their party (therefore becoming less likely to be close to the opposition), or when the opposition grows less likely to share the opinions held by MPs of the government benches.
Control Variables
I control for a number of predictors in the models that previous research has found to impact procedural choice.
Workload
In developing a measure of workload, I follow Binder (Reference Binder1996, 12) and generate a composite measure using a principal components analysis of three related indicators: the number of session days,Footnote 14 the number of House members and the total number of divisions.
Change in party control
I control for changes in party control to account for the possibility that parties will respond to an anticipated loss of power by ‘stacking the deck’ against their successors (for example, Cox and McCubbins Reference Cox and McCubbins1997). A parliamentary session that is followed by a change in the governing party is scored as 1; all other sessions are coded 0.Footnote 15
Party strength
To measure Party Strength, I focus on how prominently references to political parties figure in parliamentary debates: I assume that MPs are more likely to speak on this matter as political parties gain prominence and require new legislation. Specifically, the variable is measured as the proportion of speeches made in a parliamentary session that mention ‘my party’ at least once, plus the proportion that include references to ‘political party’ or ‘political parties’ at least once.
Majority size
Majority size is measured as the number of seats held by the government minus those held by opposition parties, divided by the total number of available seats in the House during a session. Data for the period between 1832 and 2015 are taken from Rallings and Thrasher (Reference Rallings and Thrasher2012), and from History of Parliament Online for 1811–1832.Footnote 16
Days until election
Because previous work suggests that imminent elections may motivate the ruling party to expedite reforms (for example, Huber Reference Huber1992), I include the number of days until the election.Footnote 17
Procedural reform t – 1
Finally, I include a dummy to account for sessions that were preceded by an anti-dilatory reform session.
Results
In what follows, I model the impact of the predictors of interest on the duration of the survival of a given status quo and the occurrence of anti-dilatory, procedural reform.
Model Specification and Estimation
The main analysis in this article relies on two types of models. First, given the binary nature of the dependent variable, I use logit regression models to evaluate the impact of the determinants of institutional change. Specifically, to account for the inherited rules environment, I use a generalized linear mixed model (GLMM) that allows for varying effects for each period identified by the number of anti-dilatory rules already in place.Footnote 18 This approach has significant advantages over the (often-used) strategy of including the lagged dependent variable in the model, for which desirable properties of standard estimators are not obtained, leading to severe bias in coefficient estimates (for example, Wilkins Reference Wilkins2018). These models may be seen as a test of whether there are any short-term effects of the explanatory variables, in line with CPG.
Secondly, I rely on split-population duration (SPD) models to disentangle the long-term structural and short-term trigger causes of procedural reform. This modelling strategy was originally designed for survival analysis of patients in the medical sciences, to account for the fact that particular groups of patients are not at risk of death because they have been cured (cf. Boag Reference Boag1949). Such a scenario – which is empirically likely – does not lend itself to the ‘standard’ survival model as this kind of model assumes that all subjects will experience the event of interest (regardless of whether they are, for example, right-censored). SPD models estimate two sets of coefficients: (i) for the incidence of an event and (ii) for the timing of an event, conditional on the incidence probability.Footnote 19 The censoring indicator serves as the dependent variable in the incidence component of the model. Importantly, SPD models permit the identification of populations that are ‘at risk’, whose membership is modelled through a logistic link function with its own covariates. Crucially, this modelling strategy allows us to identify at-risk groups in cases where sub-populations are not easily identifiable. Because of these desirable properties, SPD models have been extended to many different applications, including the political sciences (for example, Svolik Reference Svolik2008).
In this article, I exploit the ability to model at-risk sub-groups separately to identify what causes parliaments to be at risk of institutional change, and what predictors determine how quickly reform is implemented conditional on that risk. This strategy allows me to directly test the proposition that obstruction creates a need for reform, and to verify the theoretical claim that the speed with which MPs can commit to instigating changes depends on polarization. The time-to-event variable for these analyses constitutes the number of years until a procedural change occurs within a parliament.
For all models, to speed up convergence of the models, I centre and rescale all independent variables by subtracting the mean from the predictors and dividing them by 2 × SD (for example, Gelman and Hill Reference Gelman and Hill2007, 56). Further, to address problems of multicollinearity, the effect of within-opposition polarization is estimated in a separate model.Footnote 20 All models are fit in the R statistical computing software environment. The GLMM models are estimated with the lme4 library (Bates et al. Reference Bates2015), using the BOBYQA optimizer; the split-sample duration models are estimated with the Weibull hazard shape rate, using the spduration library (Beger et al. Reference Beger2017).
The Occurrence of Reform
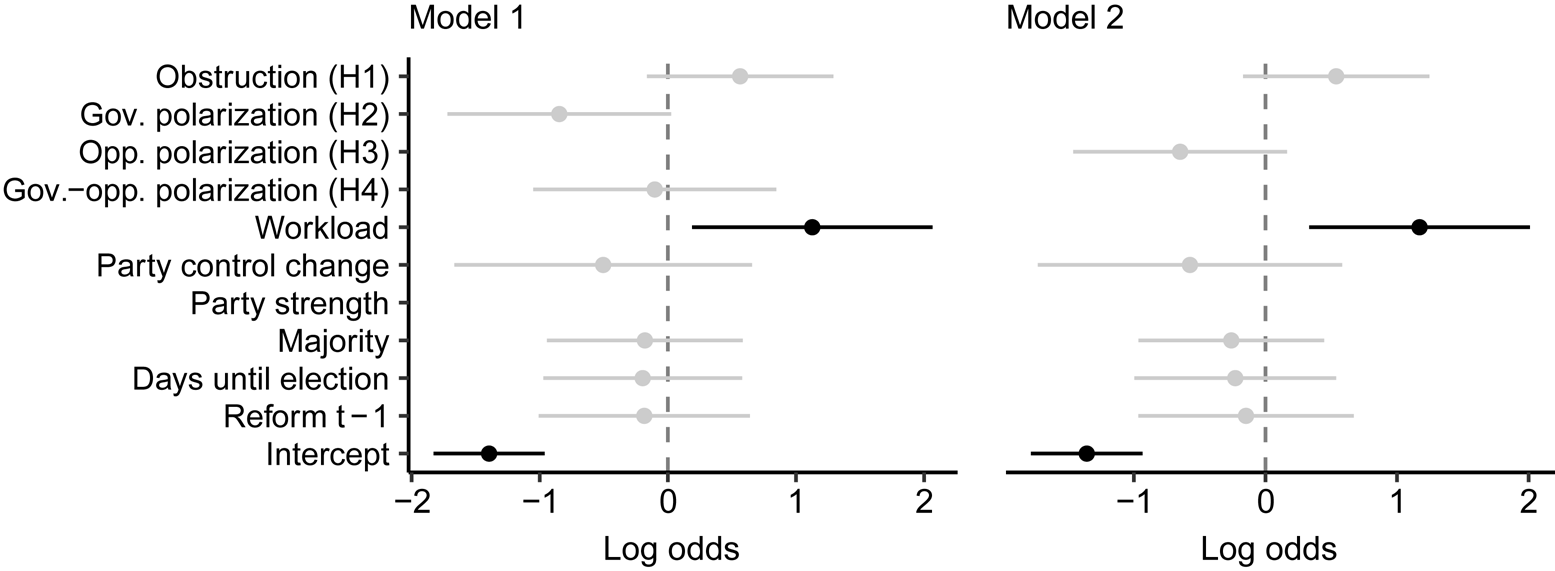
I first investigate whether there is a directly observable link between my predictors and anti-dilatory reform using GLMM models when not accounting for structural factors associated with parliamentary terms. If we accept the narrative of CPG that procedural change is a function of short-term partisan considerations, we should observe that variables such as obstruction, changes in party control, majority size and party strength exercise a positive effect on the likelihood of reform in this regression set-up. Meanwhile, we should observe a negative effect for polarization in the government and opposition parties. The results of the GLMM models are shown visually in Figure 1, which plots the coefficients (log odds) and associated 95 per cent confidence intervals.
95 per cent coefficient plot (GLMM, pooled analysis)
Note: estimates based on the models reported in Appendix B.

A number of results stand out. First, the positive sign on Obstruction and the negative sign on Government Polarization in Model 1 are consistent with CPG. Their effects are substantial: every one-unit increase the former (that is, moving two standard deviations above the mean) is associated with an increase in the odds of reform of 76 per cent, while for the latter this translates into a reduction of the odds of procedural change of 57 per cent. Similarly, Opposition Polarization (Model 2) shows a negative effect, with every one-unit increase in its value equivalent to a decrease in the odds of reform of 48 per cent. This shows that the less homogeneous the opposition, the lower the likelihood of reform. Although not an explicitly stated hypothesis of the partisan perspective, this finding is not entirely inconsistent with this view, in which the government adopts rules to face off a united opposition that may harm its legislative agenda. The effects of all three variables are just short of conventional levels of statistical significance.
Finally, only Workload exercises an effect on the likelihood of reform that is statistically different from zero. For this variable, every one-unit increase in its value (that is, moving two standard deviations above the mean) is associated with an increase in the odds of reform of 223 per cent.
These results suggest that procedural changes in the House of Commons are largely inspired by concerns over efficiency, which is in line with earlier work on the US House of Representatives (Cooper and Young Reference Cooper and Young1989; Jenkins Reference Jenkins1998). Other partisan predictors do not appear to affect the likelihood of anti-dilatory reform (that is, the confidence intervals for Party Control, Party Strength and Days Until Election all include zero). The results thus far are not entirely inconsistent with a partisan view of procedural choice, but do not paint a conclusive picture of the nature of reform in the House.
The Duration of the Status Quo
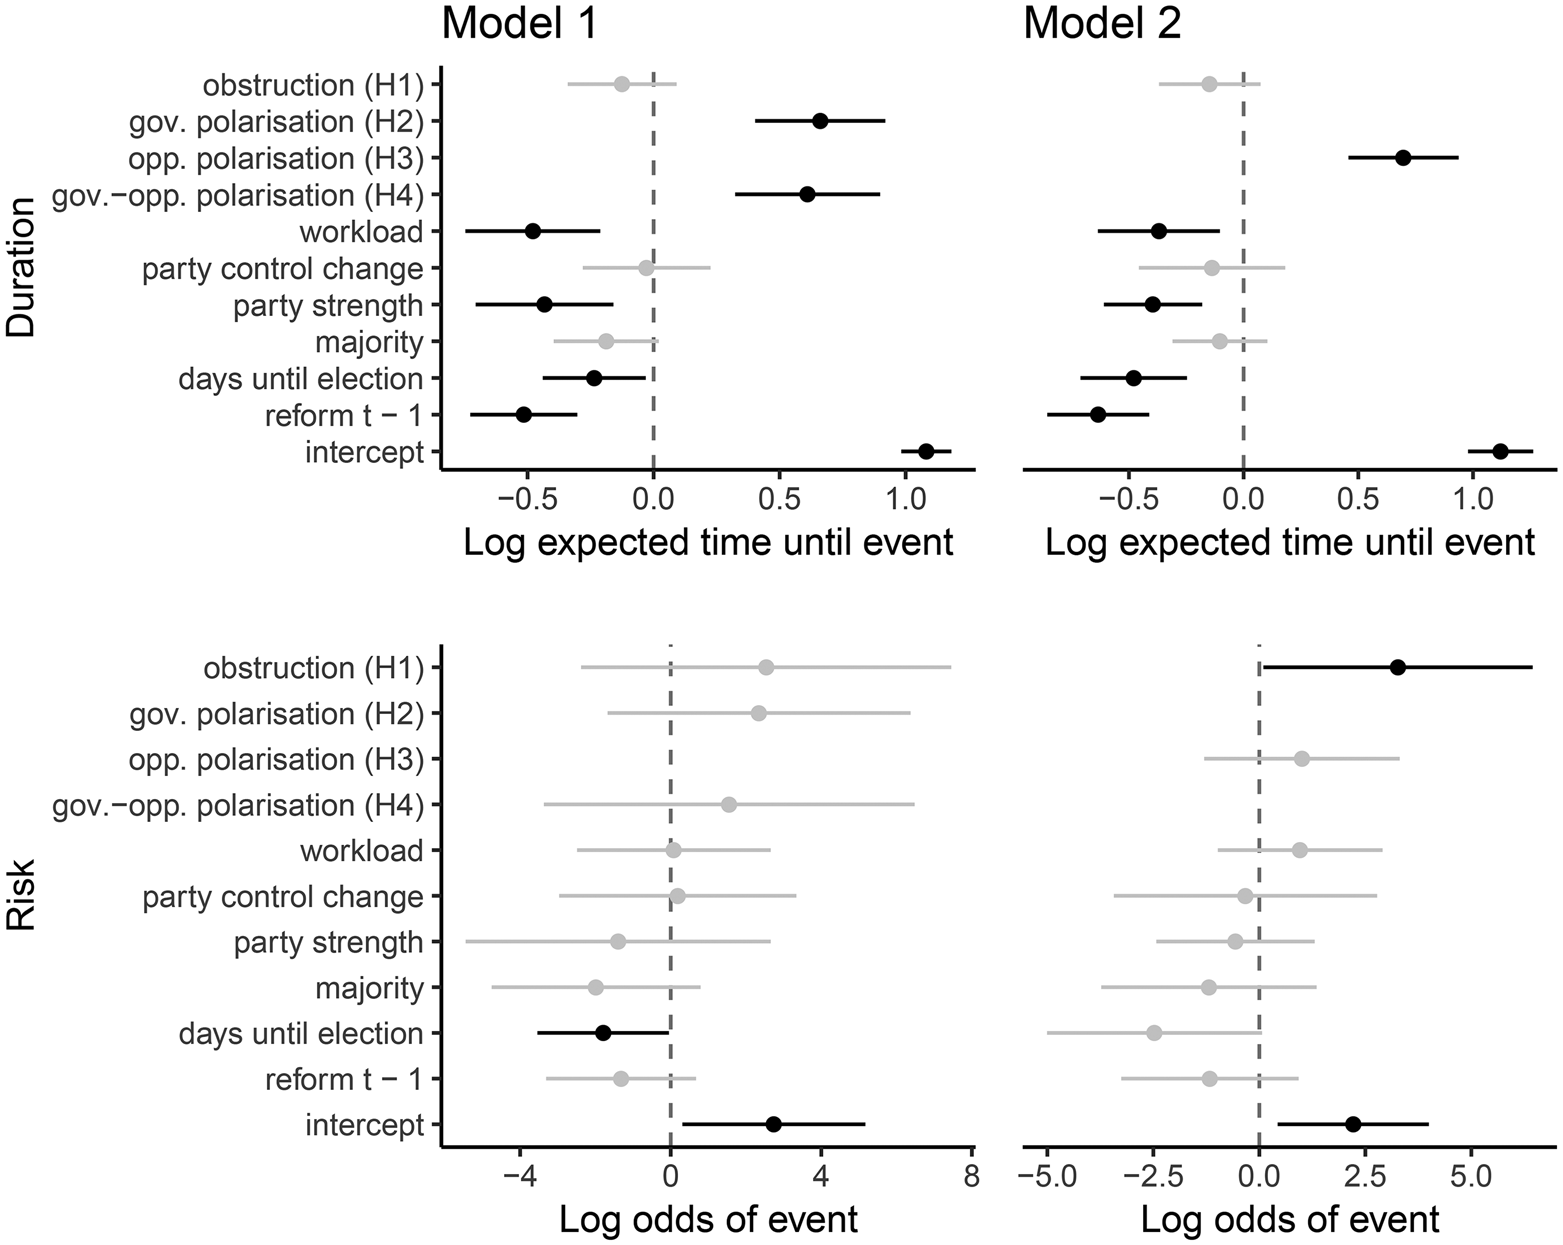
The GLMM models give some idea of any direct effect of our predictors on the occurrence of reform. However, they are unable to distinguish long-term structural factors from trigger events. Split-sample duration models offer a more appropriate way to analyse the complex dynamics of institutional change. These models allow us to disentangle factors that cause an institution to be at risk of reform from factors that determine the speed with which procedural reforms are brought into effect. We can therefore focus more directly on the duration of the procedural status quo in a parliamentary term, conditional on whether the parliament is prone to such reforms (or not). This set-up more closely mirrors the theory set out in this article, which proposes that obstruction puts an institution at risk of reform, but that the speed with which legislators can agree to curb the use of such tactics depends on intra- and interparty polarization. The results of the split-sample duration models are shown as coefficient plots in Figure 2. For each model, the top panel shows the duration component, for which coefficients represent the estimated effect of the variables on the log of expected time until procedural reform. The bottom panels report the log odds associated with the risk component of the model.
95 per cent coefficient plot (split-sample duration model, pooled analysis)
Note: estimates based on the models reported in Appendix B.

The results largely fit the proposed theory. First, the effect of Obstruction in the risk component of the model, to which Hypothesis 1 applies, shows that the presence of obstructive behaviour is the most important predictor of a parliament being identified as part of the at-risk population. Workload, although maintaining a negative effect on the duration of the status quo, does not strongly predict whether a particular parliamentary term is prone to experiencing reform. Secondly, in line with Hypothesis 2, Government Polarization has the expected positive effect on the survival duration of an existing set of rules with CI 95 = [0.4, 0.92], which is statistically significant at the 99.9 percent confidence level. This implies that when government MPs are less likely to share similar opinions on issues, the status quo is expected to last longer. The models also provide evidence to support Hypothesis 3: the confidence interval for Opposition Polarization lies entirely to the right of zero (CI95 = [0.46–0.94]), implying that a heterogeneous opposition is similarly related to a lower hazard. Both predictors have a relatively large effect on the expected survival time, which increases by 94 and 101 percent respectively as either variable increases by two standard deviations above the mean. The positive effect for Government-Opposition Polarization (CI95 = [0.32–0.9]) provides further evidence in support of Hypothesis 4, suggesting that between-party ideological divergences tend to lead MPs to maintain the status quo for a longer period.
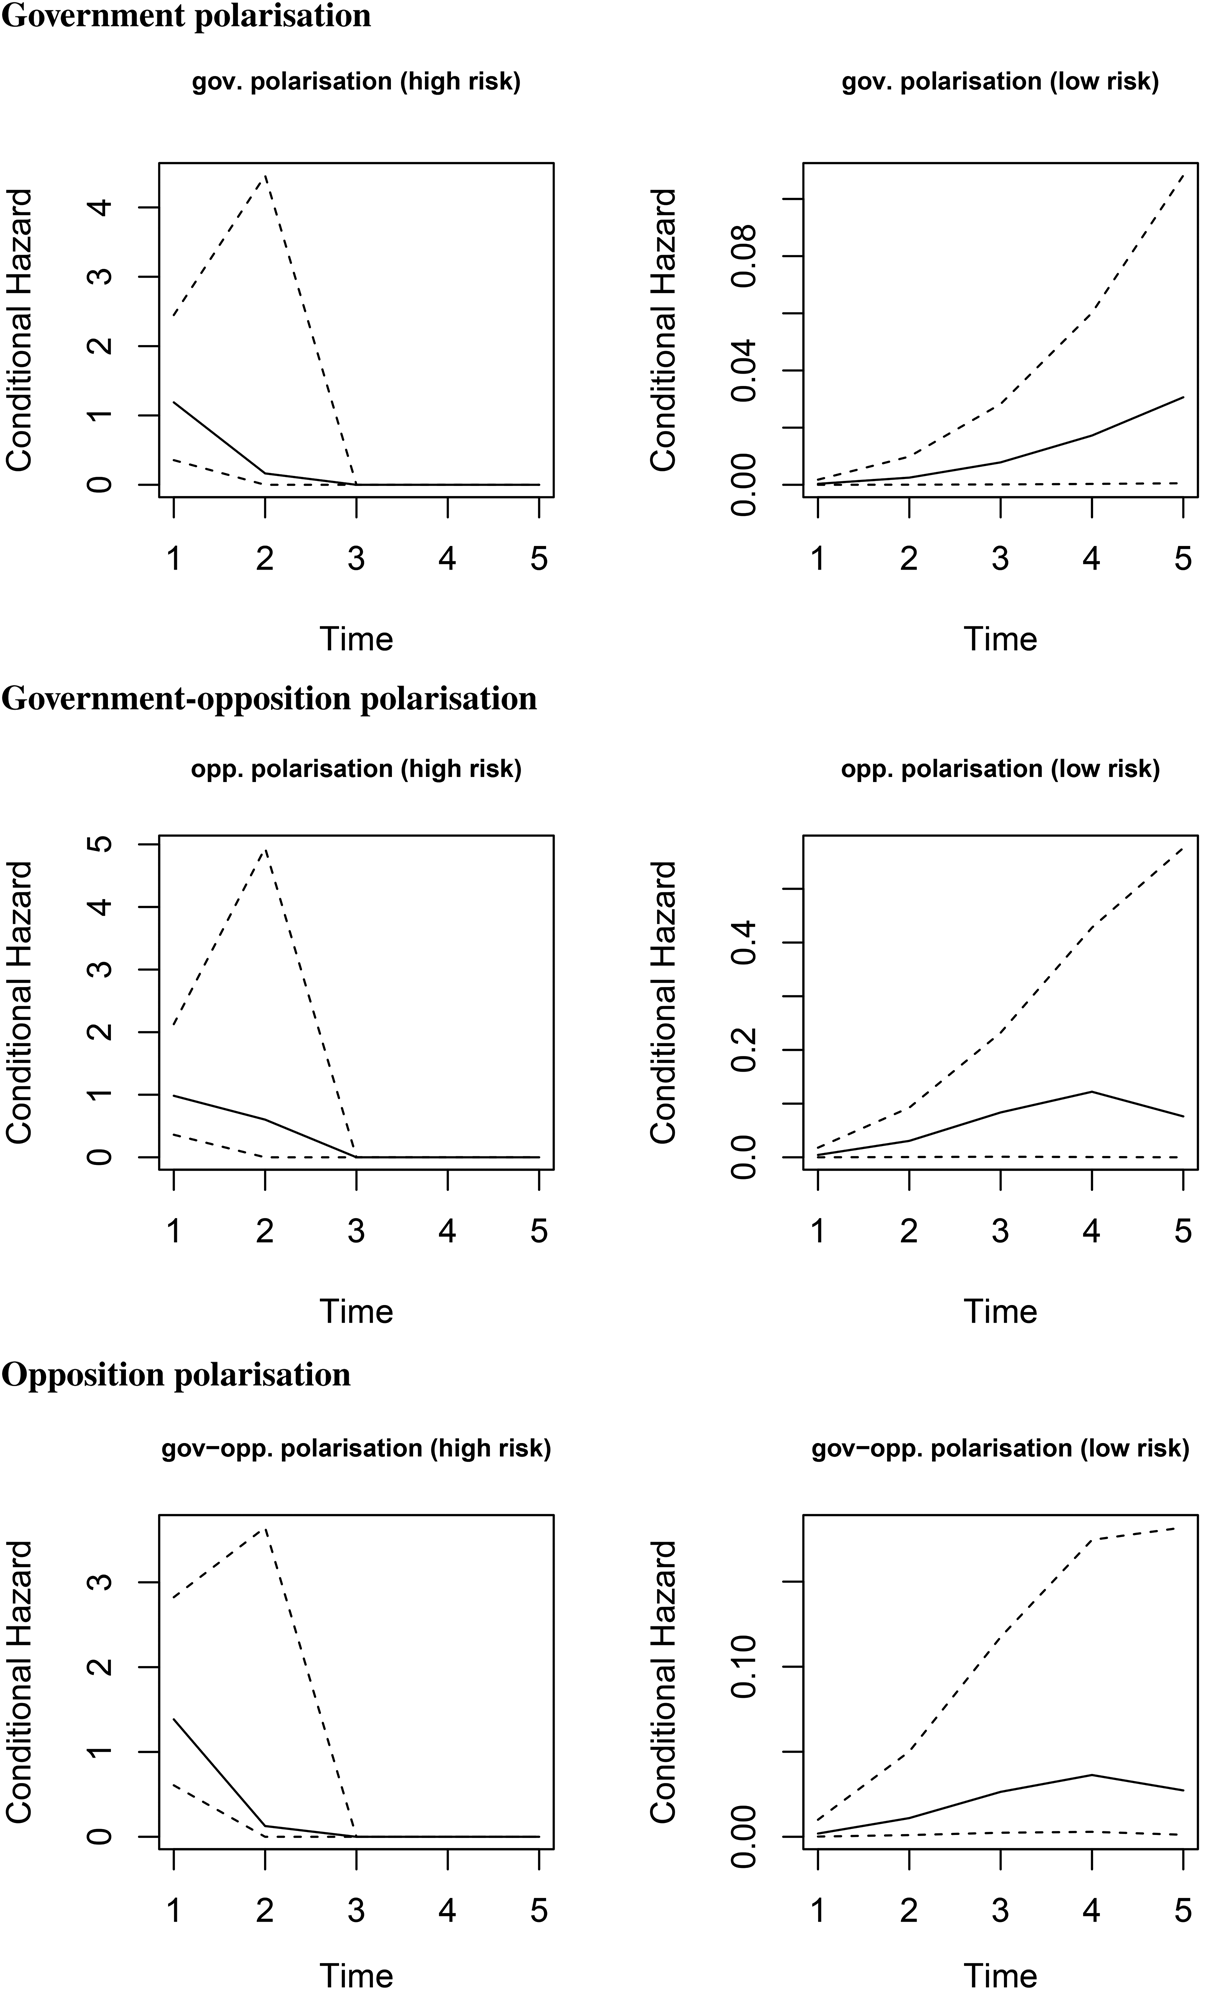
The polarization variables have substantial effects on the expected duration of the status quo. Figure 3 shows the conditional hazard – that is, the instantaneous expected rate per unit time for reform to occur, conditional on the risk and duration covariates, and on survival up to time t. The higher the hazard rate, the greater the odds of the status quo breaking down at time t. For the left panels, which represent the scenarios of a high likelihood of reform, the polarization variable in the duration equation is held at 2 SD below the mean, and obstruction at 2 SD above the mean. In the low-risk panels (on the right), these variables are inverted. All other predictors are held at their mean. The baseline hazard rates in the left panels across the number of parliamentary sessions are higher than their low-risk counterparts. For example, when Government Polarization (row 1) is low (in the duration component) and Obstruction is high (in the incidence component), after one session the conditional hazard is close to 1, compared to 0 in the low-risk scenario. Similar patterns are observed for Opposition Polarization and Government-Opposition Polarization, for which the hazard rates remain consistently higher in the ‘high-risk’ specification, and peaks after one or two sessions. These figures show that anti-dilatory reform is likely to occur considerably more quickly under conditions of a more homogeneous government or opposition, or when interparty divergences are lower, conditional on high levels of obstruction.
Hazard rates
Note: estimates based on the models reported in Appendix B.

The SPD models also inform our conclusions about the partisan drivers of procedural choice. For example, Majority Size seems to contribute negatively to the risk of reform occurring within a parliament (especially in Model 2), showing that parliaments where the government enjoys a larger seat margin are not structurally more prone to reform. However, Majority Size does reduce the time until the status quo within the at-risk population (but only in Model 1), as does Workload. In other words, when a parliament is identified to be at risk of reform (a designation that is primarily driven by Obstruction, according to the discussion above), a procedural change is likely to occur more quickly in parliaments in which the government commands a greater majority, or where parliament is busier. This is particularly evident in the first model, where the 95 per cent confidence intervals for the estimated effects lie entirely to the left of the zero line for the model's duration component.
Overall, the modelling strategy that accounts for structural causes of reform, modelling the risk population separately, paints a mixed picture. I find evidence to support my hypothesis that parliaments that experience higher levels of obstruction are more prone to procedural alterations (Hypothesis 1), but find that the speed with which the status quo changes is negatively affected by Government Polarization and Opposition Polarization (Hypotheses 2 and 3), and by polarization between the majority and opposition (Hypothesis 4). However, several partisan determinants of institutional change also have an effect, showing that short-term calculations and political expedience may also play a role.
Of these results, parliament and session jackknifing show that the effects of Government Polarization and Opposition Polarization are highly robust, always maintaining an effect at 95 per cent confidence levels. The effect of Government-Opposition Polarization is more sensitive to jackknifing, losing significance when excluding session 24.2.Footnote 21
Conclusion
Why do MPs accept limits to their rights? This article claims that ideological homogeneity within and between parties helps MPs mitigate the adverse effects of giving up freedom to participate in debate when faced with obstruction. Specifically, I argue that the presence of large, like-minded sets of legislators in a polarized parliament ensures that MPs feel comfortable delegating the ability to participate in debate to party leaders. Giving up procedural rights reduces the probability that an MP's preferred policy will be implemented; but in a polarized legislature, this is overcome by the fact that like-minded legislators propose and defend similar bills.
I find some evidence for the proposed mechanism using my own data on standing orders reform in the House of Commons from 1811–2015, and new measures of polarization based on records of 6.2 million parliamentary speeches. An empirical analysis that employs split-sample duration models suggests that parliaments are at risk of reform when obstruction is high, but that the speed with which reform is finally implemented is contingent upon the balance of ideological preferences within the majority, the opposition, and between government and opposition members. As the ideological homogeneity of the majority or the opposition increases, the expected time until an anti-dilatory reform grows. These results hold up under a wide range of controls, and are robust to excluding specific sessions and parliaments. Although less robust, I further find that greater divergences between opposition and government parties lead to a longer maintenance of the status quo.
Some of the results also point to partisan drivers of procedural change. When the government commands a larger seat share, for example, the duration until reform declines. A similar dynamic is observed for workload, which is negatively related to the survival duration of a particular set of rules. Together, these results paint a more nuanced picture of reform in the House, where the duration of the status quo is shaped by both partisan and efficiency factors, as well as the degree of within- and between-party consensus.
This nuanced picture of reform in the House speaks to many different theories of institutional change, from both the US and the UK. First, the findings provide evidence in support of some aspects of the theory advanced by Diermeier and Vlaicu (Reference Diermeier and Vlaicu2011): ideological homogeneity within parties is an important driver of reform. Secondly, my results refute the notion advanced by the conditional party government thesis that institutional reform is dictated by interparty differences. Although I detect some evidence of more partisan influences, interparty tensions are not positively related to the speed of reform, suggesting that a greater degree of consensus is required in the UK context. Finally, the findings speak to earlier studies of the House (for example, Fraser Reference Fraser1960; Rutherford Reference Rutherford1914) that emphasize the role of obstruction. By relying on SPD models, I find that obstruction does not positively affect the likelihood of restrictive reform directly. Rather, it is a longer-term structural condition that puts parliament at risk of reform. Other conditions, outlined in detail above, need to be present for that risk to translate into a speedy solution, that is, anti-dilatory reform.
Combined, the results from this analysis shed light on the important question of how a parliament manages a collective action problem: the distribution of plenary time. The evidence presented here suggests that the adoption of new procedures was not part of a larger, secular trend. Instead, the policy considerations of individual MPs provide the key explanatory mechanism for reform.
The analysis runs into a number of limitations, two of which I discuss here. First, using these particular methods – that is, constructing a party-level measure of distributional homogeneity of ideal preferences – I have only been able to provide indirect evidence of the hypothesized mechanism that links polarization to anti-dilatory reform. There remains significant scope for MP-level analysis. A more detailed qualitative investigation of the debates on procedural reforms would be a valuable addition. Secondly, the coding of the rules adopted here gives us little information about their actual impact on the dilatory power of MPs (see also my discussion of this limitation in footnote 9).Footnote 22 Some reforms, such as the introduction of the closure procedure in 1882, may be of much greater significance than others, such as a simple limitation on plenary time. An analysis that accounts for these differences may yield important new insights. I leave such improvements for future work.
Supplementary material
The data, replication instructions, and the data's codebook are available in Harvard Dataverse at: https://doi.org/10.7910/DVN/NEAG2L and online appendices at: https://doi.org/10.1017/S0007123419000188.
Acknowledgements
I would like to thank Frederick-Christoph Richters, Raphael Heuwieser, Matteo Fiore, Simon Hug, and Radoslaw Zubek for valuable comments on earlier drafts of this article. Thanks are also due to discussants and participants at the ‘Legislative Behavior in Europe’ panel at APSA 2016, the LIEPP workshop on ‘Institutional Change: The Origins and Evolution of Political Institutions’ (2016, Sciences Po, Paris), and the PADEMIA Summer School (2016, Dublin). I would like to express my gratitude to three anonymous reviewers and to the editor at BJPolS for their insightful comments and suggestions. The usual disclaimer applies.