Introduction
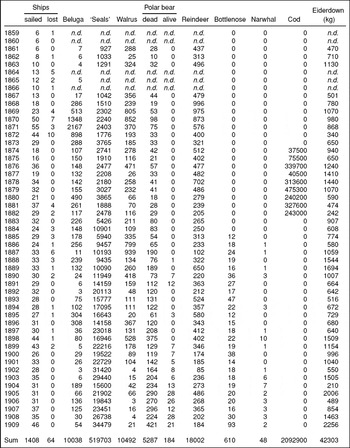
The half century between 1859 and 1909, which is the subject of this paper, was a time of vigorous change and development in what is frequently, but misleadingly, called the ‘sealing industry’ of northern Norway. The number, type and quality of vessels that sailed annually from ports in northern Norway to the waters of Svalbard, Jan Mayen, the Russian Arctic and eventually off Greenland (Fig. 1) changed radically over this period. The species and number of animals hunted, and the revenue generated by this harvest, also changed radically. Data from customs returns and ships’ logs describe a remarkable transition across these years in which one species was replaced by another in a sequence indicative of serial slaughter to the point of over harvesting. The ‘bust’ which followed the gory pools of each bloody ‘boom’ drove owners and skippers to seek new hunting grounds. In doing so, they pushed their ships further north, then east and then west than ever before, co-incidentally making a series of historical voyages of discovery. They returned from these with valuable cargoes of not only animal products but also of new knowledge particularly in the disciplines of oceanography and meteorology, and were rewarded with gold medals from some of the foremost scientific institutions in Europe (Johannesen Reference Johannesen2000). The trends in shipping activity and hunting returns that unfolded across these remarkable years are presented in a series of histograms which summarise the developments that took place (Figs. 2, 3, 4) and it is these data which provide the basis of this paper.
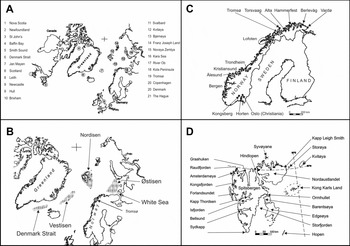
Map showing the location of places mentioned in the text. A: North Atlantic and Barents Sea. B: Principal sealing grounds of the northern fleet. These include Vestisen (The westen ice. The area between Jan Mayen and Greenland), ‘Nordisen’ (The northern ice. The area around Svalbard) and Østisen (The eastern ice. The area between the Kola Peninsula and Novaya Zemlya). C: Fennoscandia. D: the Svalbard archipelago (not including Bjørnøya).

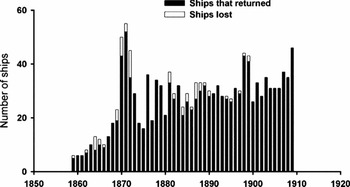
Number of ships in the Tromsø fleet each year 1859–1909. Columns representing the total for each year are divided to indicate the number that returned safely to port and the number that were lost. The ‘Tromsø fleet’ is defined in terms of ships that sailed north on commercial hunting and related expeditions to the Arctic from the port of Tromsø and which would normally have delivered their catches there.

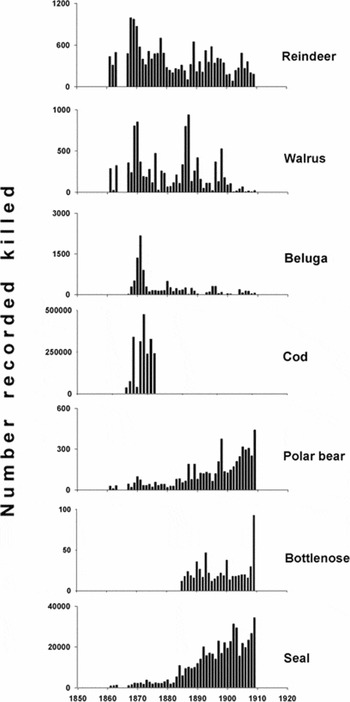
Total reported catch of the Tromsø fleet each year 1859–1909. The data are divided between six species and one species group (seals). Data from Table 1. Only incomplete catch data are available for 1859, 1860, 1864, and 1866. The data for 1865 are for beluga only.

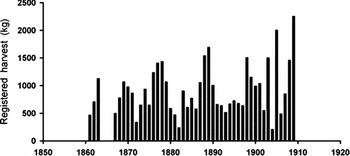
Total reported harvest of eiderdown (kg) by the Tromsø fleet each year 1859–1909. Data from Table 1.

Serial selective slaughter
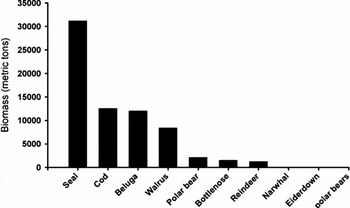
To speak of the ‘sealing fleet’ of northern Norway is a misnomer, at least in the early days of its development. The commercial hunting activity of the second half of the 19th century was a diverse affair. It was sustained chiefly by nine different (sub-) species: Atlantic cod (Gadus morhua), Atlantic walrus (Odobenus rosmarus), beluga (Delphinapterus leucas), eider ducks (Somateria mollissima) or, at least, their down, polar bears (Ursus maritimus), Svalbard reindeer (Rangifer tarandus platyrhynchus) and four species of seal: harp seal (Phoca groenlandica), hooded seal (Cystophora cristata), ring seal (Phoca hispida) and bearded seal (Erignathus baratus). Another species taken was Greenland shark (Somniosus microcephalus) but these are not considered here. Ambiguity arises, in part, because, with the exception of eiderdown for which the original data are in kilograms, the original records report the number of animals of each species that were killed. Cod and seals are numerically vastly superior in the record when considered in this way, with over 2 million of the former and half a million of the latter taken over 50 years (Table 1). However, their dominance is to some extent due to the fact that cod, especially, are relatively small in size but were hugely abundant. Converting the data to biomass provides a more reasonable basis for comparing across species. Doing this alters the picture and confirms how, taken over all years together, the catch was indeed dominated by seals. In terms of biomass, the 50 year harvest tally for seals is nearly as great as that of all other species combined (Fig. 5). Yet this observation would greatly have surprised Arctic skippers in northern Norway during the early years. Seals were taken in only trivial numbers during the first decade of the period in question and cod were unknown. Cod dominated for a short period spanning the second and the third decades and it was not until after that, starting in about 1884, that one can truly speak of a ‘sealing industry’ and a ‘sealing fleet’.
Number of ships and the reported harvest of the Tromsø fleet annually from 1859–1909. Harvest data are numbers of animals except for eiderdown which is recorded as kg. Data have been extracted from a variety of sources, chiefly customs records and log books (see text). Although four species of seals were taken (see text), contemporary records, both private and official, normally refer merely to ‘seals’ and the data are therefore presented as such in the table. (n.d. = no data).

Total reported catch of the Tromsø fleet during the period 1859–1909. The data are expressed as cumulative biomass (metric tons) for 8 species and one species group (seals). Data on numbers killed in Table 1 have been converted to biomass using estimates of live body mass (kg) chosen to reflect the fact that the harvest normally consisted of a mixture of males and females, adults and young. The values (kg) used are: bottlenose 1200, beluga 1200, narwhal 1000, walrus 800, polar bear (killed) 400, polar bear captured alive 20, reindeer 70, seal 60 and cod 6. No conversion is necessary for eiderdown because the original data are kg. Resulting values for the biomass of narwhal (48), eiderdown (42) and live polar bears (4 metric tons, respectively) do not show in the histogram owing to the scale of the ordinate.

Returning to numbers, which are intuitively easier to grasp, catch records for the different species of mammals and cod (Fig. 3) show a remarkable sequential pattern. In every case, the harvest of each rises to a peak before, in four cases, falling rapidly away to be succeeded by another species. In the early years the principal quarry was reindeer, walrus and beluga but, with the exception of brief frenzies of walrus hunting in the mid 1880s and mid 1890s, by 1880 these species counted for little and had been largely replaced in the ships’ holds by polar bears, bottlenose and seals (Fig. 3). Cod appeared in the record quite suddenly in 1874 and vanished from it equally abruptly nine years later. Then sealing started in earnest and grew in importance until eventually becoming completely dominant in terms of hunting statistics, commercial value and folklore. Eiderdown alone was harvested quite steadily across the whole period (Fig. 4). The overall picture is therefore complex and to explain it, it is necessary to examine the dynamics of the fleet in terms of the pattern of changes in the number and type of vessels, the adoption of new weapons and hunting techniques, the element of chance in the discovery of new hunting grounds and the periodic injection of capital from a variety of different sources far beyond northern Norway.
Number and type of vessels
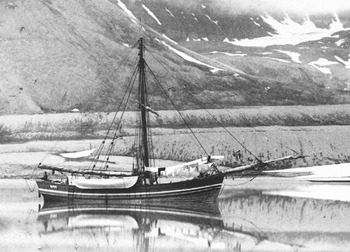
Just as catch returns are a useful summary of the level of activity in northern waters, the level of interest in hunting as a commercial venture can be conveniently summarised in terms of the size of the fleet. This paper focuses on the ‘Tromsø fleet’ which is to say the number of ships that sailed north from the port of Tromsø on commercial hunting and related expeditions each year and which subsequently delivered their catches there. At first the ships were typically small vessels, sloops of around 50 to 60 ft., in which living conditions for the crew of 8 to 10 must have been remarkably uncomfortable (Fig. 6). Nevertheless, the data show an irruption of interest over the first four years of the series during which the Tromsø fleet increased from just 6 ships in 1859 to 55 in 1871 (Table 1, Fig. 2). Numbers declined precipitously over the next four years before increasing from around 30 vessels engaged annually in the 1880s to 46 in 1909. Like the hunting records, therefore, the historical record of the size of the fleet shows a complex pattern. To explain it involves analysis of the changing patterns of ownership and of the types of the ships in the fleet. While the core of the fleet was owned by Tromsø merchants, its number swelled during boom years by the addition of vessels of which few actually belonged wholly to northern ship owners. Most were registered or, at least, part owned in southern Norway, especially in the west coast ports of Bergen, Ålesund and Kristiansund where the weight of capital lay. Some of the ships were new, some were second hand, some were foreign built and some were salvaged. These five decades also witnessed a transition from sloop to ketch (rigging) and from sail to coal and from coal to a modern fleet with diesel engine propulsion.
The sloop Bjona was typical of the vessels of the Tromsø fleet. She sailed with the fleet from 1882 when she also served as expedition ship for Alfred Nathorst and Gerard De Geer's geological expedition to Spitsbergen. In 1886 she was damaged in ice west of Spitsbergen and sprang a serious leak and sank on the way home to Norway. Fortunately, her crew was picked up by the shark fisher Elida of Vardø and taken to Hammerfest. This photograph of Bjona at Sptisbergen in 1882 is provided courtesy of The Royal Swedish Academy of Science, Stockholm.

Historical sources
The hunting statistics that form the basis of this article have been extracted from a variety of sources. Some obvious discrepancies emerged when the sources were compared with each other and endeavours have been made to remove all inconsistencies and errors.
The most comprehensive sources are the record books of the Tromsø Customs Office. These, however, exist in three versions. When a vessel returned from the Arctic Ocean its name, the name of its master and the size and composition of its catch offered for sale were recorded by Customs in the Record Books. At the end of each year these data were copied into a list entitled ‘Ishavsfangst’ [Arctic Ocean hunting returns]. The transcription, however, was not always accurate and there are instances where one or two vessels and their catches were overlooked. In 2001 Ishavsklubben [the Arctic Club] in Tromsø arranged to have the rewritten text itself transcribed with the intention of making it both more readable and more generally available. Copies of the new document, ‘Innførte fangster fra ishavet’ [Hunting returns landed from the Arctic Ocean], were deposited in several institutional archives in Norway. However, comparing this version with the previous two versions reveals that fresh errors were introduced during the copying process. The most reliable sources of hunting data, therefore are none of these but, instead, the various vessels’ own log books in which catches were recorded each day. Unfortunately, however, the collections at the National Library in Oslo and the Norwegian Polar Institute in Tromsø contain a mere 15 log books from altogether 179 different vessels which constituted the Tromsø fleet between 1859 and 1909, and a further 20 log books from the Hammerfest fleet. Valuable as these are, the author has had to rely on the Customs Office records as the principal source of hunting data.
Shipping lists reporting first which vessels had been cleared by customs for a voyage to the Arctic Ocean and subsequently vessels which returned safely, were published once a month in the Tromsø newspaper Tromsø Stiftstidende. These lists provide an independent source that has been used to test the accuracy of the customs record books.
At the close of each season Tromsø Stiftstidende published a list showing the number the vessels involved in hunting and sealing, the number lost and the numbers of seals, beluga and walrus killed. These lists were based on information provided by sealing merchants and were therefore probably accurate. Quite frequently they report more seals than do the customs record books. The discrepancy is a consequence of shark fishing. Each year some two to six vessels went fishing Greenland shark off Bjørnøya, along the west coast of Spitsbergen and along the ice edge in Storfjorden. They used seal meat and blubber as bait and would typically kill some 30 to 40 animals for this purpose. In addition, many more would be killed and carried on board if, by chance, a vessel came upon a herd of seals resting on the ice. Not infrequently, therefore, ‘fishing’ vessels returned home loaded with shark liver, seal blubber and especially seal skins that had been salted onboard and sold to a merchant on arrival. Unlike the merchants, however, customs recorded only the number of barrels of shark liver that were landed and ignored the seals.
Another source is Norsk Fiskeritidende [Norwegian Fishery News]. This was published annually from 1885. This publication also included an annual report on sealing and related activities that included data on the number of seals, beluga and reindeer taken by every vessel. The lists were based on information submitted by representatives in Tromsø, Hammerfest, Ålesund and other ports. They are reliable in terms of the numbers of vessels engaged and animals killed but not regarding information on where the catches were made. The sealer Moderen, for instance, is recorded as having hunted chiefly in the western ice but her log books states clearly that she was active exclusively in the White Sea. In a reverse case, the sealer Isbjørnen is recorded in 1896 as having hunted in the White Sea but that year Captain F. Olsen of the Avance of Hammerfest recorded in his log book that he met Captain K. Johnsen of Isbjørnen in the western ice and also that they sailed home in convoy. Comparing the published lists with log books shows also that Norsk Fiskeritidende sometimes used the term ‘Østisen’ [the eastern ice} for the White Sea area while at other times the same term referred to ice further east towards and even around Novaya Zemlya.
The rise of an industry 1859–1866
This era was characterised by few ships taking mainly walrus, bearded seals and reindeer and operating in a limited area, from Jan Mayen to Spitsbergen but not east of Hinlopen
The first hunting voyages which sailed to the Arctic Ocean from northern Norway, and which had a commercial character recognisably similar to those which subsequently characterised the ‘sealing industry’, were made as early as 1820, if not before. The first known vessel sailing from northern Norway to Svalbard was Samjonu with a crew of 11 captained by Ole Wingaard in 1819 (Drivenes and Jølle Reference Drivenes and Jølle2005). The expedition did not catch any seals but returned with a rich harvest of eiderdown and feather, 26 reindeer and some walrus. However, unambiguous and substantial accounts of such early voyages, however, are rare. Not until 1858 did local newspapers such as Tromsø Stiftstidende begin to report the return of vessels from the ice and only in 1861 did the customs office at Tromsø find the whole business sufficiently interesting to record the catches.
A convenient historical starting point is 1859 when six vessels departed Tromsø for the ice. Five years later, in 1863, the numbers reached double figures and a new industry might truly be said to have begun (Table 1). The main quarry was walrus, bearded seals and Svalbard reindeer. Walruses and bearded seals were caught with harpoons and killed with axes (Lamont Reference Lamont1861) while reindeer were shot. The crews collected eggs of a variety of different species of seabirds which nested in colonies numbering hundreds of thousands or even millions of individuals, and also eiderdown.
At this stage few masters in northern Norway's Arctic fleet were Norwegians or were even born in Norway. Skippers from Alta and Hammerfest, in particular, were mostly immigrants from farms in Finland and Sweden. These men had little nautical education but plenty of daring and they made a series of successful pioneering voyages with mixed crews of coastal Sámi, Norwegians, Finns and Swedes (Ebeltoft Reference Ebeltoft1864).
Prior to 1865 the northern Arctic fleet mainly sailed directly to the waters off Jan Mayen before turning north and east to Svalbard where they pushed north along the west coast of Spitsbergen. In the water off Jan Mayen the southern Norwegian fleet, German vessels and the Scottish fleet made rich harvest of young seals. The successful sealing of an international fleet also tempted vessels from northern Norway westward to Jan Mayen, even though these small vessels did not go into the ice but followed the ice edge. In 1856 Captain Elling Carlsen, soon to be an Arctic legend and a guide for sealing masters in the northern fleet, signed on on board Eliezer, captained by Svend Foyn, to learn the trade (Ny Illusteret Tidende (Christiana) 26 June1881). The master of the schooner Æolus recorded in the log book in 1862 that he had spoken to several Peterhead sealers and vessels in the southern Norwegian fleet in the waters off Jan Mayen. These large vessels had between 3000 and 5000 seals onboard while the vessels of the northern fleet had just a few seals before the fleet continued to Spitsbergen. Two events changed this. In 1858 the 18 year old Finnish master Johannes Nilsen of the sloop Prøven discovered that Wibelands Water (the present day Storfjorden which runs between Spitsbergen and Barentsøya) was not closed but had an exit to the northeast. This passage enabled ships to sail more or less directly to the walrus grounds on the east coasts of Kong Karls Land and Nordaustlandet. Nilsen observed that the passage twisted like a worm and named it Ormhullet [Worm Hole]. He and skipper Jonas Jonassen of Danoline (who was probably also Finnish) kept the existence of Ormhullet secret to avoid competition from other vessels. Years later sealers named it Ormsund [Worm Sound] but today it is known as Heleysund. A second major event was the first ever circumnavigation of Svalbard which was achieved in 1863 by the brig Jan Mayen of Tromsø captained by Carlsen.
These two voyages resulted in the fleet abandoning the tedious journey west to Jan Mayen and adopting, instead, a new and long lasting route. They now sailed due north to Bjørnøya, where they hunted seals in the pack ice, before continuing north along the west coast of Spitsbergen to Amsterdamøya and then east along the desolate north coast of Spitsbergen. Later in the season, in July, Storfjorden normally became navigable and the fleet could sail through Ormhullet, once its existence became known, to the walrus grounds in the east. In August and early September the fleet generally gathered at the entrance of Storfjorden, west of Hopen, where the masters of the Hammerfest and Tromsø fleets exchanged news before starting the return voyage to Norway (Diana 1886; Avance 1900; Alken 1902).
In 1864, one year after Carlsen's famous voyage, Vendskabet (I. Sundstrøm) sailed to Nordaustlandet in what was the first recorded voyage so far north and east by any vessel out of northern Norway. Early in July, whilst out in two small boats hunting seals among the ice floes, a thick fog descended and Sundstrøm and his crew lost sight of their vessel. On 4 July these men were picked up by the sealer Æolus (Tobiesen). On 11 August Æolus spoke to Anne Elisabeth (J. Mathillas) and Danoline (J. Aaström) (Æolus 1864a). Anne Elisabeth and Danoline had been to Storøya, northeast of Nordaustlandet, where they had chanced upon a herd of walrus resting ashore. Slaughter ensued. Blocks of ice on the beach prevented the animals from escaping and Mathillas reported that the crews had killed more animals than they could take aboard. Æolus, still carrying Venskabet's crew, sailed in convoy with Anne Elisabeth and Danoline southeast from Nordaustlandet to collect the rest of the catch but all three vessels became trapped in ice and were abandoned on 18 August. On this voyage Kvitøya (White Island) was observed probably from the first time since it had originally been discovered by Cornelius Gilles approximately 170 years before (Æolus 1864b). As luck would have it, the crews were all picked up by A. Nordenskiöld's expedition ship Axel Thordsen and some of the men subsequently transferred to Vendskabet which had been found.
Hunting was a highly opportunistic occupation in those early days. The vessels did not push into the pack ice but followed the ice edge where the crews took whatever they could turn into profit: walrus, beluga, bearded seals and even driftwood and other flotsam. Ashore the men hunted reindeer and collected eggs and eiderdown. The latter was crammed into barrels (Wisløff Reference Wisløff1876). This haphazard approach was reflected in another development. Up to 1864 ship owners paid NOK 40 for a walrus hide (equivalent to £250 in 2009) but this changed when they realised they were not getting whole hides. Walrus hides were normally removed in pieces. They were so heavy that it became common practice to cut one half off the animal before continuing to skin the rest. Even then, the half hides were phenomenally heavy for the men who had to drag them to the hunting boats in which they were taken back to the ships for salting. Not infrequently, the hunters failed to strip the animals completely but left part of the hide, usually a ragged strip along the back, behind. Thus, valuable hide was lost and to counter this, from 1865, ship owners began to pay for hides by the kilogramme. Furthermore, they found that hunters frequently failed to remove all the meat from the blubber before this was put it into barrels and the quality of the oil subsequently extracted was reduced as a result. Hence, they began to pay for blubber based on the quality of material in the barrels (Johannesen Reference Johannesen1877).
The vessels of the northern fleet normally carried two hunting boats each of which was commanded by a harpooner. In ships captained by Finns, the captain himself generally doubled as one of the harpooners. Harpooners were considered an elite group, a fact reflected in their superior rate of pay. Members of the crew older than 16 received one share while harpooners received three or four. Skippers had a fixed monthly rate of pay. This system of pay was maintained on sealers until well after World War II.
Ten vessels, but apparently no lives, were lost during the eight seasons from 1859 to 1866. A practice developed by which when a vessel was crushed in the ice whatever could be saved, the hunting boats, sealing gear and other equipment, would be transferred to another vessel (if one was nearby) and all the salvage would subsequently be sold at auction when the rescuer returned home. These auctions were announced in the newspapers and the income generated was used to reimburse the rescuers for the cost of keeping the wrecked crews aboard while at sea. This could be a significant sum for sometimes rescued crews had to be looked after for weeks or even months (Tromsø Stiftstidende, 8 September 1864, 27 August 1865, 27 September 1885; Æolus 1862).
By 1866 the industry was fledged, although perhaps not fully fledged. Two major events influenced its subsequent development: the discovery of a new walrus ground at Novaya Zemlya and the introduction of a potent new technique for hunting beluga whales.
Maturity and decline: walrus and beluga 1867–1873
The chief activity of the northern fleet in the years 1867–1873 was the hunting of walrus and beluga. These years are remarkable both as the first of three periods during which heavy harvests of walrus were gathered and, most especially, for an extraordinary boom and subsequent bust in beluga whaling which extinguished itself owing to the depletion of the population at Svalbard. Simultaneous with both of these was the first real onslaught on Svalbard reindeer the effects of which are still seen today.
Large kills of walruses were made at Svalbard in both 1861 (288 animals) and 1863 (324 animals) (Fig. 3) but the first record of a real massacre dates from 1864 when the crews of Æolus, Anne Elisabeth and Danoline slaughtered an entire herd at Storøya. In this case all three vessels and their cargoes were lost soon afterwards (see above) and consequently the customs record for the number of walruses landed that year is nil. The log book of Æolus states that she was carrying the hides of 212 walrus, 111 bearded seals, 27 beluga and 11 polar bears when she sank (Æolus 1864c). In 1872, likewise, six sealers heavily loaded with walrus hides were trapped in ice at Graahuken and were lost, so the tally for that year of just 193 animals probably considerably underestimates the true number killed. However, a reluctant voyage of discovery in 1867 marked a breakthrough.
In that year Carlsen, who had already made the first circumnavigation of Svalbard in 1863, hunted walrus at Novaya Zemlya for the first time, too, in the sloop Solid. He had purchased this vessel in 1864 but had had little success as a ship owner and had sold 2/3 of his interest to O.J. Finckenhagen, a merchant from Hammerfest. Finckenhagen stipulated that instead of sealing at Spitsbergen, Carlsen and should hunt walrus at Novaya Zemlya. Carlsen strongly disagreed, arguing that the coast of Novaya Zemlya was completely unknown to Norwegian sailors and there were no sea charts. However, he had little choice but to comply and Solid sailed east to Novaya Zemlya the same season. She journeyed north along the west coast of the archipelago and south along the east coast, the crew catching and killing whatever they found along the way. The expedition reached the mouth of the River Ob, where contact was made with local Nenets who came onboard, and returned to Hammerfest in October (Sivertsen Reference Sivertsen1973). The voyage was a notable commercial success and the following year an armada of vessels sailed to Novaya Zemlya. The principal quarry was walrus and in the two years 1869 and 1870 the total catch exceeded 1600 animals most of which were taken at Novaya Zemlya (Fig. 3). It could not last. Within two years the catch fell to fewer than 200 animals (Table 1), walrus having been almost exterminated both at the Spitsbergen and the Novaya Zemlya fields.
Simultaneously with the walrus hunting boom at Novaya Zemlya, there was a beluga whaling boom at Spitsbergen. In 1868 Captain Albert Pettersen of Bergen equipped an expedition of eight vessels that sailed from Tromsø to Spitsbergen. Its purpose was to hunt beluga whales with harpoons, to shoot reindeer, and to gather eiderdown. The expedition was a success and the ships returned with 288 beluga whales, some 900 reindeer and some 700 kg of eiderdown. The following year, this same Pettersen made an important innovation. He intended to catch belugas with nets and equipped two sloops, Odin (A. Trondsen) and Sølivet (R. Halvorsen) and two tenders accordingly. This expedition was an even greater success. The four vessels returned with 510 beluga whales all caught off the west coast of Spitsbergen. The catch rate was, thus, 127 belugas per vessel compared with just 36 per vessel in the previous year. Enthusiasm for netting belugas erupted.
The next season (1870) the Tromsø fleet increased from 23 to 50 vessels (Table 1), including three that were the first Norwegian steam ships to sail from Norway to Svalbard and Novaya Zemlya. These were Spitsbergen (R. Halvorsen) of Bergen, the smack Fiskeren (Carl F. Wisløff) of Tromsø and Trafik of Vardø.
Spitsbergen (145 gross tons) had been built in Newcastle for a group of Bergen investors. Responding quickly to the previous year's success, she was equipped with beluga nets and hunting boats. Her crew caught 276 beluga whales and 12 seals on her maiden voyage. The catch rate more than doubled the record of the previous season and, indeed, it was one of the largest catches of beluga whales ever landed in Tromsø. The new record lasted until 1905.
Captain George A. Sørensen of Tromsø had sailed as harpooner on his own ships to learn the trade and at once saw the commercial potential of the abundance of beluga whales at Spitsbergen and Novaya Zemlya. He commissioned the building of the steamer Fiskeren in Sweden, this ship being the first Norwegian owned Arctic sealer to be launched with an engine. Fiskeren was equipped for beluga whaling and enjoyed a rich kill on her maiden voyage north, returning home on 31 August 1870 with 159 beluga whales, 20 seals and cargo of blubber from a drifting dead whale.
Trafik was a passenger ship purchased by Herman Dahl of Vardø. He converted her into a combined beluga whaler and sealer and sent her to Novaya Zemlya where, unfortunately, she was lost.
The newly built beluga whaler, Alpha (T. Torkilsen), registered in Christiana (present day Oslo), was similarly lost that year on her maiden voyage to Novaya Zemlya. Beluga whaling in the waters off Svalbard seems to have been quite safe for not a single whaler was lost there during the boom years from 1868 to 1872. The waters around Novaya Zemlya, by contrast, were evidently full of dangers and at least ten vessels were damaged or wrecked there during the same period.
In the following year (1871) 16 vessels, out of a fleet of 55 that sailed from Tromsø, made the voyage to Svalbard to hunt beluga. No companies in northern Norway were capable of equipping vessels with beluga nets owing to lack of capital and enterprising northern ship owners who saw a potential in beluga whaling were obliged to find financial partners in the west the country. Thus, Sørensen, the owner of Fiskeren, went into partnership with Astrup and Knoph of Kristiansund. They equipped Fiskeren with two nets of 300 and 450 fathoms, respectively, and two casting nets of 100 fathoms in addition to two harpoon boats equipped with modern Kongsberg rifles. Fiskeren made two successful voyages to Spitsbergen in 1871, returning both times as a ‘full ship’ with 121 and 129 whales, respectively (TromsøTollsted Vaktjournal 1871).
Hilbert Pettersen, a merchant of Tromsø who owned a fleet of sealing vessels, went into partnership with a ship owner in Trondheim. Together they equipped Sophie (F. Major) with beluga seine nets and coal. Provisions were taken onboard and experienced harpooners and sailors joined the expedition in Tromsø. It was a good investment. In September that year Sofie returned from Kings Bay in Spitsbergen loaded with beluga hides and 500 barrels of blubber. It was the best catch of the season and was valued at some 5000 specie dollars (equal to approximately £120 000 in 2009) (Tromsø Stiftstidende, 11–15 June, 17 September 1871).
The financial collaboration between Tromsø merchants and west coast ship owners was generally mutually beneficial. Captain Albert M. Pettersen of Bergen, who had equipped and organised the first beluga whaling expeditions to Spitsbergen in 1868, began a close and long lasting partnership with Andreas E. Ebeltoft of Tromsø. Ebeltoft, the owner of Vendskabet, was a well-known lawyer and merchant. His account books show that he sold all kinds of goods to the Pettersen's fleet: nails, lamp glasses, meat, butter etc. His shop equipped the sailors with working clothes and he delivered telegrams to captains and paid off the crews. Once a year, at the end of each season, Captain Pettersen arrived in Tromsø in his steamer Axel and settled accounts (Ebeltoft Reference Ebeltoft1872).
The total catch in 1871 was 2 167 beluga whales compared with 1 348 in the previous year (Table 1). The industry was booming, evidenced, not least, by the number of advertisements for beluga hunting equipment in northern newspapers. Such was the enthusiasm that that same year Germania (J. Melsom), which was carrying Baron Theodor von Haugin's scientific expedition to the Russian Arctic, was equipped with beluga nets (Tromsø Stiftstidende 23 July 1872) and a group of investors in Bergen purchased the large cargo steamer Balder, intending to hunt beluga in 1872. What no one realised at the time, however, was that the peak had been reached.
The following year, 1872, was a poor year and the catch was just 898 whales. Fiskeren carried provisions and building materials to the Swedish ‘colony’ at Cape Thordsen, on Spitsbergen, before her crew started hunting beluga in late August. In early September she arrived in Tromsø and reported generally poor catches of beluga even though she and her tender had had reasonable success in killing 175 whales. It was her last year in the trade. She was subsequently converted into a passenger ship and sold. Hvidfisken (J. Eliassen) also had a successful season, managing to kill 185 belugas, 10 bearded seal, 1 polar bear, 22 reindeer and to gather 60 kg of eiderdown. However, most of the other vessels engaged in beluga whaling suffered heavy losses that year.
1873 was worse. The total catch fell to 288 and most beluga whalers returned home ‘clean’. Captain Albert Pettersen, who had started the beluga whaling boom in 1868, saw his vessels Elida (O.B. Tellefsen) and Spitsbergen (R. Halvorsen) return home ‘clean’ while Skjoldmøen (M. Ingebrigtsen) returned with only six whales. The boom was over. Thereafter just two Tromsø vessels continued to catch belugas with nets and this desultory effort continued until World War I.
The Tromsø fleet killed not fewer than 5500 beluga whales at Svalbard and Novaya Zemlya during the period 1868 to 1873 and the precipitous decline in hunting success is strong evidence that the population was severely depleted by this onslaught.
The first depression and the search for new hunting grounds: 1873–1875
The netting of belugas and the new walrus grounds at Novaya Zemlya brought wealth and resulted in the rapid expansion of the northern fleet. Considering Tromsø alone, the number of vessels that departed north from the port each summer increased from just 23 in 1869 to 55 in 1871 (Table 1). Likewise, 29 vessels departed the ports of Hammerfest and Alta in 1869 and 1870 compared with 17 in 1868. But by 1874 the Tromsø fleet was reduced to 18 vessels (Table 1). The effective plundering of the stocks of walrus and beluga brought commercial success to an abrupt halt. A contributory factor in the contraction of the Arctic fleet may have been a disaster in 1872 when ten vessels and 20 men were lost. Several masters abandoned the northern ice for three seasons (1873 to 1875) and sailed their vessels as coastal freighters instead. Others continued to search for new hunting grounds.
Sealing had been maintained at a steady level throughout the walrus and beluga boom years and now in 1873, with the latter depleted, Nordland (Edvard H. Johannesen) and the German sealer Strømman (Magnus Arnesen), which had a crew from Tromsø, began sealing at Jan Mayen, an area which the northern fleet Norway had hardly visited since 1865. They both returned home with good catches (Tromsø Tollsted Vaktjournal 1873). The following year Edvard Johannessen discovered harp seal pupping sites on the ice in the Denmark Strait and from 1876 this area became the bulwark of the trade for years to come (Giæver Reference Giæver1939). The Tegetthof expedition, which had sailed from Tromsø on 13 July 1872 (Holland 1994: 290), likewise discovered a new sealing ground at Zemlya Frantsa-Iosifa.
Karl Pettersen, a geologist who in 1872 became the director of the new Tromsø Museum, had observed the rise of the northern fleet through the late 1860s and early 1870s. In 1871 he wrote a series of articles in Tromsø Stiftstidende, summarising the recent development and arguing that the field of operation had to expand either in the ice between Svalbard and Novaya Zemlya or west to northeast Greenland, lest stocks of marine mammals in the existing hunting grounds become depleted. ‘The increasing number of expeditions to Spitsbergen and eastward will soon deplete the stock there because of overharvesting for some time. These fields should rest for a period of time.’ ‘Conservation of all animals at Spitsbergen has to be considered, with the exception of beluga whales’ (Tromsø Stiftstidende 12 January 1871). Pettersen emphasised the importance of the new industry for the coastal people of northern Norway. He realised that hunting expeditions of the kind typical of the southern fleet, which involved large ice strengthened ships that sailed to Jan Mayen, were too costly for northern merchants. He predicted, accurately, that the northern fleet would continue to reply on small but seaworthy vessels. Above all, he urged exploration for new hunting grounds and suggested that the Royal Norwegian Navy should co-operate with scientific expeditions in this. He proposed three areas of exploration: the waters east of Novaya Zemlya, the coast of the Russian Arctic as far east as the mouth of the River Ob and the waters between and north of Svalbard and Novaya Zemlya.
Pettersen's predictions were largely correct and, following the depletion of stocks of walrus and seals at Novaya Zemlya, the northern fleet began to spread its effort to Vestisen, Østisen, Zemlya Frantsa-Iosifa and Greenland (Figs. 1a, 1b). New sealing grounds were found, not by the navy or by any scientific expedition, but by the fleet itself.
The cod years: 1874–1882
In 1876, the sealing master Fritz Mack of Tromsø wrote to Benjamin Leigh Smith that ‘[t]here is a new and growing interest in combining sealing with fishing for cod’ (Mack Reference Mack1876).
The interval of nine years from 1874 to 1882 is the most clearly defined period in the entire half century considered here. These were the ‘cod years’ which were marked by an irruption of interest in cod fishing in the waters off the west coast of Spitsbergen and an equally abrupt collapse of the fishery.
Its beginning was remarkable. In 1861 the sealing master Karl Johan ‘Janni’ Årstrøm was amazed to find a large cod in the mouth of a seal he had just shot near Sydkapp, the most southerly point of Spitsbergen (Moberg Reference Moberg1930). Three years later, however, Nordenskiöld's expedition observed no cod in the waters off western Spitsbergen. But then, early in September 1874, the fishing vessel Søvig (Olauf Mæhle) arrived in Tromsø from Spitsbergen with 19000 salted and 2000 unsalted cod and 160 kg eiderdown. This was the first recorded substantial catch of cod made in the coastal waters off Spitsbergen. The customs records show that just two weeks later the beluga whaler Hvidfisken (J. Eliassen) returned to Tromsø with 10000 salted cod in addition to a more familiar cargo consisting of 21 beluga whales, 40 seals, 10 reindeer and 160 kg eiderdown (Tromsø Tollsted Vaktjournal 1874). The coastal freighter Amoline (A. Stenersen), which had sailed north primarily to hunt reindeer and gather eiderdown, returned with 60 reindeer, 12 seals, 200 kg eiderdown and also 6500 salted cod. The catches of cod were unprecedented and indicate the versatility of skippers and crews alike.
News spread quickly and in April 1875 Professor Henrik Mohn asked Karl Pettersen of the Tromsø Museum for information about ice pilots, crews and the new cod fishing ground at Spitsbergen. Pettersen's report, dated 18 April 1875, stated that the cod fishing season lasted from middle of June until September and included data on the average size of the fish and the average catch per vessel. He also mentioned a new halibut ground that had recently been discovered in Isfjord on the west coast of Spitsbergen (Pettersen Reference Pettersen1875). Mohn's expedition, Den Norske Nordhavs ekspedisjon 1876–1878 [The Norwegian northern sea investigation 1876–1878] subsequently sailed from Bergen to the west coast of Spitsbergen in both 1876 and 1877 onboard Vøringen (Miller) to investigate the cod and halibut fishery.
By 1876 the annual catch exceeded 300000 cod as fishing vessels from all over Norway sailed to Spitsbergen to take their share of the rich harvest. The richest fishery was in the fjords along the west coast of Spitsbergen including Bellsund, Forlandsundet, Isfjorden, Kongsfjorden [King's Bay] and Raudfjorden [Red Bay] (Marie 1880; Pettersen Reference Pettersen1875). The idea of combining cod fishing with various forms of hunting quickly became popular. Thus, the typical catch included 10000–30000 cod, which were salted onboard, cod liver stored in barrels and also 20–100 seals (Mack Reference Mack1876). On 18 August 1876, Captain Carl F. Wisløff of Springeren wrote from Bellsund, Spitsbergen, to his ship's owner in Ålesund to say that he had had little success thus far owing to difficult ice conditions and a storm but that he intended stay for a further three weeks because ‘[t]he best hunting . . . has not started yet’ (Wisløff Reference Wisløff1876). He was probably referring to hunting reindeer. In the meantime he assured his owner that his vessel carried a cargo of 30 beluga whales, 55 reindeer, 8 seals, two barrels crammed full with eiderdown, 90 barrels of blubber and 3 000 cod. Amalie (I. Ingebrigtsen) returned home with a catch of 21 bearded seals, 100 kg of eiderdown and 3000 salted cod. The catches of seals mentioned in these reports is modest compared with the catches returned in later years (see below) but they are typical of the time; the rate specified for sealing sloops in contemporary customs’ reports was normally in the order of 50 to 200 bearded seals per ship (Tromsø Tollsted Vaktjournal 1861–1883).
So rich did the Spitsbergen cod fishery prove that the former beluga whaler Spitsbergen (R. Halvorsen) returned to Spitsbergen in 1879 but not as a whaler. Instead, she delivered salt and provisions to fishing vessels. Halvorsen purchased salted cod from the fleet and returned to the west coast of Norway where he sold it.
The combined approach, in which cod fishing crews in fact took whatever they could find, continued and many vessels returned home with richly mixed catches. In 1880 the master of the sealer Marie, Knud Johnsen, recorded a method of hunting employed on the west coast of Spitsbergen in which two small hunting boats went out every day, returning to ship the each evening loaded with cod, seals, reindeer, eiderdown and eggs. Marie returned home at the end of the season with 28000 cod, 35 barrels of cod liver, 19 reindeer, 20 kg eiderdown and 8 barrels of eggs and (Marie 1880). Olaf (O. Grødahl) returned home the same year with 11000 cod, 12 seals and 210 reindeer. In October 1881 the newspaper Aalesund Avis reported that the sloops Haabet and Aurora had returned to the west coast port directly from Spitsbergen with 10000 cod each while the smacks Prindsen and Festermøen unloaded 7000 and 8000 cod, respectively; Gideon and Elida, meanwhile, delivered ‘76 beluga whales, some eiderdown and reindeer meat’ (Tromsø Stiftstidende, 23 October 1881).
The following year, 1882, Captain Palmer of the Swedish expedition ship Urd reported seeing 17 to 20 fishing vessels in Isfjord and also that his doctor had amputated a fisherman's arm. He himself had had time to shoot reindeer. The catch of cod that year was lower than in the previous one but was still vast, with 243000 fish declared on arrival in Tromsø. The following year, 1883, the catch was negligible: the cod seemed to have disappeared from Spitsbergen and the entire cod fleet returned home virtually ‘clean’. A fisheries journal reported that ‘only a few hundred cod were caught’ that year (Norsk Fiskertidende 1884: 55). An era had passed.
As a postscript to this account, it should be pointed out that the Svalbard cod fishery was far richer than the figures describing the catch of the Tromsø fleet alone indicate. Between the years 1878 and 1883 a substantial number of vessels from the west coast of Norway also fished cod there. These also took beluga whales, hunted reindeer and gathered eiderdown. No sources have been found specifying the number of cod taken but ship logs and newspaper reports indicate that the west coast fleet also represented a major commercial operation.
The persecution of Svalbard reindeer 1867–1882
The walrus and beluga years of 1867 to 1873 marked the first really heavy harvesting of Svalbard reindeer with the numbers reported taken approaching 1000 each year 1868 to 1870 (Table 1). The number of reindeer on Spitsbergen at that time is not known but the current (2009) population is around 7000 animals. Even if there were twice as many as that in the 1870s, which seems unlikely, 1000 animals killed per year would represent a substantial rate of harvest. In fact, however, the records of numbers taken are probably conservative: it is likely that then, as later, many animals were shot and consumed at once and hence never reported (see below). The annual harvest of reindeer declined from 1871 in parallel with the declining catches of walrus and beluga. The decline was probably a consequence of the combination of depleted stocks and reduced hunting effort as the number of vessels that sailed north each season fell sharply away (Table 1).
Steady pressure was maintained on the stock of reindeer on Spitsbergen during the cod years (Bjørvig circa Reference Bjørvig1890; Table 1). The crews regularly went ashore to hunt reindeer and although the recorded kill in the cod years 1874 to 1882 was lower (3784) compared with the preceding nine years (1865 to 1873, 4620) (Table 1) the figures are once again almost certainly substantially underestimated. In 1873, for example, the Elida returned to Tromsø with no beluga, her intended quarry, but, according to the diary of O.B. Tellefsen, her skipper, the crew had gathered a lot of eiderdown and many eggs and shot a large number of reindeer none of which were entered into official records. Everyone seems to have hunted reindeer but, as with cod (see above), no figures seem to exist for the number killed by the crews of the west coast fleet, though they would almost certainly have been substantial. This is confirm by Gunnar Isachsen, Svalbard veteran and subsequently director of the Maritime Museum in Oslo, who noted that:
During the cod fishing era at Spitsbergen from 1870 to 1880? there was considerable pressure on the reindeer population up there, perhaps even more so than today (Isachsen Reference Isachsen1919).
Most convincingly of all, Wollebaek (Reference Wollebaek1926) reported that:
. . . besides the reindeer which have been brought to ports in the north of Norway, a considerable number have been shot for local consumption, – one may reckon at least a couple of hundred a year up to 1920.
He went on to state that:
[t]here is only a single year in all the time Norwegians have hunted on Spitsbergen, i.e. for over a hundred years, that so many reindeer have been killed as in 1918; this was in the year 1878, when 1491 animals were killed.
His figure of 1491 reindeer in 1878 is slightly more than twice the author's figure which is 702 (Table 1). Thus, there is every reason to suspect that Svalbard reindeer were even more heavily persecuted during the latter half of the 19th century than the official record suggests.
The second depression 1883 and 1884
1883 and 1884 were difficult ice years and the ice that choked the Kara Sea likewise froze the dream of a sea route between western Europe and the Russian Arctic (Kjaer Reference Kjær2005: 356).
Most of the 32 vessels that departed Tromsø in 1883 headed north to go cod fishing off the west coast of Spitsbergen. Five of these subsequently returned home in June ‘clean’ and the ships which sailed north with cargoes to salt to sell to the cod fleet, with the intention of purchasing salted cod, also returned home with their cargoes intact. The cod fishing crews had plenty of time to gather eiderdown and the harvest of 907 kg that year was greater than in the previous two years combined (Fig. 4). Others turned to fishing for shark.
In 1884 the fleet was reduced to 24 vessels, three of which were lost in the ice north of Spitsbergen. But there was some success. Those vessels which hunted seals in the pack ice off Bjørnøya made good catches: the 1884 season was the first in which the fleet killed more then 10000 seals and it marked the true beginning of sealing as an industry that carried well into the following century.
Revival: guns, seals, polar bears and bottlenose whales
In the quarter century from 1884 to 1909 the annual catch of seals by the Tromsø Arctic fleet rose from 10000 to more then 34000 animals; the cumulative catch across those years was slightly over half a million seals (Table 1). The reasons for this development included the single minded focus on seals in the absence of alternative prey, the replacement of harpoons with rifles and the rapid improvement in the quality of both these and of the ammunition they used, and an expansion of activity to hunting grounds off northeast Greenland and Zemlya Frantsa-Iosifa.
In the early years, walrus and bearded seals, both of which are physically very large species, were principal quarry. In 1876, however, the custom office record books recorded for the first time a catch that included more ‘seals’ than ‘bearded seals’. What species the entry ‘seals’ referred to is not specified but it was most likely to have been either hooded or harp seals or both. Hunting for hooded seals in the Denmark Strait started that year and harp seals were regularly taken in the White Sea. The annual catch of bearded seals declined to very low numbers in the following years while the fleet killed more and more hooded and harp seals.
In late 1880s the single loading Remington rifle was largely replaced by the Norwegian Jarmann which was a repeating rifle with a magazine holding eight cartridges. Other improvements followed. There was a heavy tax on imported rifles but, in the curious manner of customs regulations the world over, spare parts could be imported duty free. Norwegian gunsmiths capitalised on this and designed their own rifles which they assembled using imported spare parts mainly from Belgium (K.E. Hanevik, personal communication, January 2009). The gunsmith Andresen of Tromsø employed 20 men building rifles mainly for the sealing trade using spare parts imported from Belgium and Germany (Svein Andresen, personal communication, January 2009). Another popular weapon was the Norwegian Krag Jørgensen rifle that was originally produced for the military. Some of these were modified to take a heavier calibre bullet and from 1895 the Krag Jørgensen hunting rifle became the leading sealing gun. These hunting rifles were selected by Fridtjof Nansen for the Fram expedition 1893–1896 (Hanevik Reference Hanevik1998). Jarmann, too, began to produce special rifles and spring guns for polar bear traps (Hanevik Reference Hanevik1998). Nor did Remington rifles disappear completely; between 1905 and 1913 the Norwegian army sold 30000 surplus Remingtons to private persons and these were particularly popular among sealers who used them for hunting reindeer (Hanevik Reference Hanevik1998).
The quality of ammunition, too, improved considerably. In 1867 brass cartridges were adopted by the Swedish-Norwegian Army. They had been developed during the American civil war to replace of the old waxed paper cartridge which never tolerated damp properly (Nielsen Reference Nielsen1970). Brass cartridges were expensive but could be reloaded. When in 1872–1873 the sealer Freya of Tromsø was forced to overwinter at Novaya Zemlya, Jacob Tobiesen, son of the ship's master, recorded in his diary that the crew spent a great deal of time reloading cartridges (Tobiesen Reference Tobiesen1873). In 1889 Captain Edvard H. Johannesen of the sealer Colibri traded with local Nenets. They purchased his Remington rifles and placed an order for the next season that included brass cartridges, metal bars from which to make (probably exceedingly erratic) bullets, gun powder and percussion caps (Colibri 1889). In 1894 the Swedish ammunition firm Norma opened a branch in Christiania and designed special ammunition for sealing. Many crews, however, preferred, like the Nenets, to buy gunpowder, percussion caps and bullets and load their own cartridges.
In 1909, the last year of the present analysis, a Tromsø fleet numbering 46 vessels recorded its highest catch of seals (34000) (Fig. 3) and the fleet and overwintering trappers together delivered skins of 474 dead polar bears and 26 live bears, pelts of 524 Arctic foxes, hides of 26 walrus, 93 bottlenose whales, 56 beluga whales and two narwhals, carcasses of 424 reindeer, 16 muskoxen, 2256 kg eiderdown and 6955 barrels of blubber. This wealth bringing massacre was made possible by the development of better guns and better ammunition. By this time, most sealing masters each had their own favourite sealing ground (Moderen 1894–1907; Freya 1883–1884; Isbjørnen 1893–1900). The western and eastern ice were used chiefly by the fleet of northern Norway, while the ice off northeast Greenland and in the Denmark Strait was gradually dominated by vessels from ports on the west coast of Norway.
Polar bears were frequently caught by sealing fleet crews although from 1894 greater numbers were taken by wintering expeditions. In 1895 the first planned wintering expedition, which was led by Martin Ekroll, returned to Hammerfest and delivered a harvest of 62 polar bear hides. In 1897 Victoria of London, sealing out of Tromsø, returned with 56 polar bear hides and two live polar bears from Kong Karls Land. This was the largest harvest of polar bears ever recorded by a single sealing vessel in one year. The following year, 1898, some vessels headed for Kong Karls Land while others, such as Anna, Søstrene and Cecilie Malene, sailed to the coast of Greenland and hunted polar bears there. These vessels killed 54 bears. The total recorded kill by the fleet that year reached its short lived peak of 375 animals in a single season (Table 1). By contrast, most of 525 polar bear skins delivered in 1903 to a tannery in Tromsø came from bears killed by wintering trappers. 363 bears out of a total of 442 killed in 1909 were taken by trappers on Svalbard.
In July 1866 the shark fishing vessel Elisa, towed a strange animal into Tromsø harbour. It turned out to be a bottlenose whale. The skeleton of this unfortunate whale was sold to Bergen Museum for 106 specie dollars, equivalent to £2600 in 2008 (Tromsø Stiftstidende, 19 July 1866). Bottlenose whaling proper was started in late 1870s by the Scots. The southern Norwegian fleet first caught the bottlenose whales in 1883. Aside from the Elisa incident, the first record of bottlenoses taken by the northern fleet dates from 18 August 1887 when Hvidfisken, captained by Morten Ingebrigtsen, returned to Tromsø with 12 bottlenose whales, 83 beluga whales, 20 seals, 180 kg eiderdown and 12 reindeer. This was such an unusual event that the scribe who recorded it in the custom office record book also noted that bottlenose was a kind of whale.
Ingebrigtsen was the only skipper in northern fleet who hunted bottlenose whales in the years up to 1890. Indeed, it was he who started bottlenose whaling in northern Norway. In February 1892 he purchased an old diving vessel and had her refitted as a modern steam whaler and started to hunt large whales that year. In polar literature sealers have often incorrectly been referred to as whalers. Setting aside sealing vessels that were also used to hunt bottlenose whales, there were, in fact, no whalers in the northern fleet between 1859 and 1909 with the exception of Ingebrigtsen. Nobody in all Norway caught as many large whales as Ingebrigtsen. In 1899 alone he killed 99 whales, mostly blue whales and finbacks. He also continued his interest in sealing and in 1917, aged 70, he commissioned the building of a new sealer which he named Foca 1. This ship he subsequently sold to Sir Ernest Shackleton who named her Quest.
By 1890 Ingebrigtsen had developed a pattern of activity that lasted up to World War I. This involved vessels sailing to the bottlenose ground southeast off Jan Mayen early in May and returning with their catch of whales in July. As soon the cargo was discharged the ships set off for Svalbard from where they returned in September with a mixed catch of belugas, seals, reindeer and eiderdown. This lengthening of the season by sailing out in early May was mostly practiced by the vessels which subsequently hunted beluga whales with nets (Diana 1892). There was usually some ice left in the fjords on the west coast of Spitsbergen when they arrived in May and early June and the crews hunted reindeer and gathered eiderdown while they waited for the fjords to clear sufficiently that they could put out their nets (Tellefsen Reference Tellefsen1873; Mack Reference Mack1873; Anna 1895).
Bottlenose whalers had a harpoon cannon bolted to the deck in the bows. Attached to the harpoon was 1000 m of rope neatly coiled in a barrel. The sloop Diana was the second vessel so equipped. In 1892, when she was about to sail, Captain Svendsen fired a trial shot. The cannon backfired, ripped off the port side railing and injured the master who, two days later was ‘able to get out of bed without help’ (Diana 1892).
A bottlenose whale yielded 10 barrels of fine oil (Norsk Fiskeritidende 1904: 31). Bottlenose oil became an important raw material in the pharmaceutical industry and was also used as spindle oil for fine instruments, lighthouse oil and to make high quality candles (Kjær 2007). In 1885, Arctic spermaceti oil, as the product was called, was sold at NOK 34.50 a barrel, equivalent to approximately £222 in 2008 (Kjaer Reference Kjær2008: 267). The price of bottlenose oil rose rapidly until 1904 ‘when it drastically fell and most vessels suffered heavy losses’ (Kjær Reference Kjær2008).
Walrus massacres
The heavy slaughter of walrus at Svalbard and Novaya Zemlya in the 1860s and early 1870s seem to have resulted in a depletion of stocks of this species at both sites (see above). All the more surprising, therefore, must it have been for the Tromsø crews who repeatedly stumbled across, and successfully killed, huge herds of the animals starting as early as 14 years later.
In August 1886 the Tromsø sloops Gjøa (Hans C. Johannsen), Berntine (N. Johnsen), Flora (B. Jensen), Eliezer (H. Andreassen), Isbjørnen (A. Stenersen) and William (G. Sørensen) and the Hammerfest sloop Frøya (A. Jacobsen) sailed in convoy to the waters north of Nordaustlandet. The six Tromsø vessels had already been sealing along the west coast of Spitsbergen; Jacobsen sailed Frøya directly up from Hammerfest, on her second voyage of the season, with the specific intention of hunting walrus. Ole Hansen, an able seaman onboard the Frøya, who himself became a well known sealing master, recorded ‘the great walrus kill’ that the seven vessels achieved. The following information is mainly based on Hansen (Reference Hansen1912).
The seven vessels rounded Kapp Platen where they met ice but Jacobsen of Frøya found a lead and continued eastward. Shortly after Frøya rounded Kapp Leigh-Smith, a harpooner reported from the crow's nest that he saw hundreds of walrus in the water ahead. Frøya anchored. The harpooners were keen to begin. Jacobsen gave permission for them to put out boats and go on ahead to explore, though on condition that not a single shot was fired and that they killed animals with harpoons only. He proposed a joint attack and wished to discuss his plan with the other skippers. A flag was hoisted on a harpoon shaft and soon the other vessels responded by hoisting flags and one by one they approached Frøya. Berntine first arrived and moored alongside. By this time Frøya's boats returned with 18 walrus. Johnsen of Berntine suggested that they should arm the crew with rifles and start hunting right away. He saw more than 200 walrus ashore and even more in the water. Jacobsen persuaded him to wait for Andreassen of Eliezer and the other sealers and ordered his own crew to remain onboard.
Andreassen, who had participated in the massacre on Storøya in 1864, was the oldest and most experienced master in the party. ‘He was appointed General for the killing that they planned for the following morning’ (Hansen Reference Hansen1912). The vessels anchored some distance from the beach but still sufficiently close that the herd could be observed from the crow's nests. Each man was equipped with a lance and the rest of the day the crews honed and polished their weapons which Andreassen then inspected. Watches were kept from the crow's nests night and day to report any significant change in the distribution of the animals on the beach. That evening Andreassen told the men that there were more than 500 walrus hauled out on the beach with yet more in the water. He warned them to get good night's sleep and to be fit and ready for action early in the morning.
The men turned out at 5 am and all the hunting boats gathered around Eliezer on board which each man received a dram before they started to row quietly towards the beach. ‘Our boats slipped forwards like ghost-ships’ (Hansen Reference Hansen1912). The men landed on the beach and formed a semi-circular phalanx. On Andreassen's order they marched forward stabbing the sleeping animals with their lances. Soon all the animals at the water's edge were killed and their carcasses formed a barrier that prevented the others from escaping into the water. Some 870 walrus were killed at Storøya that day.
It took two days to flense the carcasses. Andreassen wanted to leave as soon as his crew had carried some 70 hides and blubber onboard. It was understandable. He had seen both vessels crushed by ice at the same place in 1864 and had been the master of Svanen, one of the six ships lost at Graahuken in 1872. This time, however, there was no difficulty and all the ships returned home safely. The six Tromsø vessels landed 730 of the total of 799 walrus hides recorded that year. Frøya was the last vessel to leave Storøya. 23 polar bears had approached the crew while they worked on the beach. Jacobsen sailed Frøya home with 143 walrus and 23 polar bear hides and each member of the crew had one reindeer and 800 eggs to take home as a bonus.
The following year (1887) the catch was even greater. The Tromsø fleet landed 939 walrus hides. These animals were mostly taken at Syvøyane, north of Nordaustlandet and mostly by the vessels which carried out the slaughter the previous year (Rivalen 1887). Perhaps not very surprisingly, notwithstanding large catches in 1890 (418 walrus) and 1898 (528 walrus) (Table 1), over the next 20 years the kill of walrus dwindled almost to nothing.
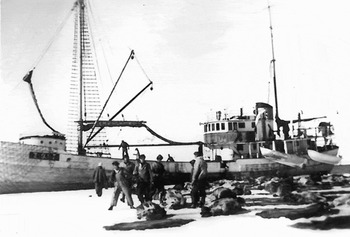
Two other massacres of walrus are recorded in the annals of Norwegian Arctic hunting. Both were carried out by the crew of Polarquest of Bodø captained by Ludolf Schjelderup. Polarquest was the successor of Quest, a ship famous from Sir Ernest Shackleton's last expedition. Quest had returned to Norwegian ownership in 1923 and had made a lot of money for Schjelderup, her new owner, who sailed her as a commercial sealer and scientific expedition ship (Erskine and Kjær Reference Erskine and Kjær1998). Schjelderup commissioned a new sealer, Polarquest. She was launched in 1949 too late for the Newfoundland sealing so Schjelderup sailed her instead to northwest Greenland. Here her crew killed 623 walrus in Baffin Bay. Two years later, again under Schjelderup's command, she returned to Baffin Bay and continued to Smith Sound where 1175 walrus were despatched (Fig. 7). The unfortunate animals were caught by harpoons or stabbed with lances and then shot. The following year the walrus was declared a protected species.
Norwegians massacre walruses. A slaughter in 1951 when the crew of the sealer Polarquest killed 1175 walrus in Baffin Bay and Smith Sound. Photograph courtesy of Alester Hansen, Bodø.

Recycling ships
Few 19th century sealing masters and merchants in northern Norway had sufficient capital to commission new ships. They were thrifty people and, reflecting this, the northern fleet included many recycled vessels. Among these were foreign freighters and vessels from western Norway that had been damaged, condemned or even wrecked and abandoned but which had subsequently been salvaged or sold, refurbished and put into Arctic service. Examples of 12 such are given here.
In 1855 a capsized ship was found drifting in the sea outside Tromsø. It was the brig Renen, a sealer of Tønsberg, which had been lost in the Vestisen [the western ice] in 1851. The vessel was towed to Tromsø and sold to a newly established shipyard. Local merchants saw potential in the wreck and had it restored, refitted and equipped for sealing. The refurbished vessel was renamed Jan Mayen and in 1863, captained by Carlsen, she made the first ever circumnavigation of Svalbard. Jan Mayen was the only brig in the northern fleet and, as such, she carried a crew of 27 compared with between 6 and 14 men on the sloops and ketches. Due perhaps in part to her large size she was not a commercial success.
The sloop Gjøa, the first ship to make a complete transit of the northwest passage, was also a recycled vessel. She was built in 1872 and had sailed as a coastal freighter until she was wrecked off the Lofoten Islands in 1882 (Kjær Reference Kjær2005). The wreck was purchased by Captain Hans C. Johannesen the following year for NOK 700 (equal to £3900 in 2007). The new owner had her repaired and converted into a vessel fit for service in the Arctic Ocean. Gjøa sailed successfully as a sealer annually for 18 years, captained by her new owner, before she was sold to Roald Amundsen in 1901 for her epic journey through the Canadian Arctic archipelago.
The sealing sloop Avance, which became Baron von Pleussen's expedition vessel on a voyage to Spitsbergen in 1894, joined the fleet in 1891. Her ship's papers, dated 12 November 1894, provide no information about her but mention that ‘she was wrecked 12–15 years ago’ (Tromsø Tollsted Skipsregister 1894).
The sloops Søstrene and Thora den Blide, both from the west coast of Norway, sailed as coastal freighters until in April 1885 they were wrecked off Berlevåg at the very north of Norway in a storm. Both vessels were subsequently salvaged and repaired and both became well known sealers in the northern fleet. In 1896 Søstrene (S. Bottolfsen) was the first vessel to speak with Nansen's Fram as the latter returned from her epic three year voyage across the Arctic Ocean. That same year Helmer Hansen of Tromsø, subsequently a member of Amundsen's South Pole party, started his carrier as an able seamen onboard Thora den Blide.
Between 1880 and 1909 Serine, Petrel, Maria, Marie and Haabet were all wrecked and abandoned at Spitsbergen after a violent impacts with ice. In each case men sailed north to salvage the wrecks. Each was patched up in situ and then towed or sailed home. All five subsequently returned to service in the ice.
The schooners Axel Thordsen and Skjøn Walborg were built in 1810 by the Danish-Norwegian Navy and originally served as gunboats during the Napoleonic Wars. In 1863 the Swedish-Norwegian Navy decided that they should be broken up but Hilbert Pettersen, a merchant of Tromsø, purchased both vessels and converted them Arctic service (Kjær Reference Kjær2006). Axel Thordsen was Nordenskiöld's expedition ship in 1864 while in 1870 the Skjøn Walborg was Graf Waldburg-Zeil's and Baron von Heuglin's expedition ship (Holland 1994: 281).
British fishing vessels for sale
Another way of replacing the ships of the northern fleet at relatively low cost was to purchase outdated vessels abroad. One of the first of these was Angelus which joined the sealing fleet in 1896. Originally an English fishing cutter, she was bought by the sealing master Arne Eikrem of Tromsø. Angelus was strongly built and, after a short career as a sealer, she sailed for several decades as a freighter. It was a start of an era. The masters of the northern fleet saw the potential in strongly built British herring fishing vessels of some 70 to 80 ft. The British herring fishing fleet was converting from sail to steam and old sailing vessels, built in England between 1864 and 1888, were probably purchased quite cheaply. Sealing masters of Tromsø and Hammerfest travelled to Hull and returned home in their newly purchased vessels loaded with cargoes of Newcastle coal. Once home, they converted their ships for Arctic service and later, from 1906, installed engines in many of them.
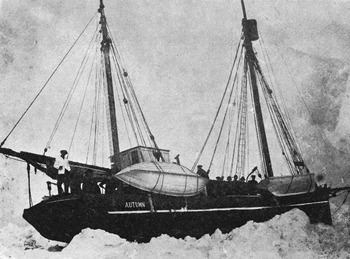
By 1905 some 25 former British fishing vessels formed the core of a new generation of sealers in the northern fleet. Several, though now registered in Norway, kept their original names. Hence at the turn of the century several Norwegian sealers bore names like Autumn (Fig. 8), Dependent, Excelsior, Onward, Queen of the Fleet, Rescue, Severn, Stairs, Success, Wildflower and William Butt. Many of them sailed annually on sealing voyages but gradually they were lost. Several were among 47 Norwegian vessels wrecked in the swallow waters of the White Sea between 1924 and 1929 (Kjær and Sefland Reference Kjær and Sefland2005). Queen of the Fleet and Wildflower, however, survived and sailed as coastal freighters until the 1960s.
The ketch rigged sealer Autumn squeezed in the ice some time before 1929. From 1905 former British fishing vessels became the basis of a new generation of sealers some of which, like Autumn, kept their original names.

The British vessels were 10–15 ft longer and could carry some 12–20 tons more cargo and provisions than the sloops. Moreover, unlike the sloops that had only one mast, they were ketch rigged and were presumably better sailing vessels. At turn of the century several sealing sloops changed to ketch rig by erecting a mizzen mast at the stern. The ‘sloop ketch’ rig had significant advantages. They were steadier at sea under sail or motor power, at anchor and even when moored to an ice floe (Ragnar Klevaas, personal communication, February 2009). Every one of a new generation of strongly built ice-going steam and diesel sealers launched after 1919 was ketch rigged.
From sail to steam, from steam to sail, from sail to oil
The steam era in the Arctic Ocean began in May 1869 when Diana (Carl Iversen) of Glasgow, owned by the Arctic explorer Sir James Lamont, departed from Tromsø on a voyage to Svalbard and Novaya Zemlya (Holland 1994: 279). A few days later the German steam sealer Albert (A. Hagman) arrived at Amsterdamøya off northwest Spitsbergen.
The use of steam power was quickly adopted by innovative Norwegians although only tentatively at first. Thus, in the following year (1870) three Norwegian owned steam ships sailed to Svalbard for the first time; these were Spitsbergen, the smack Fiskeren and Trafik, all of which were equipped for beluga whaling (see above). Trafik was lost on her maiden voyage while Fiskeren was sold in 1873 and subsequently sailed as passenger ship between Christiania and Trondheim. Her master and owner, Captain G. Sørensen of Tromsø, returned to sail. He purchased the sloop Aurora and continued in the sealing trade for another 15 years. Spitsbergen was also withdrawn from beluga whaling and sealing and continued her career as a freighter.
Other steamers joined the fleet in the following two seasons but the flirtation with steam did not last. Few sealers had sufficient space to carry more that some 200 barrels of coal (Tromsø Stiftstidende, 15 Sept. 1872). Hence, they were obliged to stop sealing periodically and to land in Isfjord on the west coast of Spitsbergen where the crews dug coal from the vast reserves exposed in the hillsides, and then carried it all down to the shore in barrels (Hoel Reference Hoel1958).
Interest in steam was briefly revived 30 years later when, in 1903, a steam sealer sailed from Tromsø to Spitsbergen. She was the ketch rigged Victoria owned by the British explorer Arnold Pike and she was the largest vessel in the northern Norwegian fleet that year. Remarkable as this was for the northern fleet, all the large ice going vessels of the southern Norwegian fleet had converted to steam by then.
1906 marked the start of the oil era. In March that year the sealer Syvende Juni of Hammerfest had a 16 hp Alfa two stroke engine installed at a yard in Tromsø. This engine gave her a top speed of 4.5 knots. She was the first sealer in the northern fleet so equipped. Syvende Juni was originally a British fishing vessel named Rothiemay that had been built in Brixham in 1884. She was sold to Norway in 1905 and was equipped for sealing. This included having blubber containers installed. These containers, which had a capacity of 550 barrels, were the first of their kind in Norway. Another Hammerfest vessel, the newly launched Union, had a 16 hp Alfa motor installed a few weeks later, just in time for that year's season. Immediately the season was ended the sealers Søstrene (a recycled freighter) and Autumn (another former British fishing vessel) had 20 hp Alpha engines installed (Tromsøposten, 4 December 1906).
In another pioneering step, the sealer Severn of Tromsø (yet another former British fishing vessel) had a 1.5 hp Alfa motor installed in one of her hunting boats. This was to enable the boat to tow the other hunting boats out to the killing fields, hence expanding their total daily range. One journalist commented ‘[o]ther sealing masters have seen the potential in such equipment and are considering such an investment’ (Tromsøposten 14 March 1906). By 1913 the entire fleet had changed from sail to oil.
These early hot bulb engines were small, weak and unreliable and sail remained the principal means of propulsion for most vessels. They sailed whenever they could but started their engines in calm weather. The usefulness of the engines was much exaggerated and they frequently broke down. Waldemar Kræmer, the master of the sealer Autumn between 1906 and 1909, recorded in his diary how her engine often suffered mechanical failure and how he had a box of spare parts including 8 hot bulbs (Kræmer Reference Kræmer1916). In 1906, Autumn (S. Kræmer) which had recently had an engine installed, was chartered to relieve a party of trappers which had overwintered on Edgeøya. She failed to relieve them because her engine broke down and the master and his engineer constantly disagreed about how to repair it. Fortunately for the trappers the little sloop Elida (45 ft) was nearby and succeeded in rescuing them (Bengtssen Reference Bengtssen1906).
The squabbling on Autumn was typical. In those days few engineers on sealers had any mechanical training. Sailors with even a smattering of knowledge of mechanics signed on as engineers and it was not uncommon for them to end up quarrelling with their ship's master (Autumn 1907). In 1889 Stortinget [Parliament] in Christiania attempted to rectify this situation by passing a bill, sponsored by the prime minister himself, which required engineers on steam ships to have a minimum of professional training. Somewhat perversely this legislation was strongly opposed by the owners and masters of whaling and sealing vessels who argued that it would be too expensive to have trained engineers onboard (Stortingstidende 1889).
Legislation evolved, as it inexorably does, with major steps being taken almost 20 years later. The first was the establishment of rules for masters of Arctic steamers. A law of 7 April 1906, effective from 1 January 1907, required that masters of steam propelled fishing vessels or sealers or whalers of between 25 and 200 gross tons, had to have passed a course at navigation school. Minimum qualifications for admission included having passed the age of 21 years and having spent 30 months at sea since the age of 15 of which not less than 12 months must have been on steamers. Masters who took and passed the course were permitted to navigate their vessels into domestic and foreign ports provided they were engaged in fishing, sealing or whaling (Tromsø Stiftstidende, 3 March 1907). A second major step was the passing of a law which required that sealers be passed seaworthy before sailing north and that each crew member be examined by a doctor before signing on (Tromsø Stiftstidende 11 April 1907).
Expansion of the sealing grounds
The transformation from sail to oil had little influence on the expansion of the sealing grounds. With the exception of Zemlya Frantsa-Iosifa, to which the northern fleet first sailed in 1908, there was no expansion to new areas during the period from 1906 to 1913 when the fleet was changing from sail to oil.
By 1865 the then small Tromsø fleet (Table 1) had ceased sailing to Jan Mayen and instead followed a new route first north to Bjørnøya, where seals were hunted in the pack ice, and then north again and along the west coast of Spitsbergen to Amsterdamøya where they turned east. In late August and early September the fleet gathered at the entrance of Storfjorden, west of Hopen, where the masters of the Hammerfest and Tromsø fleets exchanged news before returning home to Norway. The vessels included Alken, Cecile Malene, Duen, Gjøa, Haabet, Nordland, Rivalen, and Sølivet. This route was known as Nordisen [the northern ice].
In 1874, however, the situation reverted when some strongly built vessels sailed again to the waters off Jan Mayen which became known thereafter as Vestisen [the western ice]. The reason for this was that stocks of seals and walrus had been depleted at Spitsbergen and Novaya Zemlya (see above). One of the vessels was the schooner Nordland captained by Edvard Johannesen. Nordland continued beyond the Vestisen and was the first Norwegian vessel to hunt seals in the Denmark Strait (Giaver 1939: 12). This marked the start of an era when Norwegians went sealing there every year (Giæver Reference Giæver1939).
In 1889 the barque Hekla (R. Knudsen) of the southern fleet became the first Norwegian sealer to sail into the fiords of northeast Greenland (Erskine and Kjær Reference Erskine and Kjær2005). Four years later, in 1893, Gjøa sailed to the coast of northeast Greenland and returned with a fairly good catch (Gjøa 1893). She is the first vessel of the northern fleet recorded to have sailed in these waters (Kjær Reference Kjær2005).
In 1898 the sloops Anna (O. Næssø) and Cecilie Malene (M. Arnesen) sailed to Novaya Zemlya but achieved only poor catches. Næssø and Arnesen decided to continue west to northeast Greenland. This was also the start of an era. Although Gjøa had been there in 1893 (Gjøa 1893), it was not until now, five years later, that sealing vessels began to go there annually to hunt muskoxen, walrus, seals and polar bears. Anna Gjøa sailed home with 4 muskoxen, 22 polar bear hides and 4 live polar bears, 64 walrus, 94 seals and 140 barrels of blubber. These were the first muskoxen brought from Greenland to northern Norway. They were stuffed and one was donated to Tromsø Museum. Besides the mammals, the crews observed an abundance of Arctic charr (Salvelinus alpinus) in the rivers. These observations were indicative of the wealth of animals in that area and ten years later Norwegian sealing crews began to overwinter annually on northeast Greenland. These activities led to a conflict between Denmark and Norway regarding the sovereignty of the area. The disagreement was finally settled in Denmark's favour by the international court in The Hague in 1933.
It is difficult to say exactly when the fleet started sealing in the White Sea but from 1879 the reported catch includes more harp seals than bearded seals and these came mainly from that area. In 1885, 13 of a fleet of 29 vessels sailed directly to the White Sea from where they continued east to Novaya Zemlya (Norsk Fiskeritidende 1885).
In 1893 Norwegian sealers were impounded by the Russian Navy in the White Sea. This had not happened before. Five sloops of Hammerfest and one of Tromsø were taken to Kola where their catch was confiscated (Tromsø Stiftstidende 6 July 1893, 23 October 1893).
In 1900 several Norwegian vessels were inspected by the Russian coast guard. The Russian inspector wrote in the ships’ journals that if the crews went ashore to fish or to replenish drinking water their vessels would be impounded (Duen 1900). Over the following years there were frequent confrontations between Norwegian sealers and the Russian coast guard when the tidal current swept them inside the Russian sector (Erskine and Kjær Reference Erskine and Kjær1998). It was not until 1927 that an agreement was reached between the Soviet Union and Norway which allowed Norwegian vessels to go sealing in the White Sea (Kjær and Sefland Reference Kjær and Sefland2005).
Norwegians began sealing at Novaya Zemlya in 1868, the year after Carlsen's successful voyage there. Unlike in the White Sea, there were generally few confrontations between Norwegians and Russians so far north but, in 1878, the sloop Prøven (I.N. Isaksen), which had been Nordenskiöld's expedition ship in 1875, was boarded by pirates from a Russian schooner while she was at anchor. Seven men pointed their guns at Isaksen and his crew, threatened to kill them all and robbed the vessel of valuables. One of the crew of Prøven recognised the master of the pirate schooner as a certain Captain Ivan Lemoff. Charges were subsequently brought against Lemoff and his crew. The great Russian patron Sibirjakov saw to it that the maritime declaration of Prøven and a written statement by Captain Arnesen of Strømman were made public in a Russian newspaper (Tromsø Stiftstidende, 3 December 1878). The Russian authorities subsequently compensated Prøven for the losses.
In 1878 the schooner Nordland (E. Johannesen), which started the sealing in the Denmark Strait in 1874, sailed first to Novaya Zemlya and then continued beyond 90° E where the crew killed 147 walrus (Nordland 1878). It was merely an incident. No Norwegian sealer sailed so far east again.
Credit for the discovery of Zemlya Frantsa-Iosifa is generally given to the Tegetthoff expedition which had sailed from Tromsø in 1872. It is not improbable, however, that the sealing master Nils Rønbeck of Hammerfest had actually been there in the 1860s when he saw and named new land Øst-Spitsbergen [Eastern Spitsbergen]. The first recorded catch at Zemlya Frantsa-Iosifa was made by the sealer Severn (S. Bræckmo) of Tromsø in 1907. She returned with two live walruses and the remains of 52 dead ones, eight live polar bears and 10 polar bear skins and also seals and blubber. A few days later Victoria of London, sealing out of Tromsø, arrived from Zemlya Frantsa-Iosifa with two live and 31 dead walruses, two live polar bears and 50 bear skins, seals and blubber (Norsk Fiskeritidene 1909). Sealers returned there in the following years whenever ice conditions permitted. However, the Kara Sea was closed by ice between 1882 and 1888, and ice fields prevented the fleet reaching Zemlya Frantsa-Iosifa. Frithjof, Walter Wellman's expedition ship, sailed there in 1898 and returned with 44 walrus and 14 polar bears (Tromsø Tollsted Vaktjournal 1898). Gjøa reached there on 14 September that year before turning for home (Kjaer Reference Kjær2005: 337). Thereafter the sealing fleet did not return annually before 1908 by which time all the vessels were equipped with engines.
Each year between 1893 and 1902 the Norwegian navy vessel Heimdal delivered post to the fleet on the bottlenose whaling ground in Vestisen. The rendezvous was at 67°N, 3° to 11°W between 12 and 17 May. Heimdal carried a doctor and a medical staff. No vessel in the northern Norwegian fleet was sealing in Vestisen in the middle of May but when, in 1900 and 1901, Heimdal moved first to the White Sea and then to Novaya Zemlya a month later she met a fleet of vessels from northern Norway that collected post and made use of the medical service onboard (Heimdal 1900, 1901).
The market for seal products
In 1859, at the very beginning of the period covered in this paper, London was the main marked for seal skins while other products such as walrus hides, walrus tusks and seal oil were sold to ports in Schleswig-Holstein (Statistiske Tabeller 1860). This part of what today is Germany had a sealing fleet and several Tromsø sealing masters, including the great Carlsen, captained German sealers.
By 1880, however, the market had moved and seal oil and other Arctic products were sold mainly in Scotland. Seal oil was mainly used in the tanning industry and to soften fibres such as jute. Beluga and walrus hides were used as conveyor belts, drive belts, polishing pads and tyres on wooden wagon wheels. By 1880, London was still the main market for seal skins, Paris imported mostly walrus tusks while oil products were exported to Hamburg and Leith. To serve this trade, merchants in northern Norway were appointed agents for companies in London, Paris, Hamburg and Leith.
Important as sealing and associated hunting had become in both the commercial development and the culture of northern Norway, viewed in terms of the Atlantic Arctic region as a whole it always was a small scale affair. In April 1905, for example, the Newfoundland sealer Eagle returned to St. John's with a catch of 33000 seals and a vast amount of blubber. The single best catch by a Tromsø vessel that year was Colibri (I. Isaksen) which unloaded just 2200 seals and 290 barrels of blubber. The sealing trade of northern Norway produced some 1000 tons of seal oil a year while in 1905 Canada produced 2500 tons more than the previous year (Tromsøposten, 24 August 1906).
Summary
‘Sealing’ is a misleading term for Arctic hunting operations out of northern Norway before about 1894. By that time, however, a recognisable ‘sealing industry’ had developed. Prior to that vessels did not go into the ice but, instead, crews caught at the ice edge and collected on land whatever could be turned into profit: reindeer, walrus, bearded seals, beluga whales, cod, polar bears, eggs, gathered eiderdown, driftwood and salvage. The introduction of modern techniques, such as netting beluga whales, and of modern weapons and improved ammunition, which replaced harpoons, resulted in the local depletion of stocks of various species. The search for new hunting grounds resulted in an enormous increase in the geographical range of operations. The fleet gradually changed from sloop to sloop ketch rig and from sail to oil was a consequence, not a cause, of this.
Acknowledgements
I would like to thank the following for information and other support during the preparation of this paper: Svein Andresen of Andresen Våpenforretning, Tromsø; Karl Egil Hanevik of Hanevik Våpen; Alester Hansen, Bodø; Tom Ingebrigsen, Oslo; Gunsmith Arne H. Jensen, Tromsø; Ragnar Klevaas, KNS, Oslo; Erling Sverre Nordøy, University of Tromsø; Bjørn Ostmo; Ivar Stokland and Fred Inge Presteng, Norwegian Polar Institute; Tore and Sigrun Topp, Hamar; Lisa Benson, Sjøfartsmuseet, Oslo; Anne Megård and Nina Korbu, National Library, Oslo; Nicholas Tyler, University of Tromsø.