Introduction
Several studies have observed transitions from the traditional welfare state to a new social investment state across many European countries over the past few decades (Bonoli, Reference Bonoli, Armingeon and Bonoli2006; Morel et al., Reference Morel, Palier, Palme, Morel, Palier and Palme2012; Van Kersbergen and Hemerijck, Reference Van Kersbergen and Hemerijck2012; Hemerijck Reference Hemerijck2013). Although designated in different ways by different authors (see Taylor-Gooby et al., Reference Taylor-Gooby, Gumy and Otto2015, for an overview), these transitions generally imply reforming redistributive social policies into active social policies which are aimed at greater social inclusion through higher labour-market participation. Such transitions have been promoted by the European Council through the adoption of the Lisbon and Europe 2020 strategies (European Council, 2000; European Commission, 2010). In many European countries, poverty rates have been disappointing, which has triggered a fierce debate in the welfare state literature about the effectiveness of social investment policies. Moreover, it has been argued that the focus on social investment policies is even partially responsible for the disappointing poverty rates (Cantillon, Reference Cantillon2011; Vandenbroucke and Vleminckx, Reference Vandenbroucke and Vleminckx2011).
To date, any empirical insight into the relationship between social investment policies and poverty has been rather limited. In this respect, Van Kersbergen and Hemerijck (Reference Van Kersbergen and Hemerijck2012: 489) conclude that ‘it is unclear what the impact of the social investment strategy has been or is likely to have on income distribution and poverty’ and Cantillon (Reference Cantillon2011: 445) concludes that ‘further empirical analysis of the relationship between financial poverty and the capacity of social policies for social investment and redistribution is therefore needed.’ A first group of empirical studies reveals that social investment policies may have detrimental redistributive effects (Ghysels and Van Lancker, Reference Ghysels and Van Lancker2011; Cantillon and Van Lancker, Reference Cantillon and Van Lancker2012; Van Lancker and Ghysels, Reference Van Lancker and Ghysels2012). Since these studies are focused on specific policies in one or two countries, it is difficult to assess whether the findings can account for a more general relationship between social investment policies and disappointing poverty rates across European countries. In contrast, Vaalavuo (Reference Vaalavuo2013) demonstrates that public spending on social investment is more equal or pro-poor than traditional social spending, based on a comparative study across six countries. However, because the focus of Vaalavuo's study is on one year only, a linkage between the disappointing poverty trends and the welfare state transformations across European countries cannot be ruled out.
The aim of the present study is to examine the relationship between the developments in social investment policies and the variations in poverty and income inequality across countries and over time. First, we examine to what extent poverty rates and income inequality have increased in the period 1997–2007, relying on EU ECHP/SILCFootnote 1 data. Indeed, in many countries poverty rates have increased in this period, but there is substantial variation across countries. Subsequently, we examine the extent to which the variation in poverty rates and income inequality levels is related to social investment policies using data from the OECD (2012a) Social Expenditure Database. To examine the relative importance of expenditures on social investment policies as an explanatory factor, the study relies on pooled time-series regression analyses. This approach enables us to control for a number of other determinants highlighted in the extensive body of literature on income inequality and poverty, such as demographic factors, labour market trends and globalisation (Mahler, Reference Mahler2004; Brandolini and Smeeding, Reference Brandolini, Smeeding, Salverda, Nolan and Smeeding2009; Kenworthy, Reference Kenworthy2011; Caminada et al., Reference Caminada, Goudswaard and Koster2012).
Social investment, poverty and income inequality
Trends in poverty and income inequality
It has been well documented that levels of poverty and income inequality have increased in most European countries over the last two decades (Korpi and Palme, Reference Korpi and Palme1998; Alderson and Nielsen, Reference Alderson and Nielsen2002; Bradley et al., Reference Bradley, Huber, Moller, Nielsen and Stephens2003; OECD, 2008, Reference Kenworthy2011; Martin and Swank, Reference Martin and Swank2012; Thewissen et al., Reference Thewissen, Wang and Van Vliet2013). Economists, sociologists and political scientists put forward several explanations for the rise in poverty rates and income inequality. First, since income from work constitutes a large proportion of household income, labour-market developments such as employment trends are important determinants of income distribution (Huber and Stephens, Reference Huber and Stephens2014). Furthermore, in the comparative political economy literature, labour-market institutions are considered important determinants of the variation in wages (Wallerstein, Reference Wallerstein1999; Rueda and Pontusson, Reference Rueda and Pontusson2000; Pontusson et al., Reference Pontusson, Rueda and Way2002). As employees and employers bargain over wages and other working conditions, the outcomes of these negotiations are a function of a country's labour-market institutions; for example, its labour unions. Moreover, labour-market developments and therefore wages may be influenced by globalisation, because exports and imports affect the demand for labour (Mahler, Reference Mahler2004).
In addition to labour-market developments, demographic trends have been regarded as important drivers of poverty and inequality. Changes in the relative size of certain groups in the total population, for example older people, and tendencies towards a smaller average household size can influence the distribution of household incomes (Gustafsson and Johansson, Reference Gustafsson and Johansson1999; Brady, Reference Brady2005). Finally, changes in redistribution from government policy contribute to changes in income distribution. In the period from the mid-1980s to the mid-2000s, tax-benefit systems have offset rising market income inequality substantially through redistribution (Kenworthy and Pontusson, Reference Kenworthy and Pontusson2005; OECD, 2011; Wang et al., Reference Wang, Caminada and Goudswaard2013). Social transfers are responsible for the largest share of this redistribution. Hence, reforming traditional welfare state arrangements into social investment policies may have considerable effects on poverty and income inequality.
The social investment state
The social investment approach includes public policies which are aimed at both investing in human-capital development and making efficient use of human capital in terms of labour-market participation. As such, welfare state programmes should contribute to a skilled and flexible labour force, which can easily adapt to a constantly changing knowledge-based economy (Morel et al., Reference Morel, Palier, Palme, Morel, Palier and Palme2012). Vandenbroucke and Vleminckx (Reference Vandenbroucke and Vleminckx2011) place the social investment approach in a broader paradigm of the ‘new welfare state’ that consists of three dimensions. The first one is the new-risk dimension. New social risks can be defined as ‘the risks that people now face in the course of their lives as a result of the economic and social changes associated with the transition to a post-industrial society’ (Taylor-Gooby, Reference Taylor-Gooby and Taylor-Gooby2004: 2). These changes include reconciling work and family life, single parenthood, having a frail relative, possessing low or obsolete skills and insufficient social insurance coverage. Old social risks include unemployment, old age, ill health, sickness and disability and the financial burden of raising children (Bonoli, Reference Bonoli, Armingeon and Bonoli2006; Vandenbroucke and Vleminckx, Reference Vandenbroucke and Vleminckx2011). In the paradigm of the new welfare state, the new social risks should be addressed by new welfare state programmes. The second dimension of the new welfare state is the investment dimension. Public resources should be spent on investments in human capital rather than on passive cash transfers. The third dimension is the service dimension, entailing that welfare states should follow the Scandinavian example and become more service-oriented and less transfer-oriented.
The intention of the European social investment agenda was to get people out of poverty by moving them into work. Hence, Vandenbroucke and Vleminckx (Reference Vandenbroucke and Vleminckx2011) argue that the ‘active welfare state’ would actually be a more accurate term than ‘social investment state’. Indeed, active labour-market policies (ALMPs) form an important part of the social investment state (Bonoli, Reference Bonoli, Morel, Palier and Palme2012). In this respect, it should be noted that the overarching policy objectives have been shifted from combating unemployment to increasing employment (Hemerijck, Reference Hemerijck2013). Most European countries reformed their labour-market policies into policies with a more active approach, and employment rates have increased in most of those countries (Van Vliet and Koster, Reference Van Vliet and Koster2011; Van Rie and Marx, Reference Van Rie and Marx2012). Research by Nelson and Stephens (Reference Nelson, Stephens, Morel, Palier and Palme2012) suggests that these changes in ALMPs and employment rates are related to each other, as they show a positive relationship between expenditures on ALMPs and employment rates, while accounting for confounding factors.
Despite the fact that European countries have experienced rather favourable conditions, such as moderate economic growth and increased employment rates since the early 2000s, poverty rates have not declined but stagnated or even increased (Cantillon, Reference Cantillon2011). One explanation for this observation is that poor people have not sufficiently benefited from employment growth. Employment has not been as beneficial for the jobless households as for the households where at least one person was already in work (Marx et al., Reference Marx, Vandenbroucke and Verbist2012; Cantillon, Reference Cantillon2011).Footnote 2 However, based on an extensive decomposition analysis, Corluy and Vandenbroukce (Reference Corluy, Vandenbroucke, Cantillon and Vandenbroucke2014) show that the disappointing poverty trends cannot be solely attributed to the modest translation of increasing employment rates into a decreasing share of jobless households.
In addition, Cantillon (Reference Cantillon2011) argues that the disappointing poverty trends can at least partially be attributed to the difficult transition from traditional welfare state policies to new social investment policies. In the literature, two explanations for this negative effect of social investment policies have been formulated (Cantillon, Reference Cantillon2011; Morel et al., Reference Morel, Palier, Palme, Morel, Palier and Palme2012). The first explanation presumes that the shift in focus from old social risks to new social risks and investments in human capital has moved away resources from traditional passive welfare state programmes to new active welfare state programmes which are relatively less redistributive. For example, Ghysels and Van Lancker (Reference Ghysels and Van Lancker2011) demonstrate that in the Belgian region of Flanders public resources on childcare or parental leave programmes tend to flow to higher income groups, mainly double-income families with better educational backgrounds and a higher earnings capacity, the so-called Matthew effect (Deleeck et al., Reference Deleeck, Huybrechs and Cantillon1983). As noted by several scholars before (Atkinson, Reference Atkinson2010; Lundvall and Lorenz, Reference Lundvall, Lorenz, Morel, Palier and Palme2012), these detrimental consequences illustrate that the distributive effects of welfare state programmes depend on their particular institutional design and complementarities. In contrast, Vaalavuo (Reference Vaalavuo2013) shows for six European countries that new social spending benefits low-income groups more than high-income groups. Nevertheless, empirical research on total redistribution shows that new welfare state programmes, such as child/family and parental leave programmes, are generally less redistributive than traditional programmes such as old-age benefits, social assistance benefits and unemployment benefits (Wang et al., Reference Wang, Caminada and Goudswaard2012). The traditional programmes play an important role in reducing income inequality, because most of them are targeted at the poor.
A second reason why the social investment strategy would be partially responsible for the increased poverty rates is that the focus on activation and ‘making work pay’ has implied that unemployment-benefit programmes have become less generous (Paetzold and Van Vliet, Reference Paetzold and Van Vliet2014). In many European countries, eligibility conditions have become stricter (Immervoll and Richardson, Reference Immervoll and Richardson2011) and the redistributive effect of unemployment benefits has declined (Wang et al., Reference Wang, Caminada and Goudswaard2013). Hence, income protection for the working-age population out of work has decreased.
In summary, it has been argued that social investment policies have contributed to increasing employment rates, but not to reducing poverty rates. As the work-poor households benefited less from the employment growth than the work-rich households, the income inequality between the work-poor and the work-rich households increased. The trends of increasing poverty and income inequality would have been strengthened by the shift towards less redistributive welfare state programmes, as new-risk programmes mainly benefit work-rich households, while the income protection for work-poor households has declined. Therefore, Cantillon (Reference Cantillon2011: 440) concludes that the ‘shift from passive social protection to activation and investment has been even more problematic than anticipated and is arguably partially responsible for disappointing poverty trends’. As the distributive effects of new welfare state programmes depend on their institutional contexts, which vary across countries and over time, it is an empirical question as to whether shifts from traditional welfare state to social investment programmes have contributed to increased poverty rates across the EU.
Data and method
Poverty rate and income inequality
To examine the distributional effects of shifts from traditional welfare state policies to social investment policies, the study relies on two indicators provided by Eurostat (2011): poverty rate and income inequality.Footnote 3 Income inequality, based on equivalised disposable income, is measured by the Gini coefficient. As our poverty indicator, we use the percentage of people who live below the poverty line of 60 per cent of median equivalised disposable income. This indicator is a relative poverty line, indicating at-risk-of-poverty relative to the standard of living in each country. As such, it gives a detailed representation of income inequality for the lower part of the income distribution. The poverty line of 60 per cent (PL 60) is used as an official poverty measure by the European Council.Footnote 4 A well-known limitation of these Eurostat data is a break in the time series.Footnote 5 However, to examine developments in poverty and inequality for a relatively large group of EU countries, these are the best data at hand and they are regularly used in pooled time-series regression analyses (Van Vliet et al., Reference Van Vliet, Been, Caminada and Goudswaard2012; Dafermos and Papatheodorou, Reference Dafermos and Papatheodorou2013). Sensitivity analyses discussed below indicate that the results of the analyses are not biased by this break.
Expenditures on social investment
To examine to what extent resources have been shifted from ‘old’ welfare state arrangements to ‘new’ social investment policies, the study relies on data from the OECD Social Expenditure Database (OECD, 2012a) and the OECD Education Statistics Database (OECD, 2012e). These databases contain social expenditure data on both traditional welfare state programmes and social investment policies. With respect to the measurement of social investment, the study builds on the approach laid down by Vandenbroucke and Vleminckx (Reference Vandenbroucke and Vleminckx2011). They classify the spending categories in the OECD databases into ‘new’ and ‘old’ social expenditures. The new welfare state expenditures are linked to new social risks and the social investment paradigm, whilst the old expenditures are linked to old social risks. Hence, new social expenditures consist of public expenditures on parental leave (maternity and paternity leave), elderly care (residential care and home-help services), child care (day-care and home-help services, and pre-primary education), ALMPs (employment services and administration, training, job-rotation and job-sharing, employment incentives, supported employment and rehabilitation, and direct job creation) and primary and secondary education. Old social expenditures include public health expenditures, retirement pensions (‘old age’, including ‘early retirement’, and ‘survivor’ cash benefits) and other social transfers (family benefits, incapacity-related benefits, unemployment benefits, income maintenance, and other cash benefits).Footnote 6 Subsequently, we take the ratio of new social expenditures to the sum of old and new social expenditures. This measure provides an indication of shifts in budgetary resources from old to new social spending.
However, social expenditure indicators have some limitations (De Deken, Reference De Deken, Cantillon and Vandenbroucke2014). First, differences in the composition of social expenditures, with respect to new and old welfare state programmes, can indicate deliberate choices to spend more on certain programmes, but they may also reflect variation in demographic and socio-economic trends across countries. Second, expenditures do not indicate institutional characteristics of welfare state programmes. With regard to labour-market policies for instance, expenditures give an indication of the financial efforts dedicated to labour-market training and public employment services, but not of benefit sanctions. Third, differences in taxation of social benefits are not taken into account. Ideally, net expenditures, after tax, on new and old welfare state programmes are used, but internationally comparable data for those welfare state programmes are unfortunately not available for a longer period.
Other macro-level measures that are widely used as an alternative to social expenditures in the comparative welfare state literature are replacement rates (Korpi and Palme, Reference Korpi and Palme1998; Van Vliet and Caminada, Reference Van Vliet and Caminada2012; Scruggs et al., Reference Scruggs, Detlef and Kuitto2014; Wang and Van Vliet, Reference Wang and Van Vliet2014). However, since these measures are only available for traditional welfare state arrangements such as unemployment benefits, public pension schemes and social assistance benefits, they cannot be used for social investment policies. Therefore, we have to use expenditure data. Acknowledging the fact that social expenditures are partly driven by need, we also examine the expenditures at the programme level and we correct the expenditures for the number of beneficiaries.Footnote 7
Control variables
The models explicitly control for a number of other determinants of poverty and income inequality. First, we include a number of socio-economic variables. To control for the negative effect of the overall generosity of welfare states on poverty and income inequality (Brady, Reference Brady2005; Moller et al., Reference Moller, Bradley, Huber, Nielsen and Stephens2003), we include a generosity index from the Comparative Welfare Entitlements Dataset 2 (Scruggs et al., Reference Scruggs, Detlef and Kuitto2014). The logarithm of GDP per capita is included in the model to control for the economic development of a country. In some studies (e.g., Alesina and Rodrik, Reference Alesina and Rodrik1994), it has been found that economic growth is related to less inequality. However, in other studies (e.g., Forbes, Reference Forbes2000) a positive relationship between growth and inequality has been found, suggesting that there is a trade-off between growth and inequality. Data on real GDP per capita are taken from the OECD (2012b). For the employment rate, the study relies on data from the OECD (2012c).Footnote 8 Since stimulating employment rates is an important goal of the social investment strategy, we also examine the endogeneity of employment rates. Furthermore, the age composition of the population plays a role in the income (re)distribution (Lam, Reference Lam, Mark and Stark1997; Gustafsson and Johansson, Reference Gustafsson and Johansson1999). Therefore, we include the percentage of the population aged sixty-five and over and aged fifteen and younger, using data from the OECD (2012c).
Furthermore, the study controls for the possible impact of globalisation. The linkages between international economic integration and income distributions have been analysed extensively (Mahler, Reference Mahler2004). International economics provides two standard theoretical models to analyse the distributive effects of globalisation. From the Stolper‒Samuelson theorem (Samuelson, Reference Samuelson1971), we should expect that the exposure to international markets leads to a higher skill demand in affluent democracies, which causes higher income inequality. According to the Ricardo–Viner model, employees in exporting sectors benefit from increased trade, whereas employees in importing sectors lose as imports substitute domestic production (Davidson et al., Reference Davidson, Martin and Matusz1999). To account for the effect of globalisation, two measures are included, namely trade openness and financial openness. The first variable is measured as the sum of imports and exports as a percentage of GDP. The second variable is measured as the sum of inward and outward flows of foreign direct investment (FDI) as a percentage of GDP. For both measures, the study relies on OECD (2012d) data.Footnote 9
Finally, two variables are included to account for labour-market institutions, namely employment protection legislation and labour unions. The effects of these labour-market institutions are a priori ambiguous (Checchi and García-Peñalosa, Reference Checchi and García-Peñalosa2008). On the one hand, these institutions could lead to higher wages and less wage dispersion for employees and therefore they could be expected to reduce income inequality. Yet, on the other hand, these institutions could increase the differences between employees with permanent contracts (insiders) and employees with temporary contracts or unemployed people (outsiders). To measure the strength of trade unions, the study relies on union density data from the OECD Labour Force Statistics (OECD, 2012c). For the strictness of EPL, we rely on an indicator that is provided by the OECD (2009). The indicator covers regular and temporary employment. It is calculated as a weighted average of sub-indicators of employment regulation, such as legislative provisions setting conditions under which a dismissal is justified, procedural inconveniences that an employer may face during a dismissal process, notice and severance pay provisions and the restrictions on the hiring of temporary employment by firms.
Method
To examine the relationship between social investment policies and poverty, we run pooled time-series cross-section regression analyses. The estimations are based on the following type of equation:
 \begin{equation}
I_{it} = \alpha + \beta^{\prime} X_{it} + \delta^{\prime} Z_{it} + \mu _i + \lambda _t + \varepsilon _{it}\end{equation}
Here, I is the dependent variable poverty (PL60) or income inequality (the Gini coefficient) for country i in year t. X contains variables describing social policies, namely expenditure on old social programmes, on new social programmes and new welfare spending relative to old welfare spending. Z represents the control variables, including the welfare state generosity index, the employment rate, real GDP per capita, the share of people aged sixty-five and over relative to the total population, the share of people aged fifteen and under relative to the total population, trade union density and trade and financial openness. To account for the fact that the variation in poverty and income inequality may be related to unobserved country- and year-specific effects, country (i) and year (t) effects are modelled by μ and λ respectively. With the inclusion of country-specific effects, the estimator is focused on the variation within countries. Differences in the levels of the variables between countries are not taken into account with this estimator. As such, the aim of the estimations is to test whether increases in poverty and inequality are associated with social expenditure shifts within countries, rather than analysing associations between expenditure levels and poverty levels across countries.Footnote 10 To correct for autocorrelation, the error term ε is allowed to follow an AR(1)-process. Furthermore, panel-corrected standard errors are applied to correct for panel heteroskedasticity and simultaneous spatial correlation (Beck and Katz, Reference Beck and Katz1995).
The study includes fifteen European countries for which a reasonable number of observations is available – Austria, Belgium, Denmark, Finland, France, Germany, Greece, Ireland, Italy, The Netherlands, Norway, Portugal, Spain, Sweden and the United Kingdom. The year 1997 is taken as the first data year, because earlier data are not available for some variables. The analysis ends in 2007 as both the dependent and the independent variables are strongly affected by the economic crisis and the effects of the crisis are beyond the scope of this paper.
Empirical analyses
Descriptive statistics
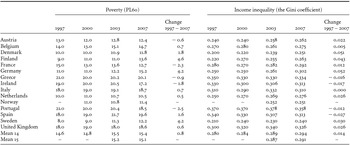
Data on poverty and income inequality are presented in Table 1. On average, the levels of poverty and income inequality increased between 1997 and 2007. Furthermore, there is some variation across countries. The level of income inequality has increased in most but not all countries. Interestingly, Austria and France have faced a moderate increase in income inequality, while the poverty rate has decreased. The largest decreases in income inequality are observed in Spain and Ireland while the largest decrease in poverty is found in Portugal. Finland and Sweden faced strong increases in both measures, but they still belong to the countries with the lowest levels of poverty and income inequality.Footnote 11
Trends of poverty rates and income inequality, 1997–2007

Note: Mean 14 countries excludes Norway. For some countries, data years are around 1997 (Denmark and Sweden, 1996), around 2000, around 2003 (Germany, The Netherlands, 2004), or around 2007.
Source: Eurostat SILC-database (Eurostat, 2011) and own calculations.
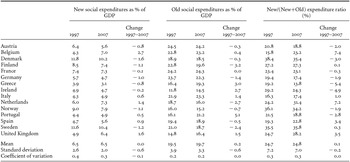
Table 2 presents the developments in social expenditures on new and old welfare state programmes. On average, the expenditures on new welfare state programmes remained constant, the expenditures on old welfare state programmes slightly increased and new spending as a share of total social expenditures increased a little bit. More interestingly, there is substantial variation in the development of new social expenditures as a share of total social expenditure across countries. In some countries, such as The Netherlands and Spain, new spending increased and old spending decreased, which resulted in increases in the new social spending as a share of total spending. However, in a number of other countries, the relative shift towards more new social expenditures was the result of the fact that the increases in new expenditures were larger than the increases in old expenditures.Footnote 12 This was for instance the case in Belgium, Italy and the United Kingdom. Hence, only in a few countries were the relative shifts towards more new social expenditures the result of shifts in resources from traditional welfare state programmes to social investment policies. Other countries have spent relatively more on social investment policies as well, but they have not decreased redistributive social transfers.
Expenditures on new and old welfare state policies, 1997–2007

Note: For some countries, data years for expenditures are around 1997 (Belgium, 1998; United Kingdom, 1998) or around 2007 (Greece, 2005).
Source: OECD Social Expenditure Database (OECD, 2012a) and own calculations.
Furthermore, the decreases of both the standard deviation and the coefficient of variation show that the dispersion of new social expenditures – both as a percentage of GDP and as a share of the sum of new and old expenditures – has declined. This indicates that the expenditures on new welfare state policies have converged across European countries. The data show that also old social expenditures have converged.
Regression results
The descriptive statistics presented above do not indicate a clear pattern between increased poverty rates and expenditure shifts towards new welfare state programmes. In some of the countries where the poverty rates increased, such as Belgium, the share of total social expenditure on new programmes has been increased. However, in other countries where the poverty rates increased in that period, such as Denmark, the share of new social expenditure actually decreased.
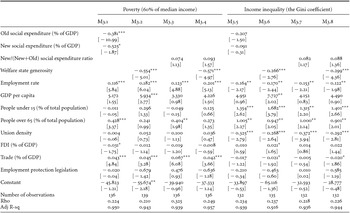
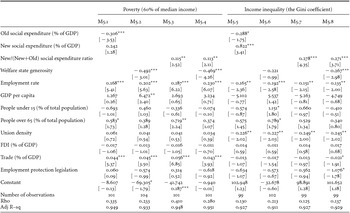
We analysed the variation with regression analyses on the fifteen European countries over the years 1997–2007. Table 3 presents the results. Model 3.1 shows that both old and new social expenditure are negatively and significantly related to poverty. This suggests that not only higher expenditures on traditional welfare state programmes but also higher expenditures on new welfare state programmes are associated with less poverty. For inequality, Model 3.5 shows also negative but insignificant effects. Subsequently, we analysed the effects of relative expenditure shifts from traditional welfare state programmes to new welfare state programmes. Models 3.3 and 3.7 show that new social expenditure as a share of total social expenditure is not significantly related to poverty and inequality. Accounting for the overall welfare state generosity, Models 3.4 and 3.8 show similar results. In summary, these results provide no evidence for the explanation put forward in the literature that increased poverty rates are partly attributable to the stronger focus on new welfare state programmes. Moreover, the models show that increases of the overall welfare state generosity are associated with lower levels of poverty and income inequality.
Panel data regressions of poverty, income inequality and new social expenditures

Notes: Unstandardised coefficients; t-values in parentheses; Prais–Winsten transformation [AR (1) disturbances]; Rho represents the coefficient of the auto-correlation of the error term, ranging from 0 to 1. Each regression also includes country and year dummies (not shown here).
* significant at 10%; ** significant at 5%; *** significant at 1%
As to employment rates, the results indicate a negative association with income inequality, suggesting that higher labour participation decreases income inequality. With respect to poverty, the results show a positive and significant effect. This result is remarkable, but it is in line with the argument that increasing employment does not necessarily result in lower relative poverty rates. Further analyses of employment rates per skill level suggest that the positive coefficient is inherent to the measurement of relative poverty. The employment rate of highly educated individuals is positively and significantly related to poverty, whilst for less educated individuals the coefficient is negative but insignificant. Hence, when employment growth of highly educated individuals increases the median income, more households with a low income fall below the poverty threshold, even though their incomes did not decline.
Turning to the demographic variables, the results indicate that the share of the population aged fifteen and younger is positively related to income inequality. Since children do not have any income, larger shares of children are associated with more inequality. However, the proportion of the population aged fifteen and under is not significantly associated with poverty. The share of the population aged sixty-five and above is positively related to poverty and income inequality. Due to the fact that in many countries older people hardly have any income from work and most of their incomes are from pensions and government transfers (Brown and Prus, Reference Brown and Prus2003), larger proportions of older people imply higher levels of poverty and inequality. Furthermore, the results indicate that union density is negatively and significantly associated with income inequality. This indicates that countries with stronger labour unions have more compressed wage distributions. The models for poverty show a negative but insignificant relationship to union density. Regarding trade openness, the results indicate a positive association with poverty, suggesting negative employment and wage effects from imports. The models for inequality do not show robust results for trade openness. For GDP per capita, FDI and employment protection legislation, the regressions yield no significant effects.
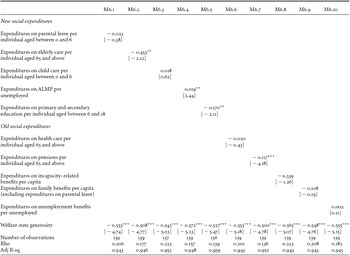
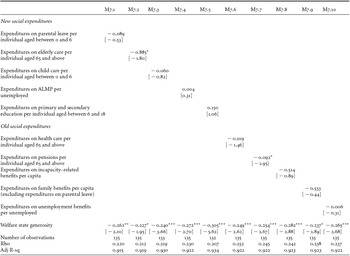
Subsequently, we analysed the distributive effects of social expenditures at the programme level, corrected for the number of beneficiaries. The results are presented in Tables 4 and 5. Regarding the new programmes, expenditures on elderly care and education are negatively related to poverty, which is in line with the result for new social expenditure in Table 3. Expenditures on ALMP are positively related to poverty. This result is in line with the argument provided in the literature that shifts towards more active social policies may be related to increasing poverty. The estimations of inequality yield only significant effects of expenditures on elderly care. With respect to the old programmes, expenditures on pensions are negatively related to poverty and inequality. For the other programmes, no significant effects are found.
Panel data regressions of poverty, new and old social expenditures

Notes: OLS regressions; unstandardised coefficients; values in parentheses are t values; Prais-Winsten transformation [AR (1) disturbances]; Rho represents the coefficient of the auto-correlation of the error term, ranging from 0 to 1. Each regression also includes a set of control variables and country and year dummies (not shown here).* significant at 10%; ** significant at 5%; *** significant at 1%.
Panel data regressions of income inequality, new and old social expenditures

Notes: OLS regressions; unstandardised coefficients; values in parentheses are t values; Prais–Winsten transformation [AR (1) disturbances]; Rho represents the coefficient of the auto-correlation of the error term, ranging from 0 to 1. Each regression also includes a set of control variables and country and year dummies (not shown here). * significant at 10%; ** significant at 5%; *** significant at 1%.
Sensitivity analyses
We performed a number of sensitivity analyses. Given the focus of social investment policies, it could be argued that social investment policies mainly affect the youth and the working age population. Therefore, we also examined the distributional effects of expenditure shifts for the population below sixty-five years old. In these analyses, the expenditures on public health and retirement pensions (both ‘old’ expenditures) and on elderly care (‘new’ social expenditure) are excluded from the expenditure ratios, because these programmes are targeted at people aged sixty-five and over. For the population below sixty-five years old, only data on poverty are available.Footnote 13 The estimations show that the results for the people below sixty-five are in line with the results for the total population presented above.
Subsequently, we examined the sensitivity of the results with respect to the endogeneity of employment rates. After all, policy makers devote budgetary resources to social investment policies to stimulate employment. Therefore, we ran two-stage least square regression analyses. GDP per capita, EPL, trade and FDI were excluded from the main model and used as instruments for the employment rate.Footnote 14 The results indicate that shifts from old to new welfare state expenditures are not significantly related to poverty and income inequality.
Next, we accounted for the fact that our analyses are based on unbalanced panels, due to a number of missing observations for the Nordic countries with regard to the poverty and inequality measures. These missing observations could lead to biased results because Denmark, Finland, Norway and Sweden have above average expenditures on social investment policies and below average inequality and poverty levels. To examine the sensitivity of the results for these countries, we ran the regressions without the Nordic countries. The results are presented in Table 6. Interestingly, new social expenditure, both as a percentage of GDP and as a share of total social expenditure, is positively related to poverty and income inequality. These results suggest that the relationship between expenditure shifts and poverty differs across countries and welfare state types. For the Nordic countries, the analyses provide no evidence for a relationship between a trend towards more new social expenditure and increasing poverty rates. However, for other European countries, the results provide empirical support for a linkage between stagnating or increasing poverty trends and shifts in expenditures to new welfare state programmes.
Panel data regressions of poverty, income inequality and new social expenditures (without Nordic countries)

Notes: OLS regressions; unstandardised coefficients; t–values in parentheses; Prais–Winsten transformation [AR (1) disturbances]; Rho represents the coefficient of auto–correlation of the error term, ranging from 0 to 1. Each regression also includes country and year dummies (not shown here).
* significant at 10%; ** significant at 5%; *** significant at 1%.
To further analyse the variation between countries, we run the analyses without country-fixed effects, focusing on the differences in the levels of the variables. The results are largely in line with the main results. Old and new social expenditure as a percentage of GDP are negatively associated with poverty. Moreover, the negative coefficients for these variables are now also significant in the estimations of inequality, and the positive coefficients for new social expenditure, as a share of total social expenditure, are significant in the models that account for the overall generosity of welfare states.
Finally, we examined the dependence of the results on breaks in the Eurostat data for poverty and income inequality. Until 2001, data were provided by the ECHP. Thereafter, Eurostat started to use EU-SILC data. Despite the fact that most variables are defined in the same way in the two data sets, some differences arise which could influence our results. Although the main models presented above already control for this data break to some extent by means of the year dummies, we also ran the analyses with a dummy variable for the ECHP period. All the results presented above are replicated, suggesting that our results are not biased by the data break.
Discussion and conclusion
Despite the fact that employment rates increased in many countries, poverty rates stagnated and in some countries even increased. In the welfare state literature, it has been argued that these disappointing poverty trends may be partly attributable to the introduction of social investment policies for two reasons (Cantillon, Reference Cantillon2011). First, resources have been shifted from traditional redistributive welfare state policies to relatively less redistributive social investment policies. Second, traditional welfare state programmes have become less generous to make them more activating. To date, there are only a few systematic comparative empirical analyses on the outcomes of social investment policies. This study contributes to the social investment and income inequality literature by empirically analysing the distributional effects of shifts in the expenditures on traditional welfare state programmes and social investment policies in fifteen European countries for the period 1997–2007, using pooled time-series cross-section analyses. Our results suggest that shifts in resources from traditional welfare state policies to new social investment policies are not associated with lower poverty rates. However, the results provide no convincing empirical evidence for the argument that the disappointing poverty rates across Europe are partially attributable to a greater focus on new welfare state programmes either (Cantillon, Reference Cantillon2011).
One explanation for this finding seems to be that the magnitude of the shifts in expenditures between old and new social policies has been relatively limited. In line with the findings of Hudson and Kühner (Reference Hudson and Kühner2009), our descriptive statistics show that the expenditures on new welfare state programmes has been increased at the expense of traditional welfare state spending in only a few countries. Moreover, from a methodological viewpoint, this implies that the variation in the data is rather limited. A limitation of existing studies on the distributive effects of social investment policies is that it is difficult to access to what extent these policies can be associated with the disappointing poverty trends across Europe because of the counterfactual problem. A panel-data approach solves this problem to some extent, because it utilises the variation across countries and over time and because it enables us to control for a number of other factors that could be associated with poverty. However, the limited variation in expenditures on social investment policies does not give much leverage with which to find any effect. This is also reflected by the fact that the results for social investment policies depend on the model specification.
Another explanation for our finding might be that, for a number of reasons, there is no generalisable relationship between new welfare state policies and poverty and income inequality at the macro level. First, the distributive effect of new welfare state programmes strongly depends on the specific policy context and on the socio-demographic structure of a country (Vaalavuo, Reference Vaalavuo2013). Hence, the detrimental effect of social investment policies that has been found in a number of specific cases (e.g., Van Lancker and Ghysels, Reference Van Lancker and Ghysels2012) simply cannot be generalised across a broader range of European countries and over time. Instead, our results indicate that, for countries other than the Nordic welfare states, there might be a positive relationship between expenditure shifts towards new welfare state programmes and stagnating or even increasing poverty trends. Further research should provide more insight into the country-specific associations between social investment policies and poverty trends. Second, empirical research at the macro-level that relies on expenditure data has considerable limitations regarding the institutional characteristics of welfare state programmes.
Finally, a notable limitation of empirical research on the effects of social investment policies, such as our study, is that it might be the case that it is still too early to expect and so to find either poverty-reducing or poverty-increasing effects. For a number of policy areas, such as primary and secondary education, measurable results could only be expected after twenty or thirty years. Hence, the current study is mainly focused on the short-term effects of labour-market-related social investment policies. Future studies should shed more light on the broader concept of social investment.
Acknowledgements
This study is part of Leiden University's research programme ‘Reforming Social Security’. Chen Wang is funded by the Chinese Scholarship Council. Earlier versions of this paper were presented at the Harvard Seminar on Social Exclusion and Inclusion (Cambridge, 5 December 2013), the 11th ESPAnet Conference (Poznan, 5–7 September 2013), the 10th ESPAnet Conference (Edinburgh, 6–8 September 2012), the Dutch ESPAnet Research Day (Rotterdam, 4 October 2012) and the NIG Annual Work Conference (Leuven, 29–30 November 2012). We thank all participants and Jason Beckfield, Jim Been, Koen Caminada, Kees Goudswaard, Marike Knoef, Stefan Thewissen, Frank Vandenbroucke, Guanghua Wan and Jinxian Wang for their helpful comments and suggestions. The usual disclaimer applies.