Introduction
Knowing neuronal types is essential for understanding structural and functional organization of the nervous system. It has long been realized that neuronal types should be discovered and not defined (Rodieck & Brening, Reference Rodieck and Brening1983; Cook, Reference Cook and Podugolnikova2003). Here, by a neuronal type, we mean a population of cells of common origin, produced by the same cell fate decisions, and displaying a high structural and functional similarity. A general approach to the discovery of neuron types is based on distinguishing between within- and between-type variation of certain parameters (Rodieck & Brening, Reference Rodieck and Brening1983). In principal, parameters reflecting any trait of a neuron may be used for classification purposes, and it would be advantageous to obtain different sorts of data for the same cell. However, this is technically demanding and requires a simultaneous use of various methods, some of which are mutually exclusive. For this reason, most classifications are based on data related to a single aspect of neuronal biology. In particular, neuronal morphology provides a good basis for classification (Masland & Raviola, Reference Masland and Raviola2000).
There are many approaches to finding groups in data (Kaufman & Rousseeuw, Reference Kaufman and Rousseeuw1990). One of them is cluster analysis (CA). Although the number of studies using CA to classify neurons is huge, only a few of them meet its formal prerequisites (Schweitzer & Renehan, Reference Schweitzer and Renehan1997). In the present study, we provide an example of using CA in combination with other multivariate tests and procedures for examining neuronal diversity. A special emphasis is put on formal prerequisites to the data and procedure and on the discussion of the advantages and limitations of the adopted approach.
The data under scrutiny are a sample of ganglion cells (GCs) projecting to the basal optic nucleus in the common frog. This nucleus pertains to the accessory optic system (AOS), a part of the visual system that participates in optokinetic nystagmus, optomotor responses, and integrative behavior (Kondrashev & Orlov, Reference Kondrashev and Orlov1976; Giolli et al., Reference Giolli, Blanks and Lui2005). Accessory optic system-projecting ganglion cells (AOS GCs) respond selectively to the direction of image motion. In the common frog, at least two functional types of AOS GCs occur that differ in preferred direction of stimulus motion (Bastakov et al., Reference Bastakov, Orlov and Panyutin1992). The spatial arrangement of AOS GCs in the common frog also suggests the presence of two or more distinct types (Podugolnikova et al., Reference Podugolnikova, Orlov, Reuter and Mecke1992b; Cook & Podugolnikova, Reference Cook, Chalupa and Werner2001). This provides formal grounds for searching for heterogeneity among these cells. At the same time, our previous by-eye estimations suggest that these cells are morphologically similar (Podugolnikova et al., Reference Podugolnikova, Orlov and Reuter1992a, Reference Podugolnikova, Kondrashev and Pushchin2007) giving them an advantage in terms of the present approach as the researcher’s conclusions are not a priori biased by apparent heterogeneity of the sample.
Materials and methods
Formal prerequisites
There are a number of prerequisites to an effective and reliable classification of neurons (Rodieck & Brening, Reference Rodieck and Brening1983). First, a sample of cells should be obtained. It should be representative, that is, reflect well the reliability of the neuron population under scrutiny, and large enough for the clustering algorithms and related procedures to perform properly (Kaufman & Rousseeuw, Reference Kaufman and Rousseeuw1990; Gordon, Reference Gordon1999). When classification is based on morphology, sufficiently well-stained neurons should be sampled, and special measures should be taken to estimate staining quality. In principal, any method yielding complete staining of cell compartments to be used in analysis (normally, axon, cell body, and/or dendritic arbor) can be used. In the present case, we used horseradish peroxidase (HRP) retrograde labeling to stain AOS GCs and conventional light microscopy combined with an image processing equipment to choose sufficiently stained cells (see below for details).
The choice of classification parameters is of crucial importance. When more parameters are considered, a more complete description of cell morphology (function, etc.) is achieved, but the effects of irrelevant and weakly discriminating parameters degrade the classification quality (Gordon, Reference Gordon1999). Parameters included into the model must be functionally important and represent different aspects of cell structure. Their frequency distribution must be at least bimodal indicating a great discriminating power (Schweitzer & Renehan, Reference Schweitzer and Renehan1997). Finally, they must not be mutually strongly correlated or functionally determined. Thus, it is reasonable to estimate a relatively large set of parameters and choose those most promising for classification. There are various approaches to parameter choice, and their combined use yields far better results than relying upon a single test (Jain & Dubes, Reference Jain and Dubes1988). In this study, optimal parameters were selected using correlation analysis and discriminant function analysis, while also considering the quality of the solutions and frequency distributions of the initial parameters. The section below (Parameterization of cell morphology) contains a detailed description of the parameters presently used and our approach to the choice of the optimal parameters.
While pioneer neurobiologists manually estimated parameters of cell structure, to date, this stage can be almost fully automated using applied software. In principle, adequate description of neuronal morphology should be based on the three-dimensional representation of a neuron. In practice, however, two-dimensional representations are often used, as they are easier to obtain and manipulate. In the present study, we used a hybrid approach, with some parameters estimated from two-dimensional digitizations of cell drawings, and others, from their three-dimensional reconstructions (see below). The use of two-dimensional models is justified by the fact that AOS GCs have very planar dendritic arbors, and the errors resulting from omission of the z coordinate are negligible. There are many programs, both commercial and public domain, that can be used for two- and three-dimensional reconstruction of neuronal morphology and some of them also allow its quantitative description. Two widely used commercial packages are Neurolucida (http://www.mbfbioscience.com/neurolucida) and Imaris (http://www.bitplane.com). In the present study, we used freely available software for three-dimensional reconstruction and quantitative analysis of AOS GC morphology (see below).
Another critical step is the choice of an appropriate clustering algorithm. Different methods may yield the optimum solution depending on the nature of the data and the structure of the sample. It is therefore reasonable to try various algorithms and choose the most suitable (Jain & Dubes, Reference Jain and Dubes1988). In the present study, a total of seven clustering algorithms were used. We also used two additional procedures, factor analysis and automatic variable weighting, to improve the clustering quality. See below for details.
To compare cluster solutions and choose the optimum one(s), one has to assess their quality. This may be done in many ways (Milligan, Reference Milligan, Arabie, Hubert and De Soete1996; Gordon, Reference Gordon1999). Some approaches are based on the ratio between within- and between-cluster variance, while others consider the geometry of the solution in the cluster space, specifically, cohesiveness and isolation of clusters. In case of hierarchical clustering, goodness-of-fit criteria such as cophenetic correlation coefficient are also used. Here, we used two different methods to estimate the classification quality. They are described in detail below.
Last but not least is the statistical reliability of the solutions. The null hypothesis to be checked is that the cells assigned to different clusters do not differ significantly in the clustering variables and other parameters in hand. A variety of statistical tests may be used depending on the nature of the data, structure of the solution, and sample size. In case of relatively small (<100) samples, nonparametric tests are preferable, as they do not require the data be drawn from a certain probability distribution (Gordon, Reference Gordon1999). We used Kruskal–Wallis ANOVA-on-Ranks (see below).
Specimen preparation and cell sampling
The material used here came from a single retinal whole mount containing a large population of frog AOS GCs kindly made available by Dr. Vladimir Bastakov (A.A. Kharkevich Institute of Information Transmission Problems, Moscow, Russia). The whole mount was used previously for the analysis of the spatial arrangement of AOS GCs in frog (Cook & Podugolnikova, Reference Cook, Chalupa and Werner2001). The details of whole-mount preparation are described in Cook and Podugolnikova (Reference Cook, Chalupa and Werner2001).
Cells were observed in an Olympus microscope (BHS model) with a 100/1.25 (oil) SPlan objective. Several representative cells were shot using a Carl Zeiss Axiovert 200 microscope equipped with an AxioCam HS Zeiss digital camera.
Thirty-three cells well-stained dendritic arbors were sampled for quantitative analysis. The completeness of dendrite staining was confirmed using a light microscope equipped with a system of image processing providing a reliable resolution of about 0.25 μm (Karpenko, Reference Karpenko1993). The system allowed us to check whether the label reached a dendrite terminal, which often had a growth cone-like appearance. The cells were drawn using an RA-6 drawing tube (Leningrad Optical & Mechanical Company, St. Petersburg, Russia). The bulk of the sample was composed by clusters of two to three neighboring cells with considerably overlapping dendritic arbors. This increased the probability that the sample contained cells with different preferred directions in nearly equal proportions (see Discussion section).
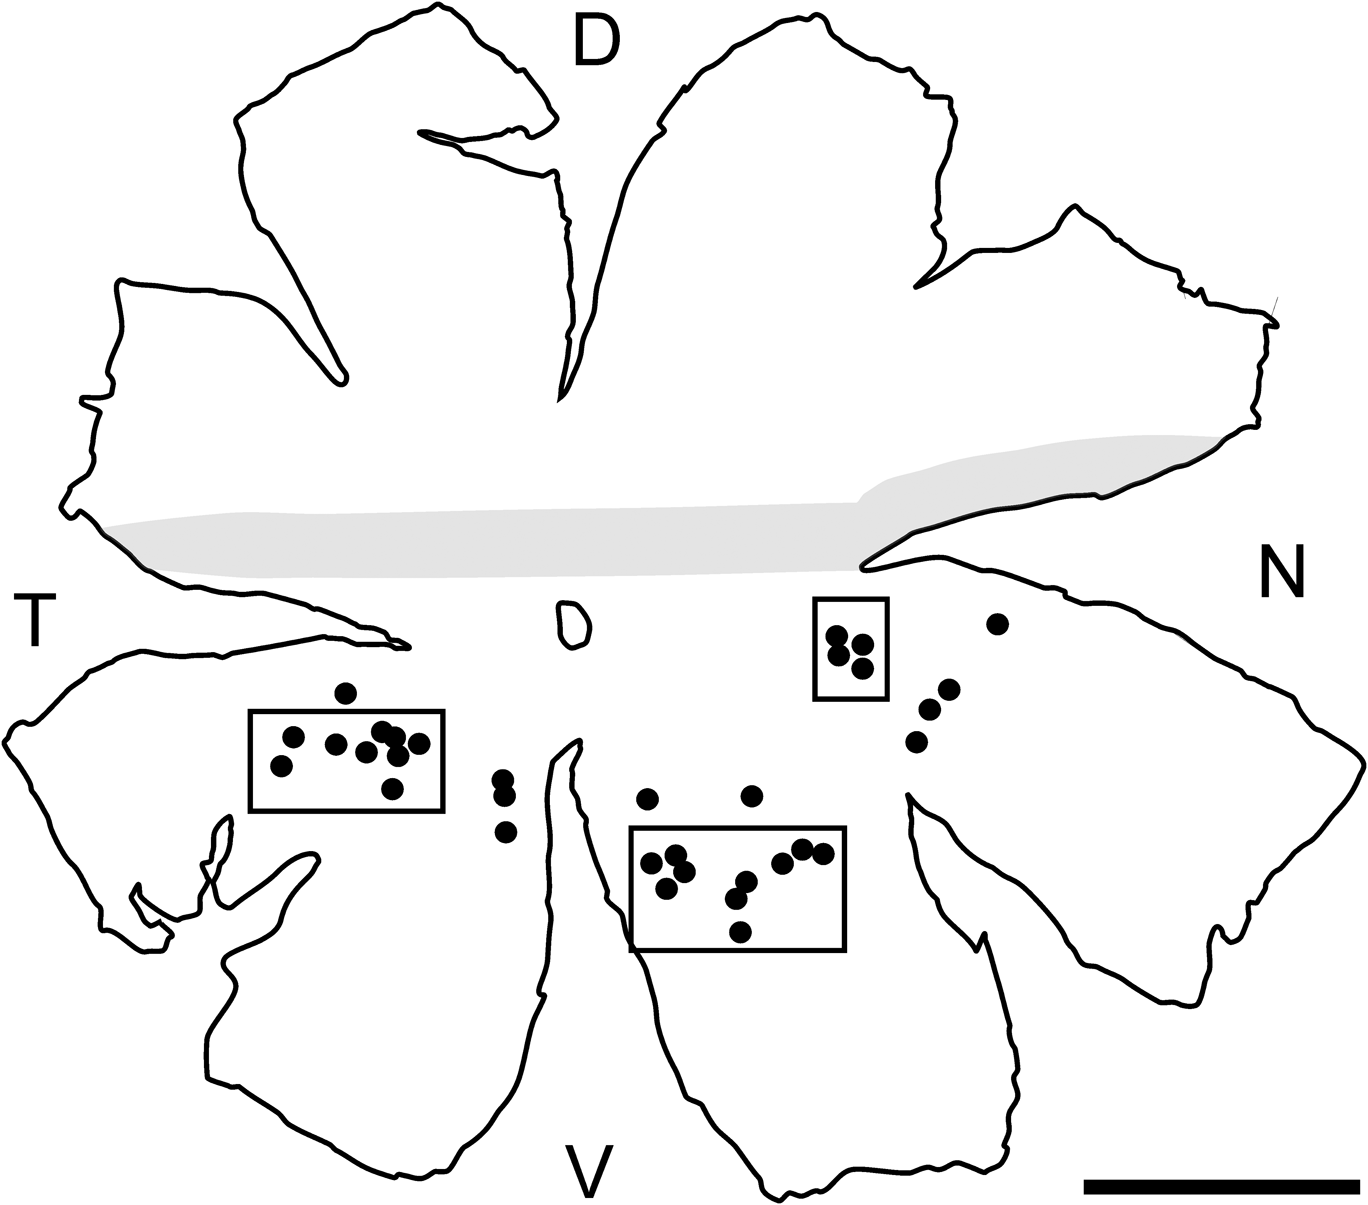
Podugolnikova et al. (Reference Podugolnikova, Orlov, Reuter and Mecke1992b) showed that the size of frog AOS DCs varies depending on region. In particular, cells in the midperipheral retina are four times as large as those within the visual streak. To minimize region-dependent variation and to avoid potentially immature cells from the retina periphery, cells were only sampled from the area between two rings with the radii of one fourth and three fourth of the retinal radius (Fig. 1).
Map of the whole mount from which AOS GCs were sampled. The visual streak is shaded. Black circles represent positions of the sampled cells. Rectangles designate cell groups shown at a greater scale in Fig. 4. D, dorsal; V, ventral; T, temporal; N, nasal. Bar 3 mm.

The GC drawings were digitized and used for estimation of all numerical parameters. Relative dendritic depths were measured by readings of a fine adjustment knob of the microscope (Harris, Reference Harris1985). This allowed a repeatable resolution of about 1 μm to be achieved, which was slightly more than the focal depth of the objective (0.68 μm). The inner plexiform layer (IPL) boundaries were identified by observing unstained profiles of cell bodies and processes using Nomarski differential contrast.
Parameterization of cell morphology
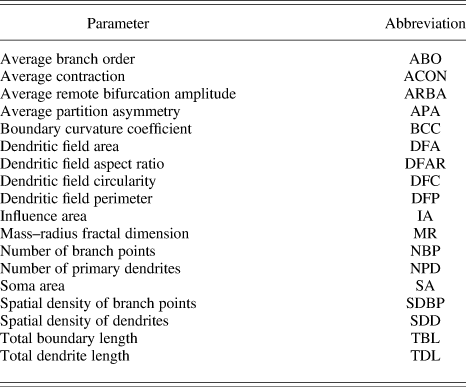
A total of 18 parameters related to various aspects of GC morphology and topology were estimated for each cell (Table 1).
Parameters used to characterize retinal GCs projecting to the accessory optic system in Rana temporariaFootnote a

a Detailed descriptions of the parameters are given in Materials and methods section.
Total dendrite length (TDL) was measured as the sum of the lengths of all dendrite segments. Total boundary length (TBL) was measured as the length of the boundary of the cell arborization. Boundary curvature coefficient (BCC) is a measure of complexity (“roughness”) of dendrite surface including that due to microsculpture. BCC was calculated as TBL/(2*TDL). Dendritic field area (DFA) was calculated as the area of a convex polygon defined by the cell’s end points. Dendritic field perimeter (DFP) was calculated as the perimeter of the above polygon. Influence area (IA) was proposed recently as a measure of dendritic field spatial coverage. It is found by convolving the cell’s dendrite boundary with a circular window of a fixed radius and measuring the resulting area. IA may be a more precise estimation of effective dendrite coverage than DFA because it depends on the exact shape of dendritic arborization (Costa & Velte, Reference Costa and Velte1999). Dendritic field circularity (DFC) was calculated as 4π*DFA/DFP2, where DFA and DFP are dendritic field area and perimeter, respectively. Dendritic field aspect ratio (DFAR) was found as the ratio between the longest and shortest axes of the ellipse fitted to the dendritic field. Spatial density of dendrites (SDD) was calculated as TDL/DFA. Number of branch points (NBP) was found by counting all branch points of the dendritic arborization. Spatial density of branch points (SDBP) was calculated as NBP/DFA. Number of primary dendrites (NPD) was found by counting the number of the cell’s primary dendrites. Mass–radius fractal dimension (MR) is a scale-dependent measure of spatial expansion or structural complexity of dendritic arborization (Smith et al., Reference Smith, Marks, Lange, Sheriff and Neale1989; Jelinek & Fernández, Reference Jelinek and Fernández1998). MR was calculated using Benoit 1.3 (TruSoft International, St. Petersburg, FL). Soma area (SA) was found by measuring the cell’s soma area.
Four parameters were measured using L-measure, a software tool for the analysis of neuronal morphology (Scorcioni et al., Reference Scorcioni, Polavaram and Ascoli2008). To do this, each GC was traced, that is, its digital representation was constructed and saved as an SWC file using Neuromantic, a program for reconstruction of neuronal morphology (Myatt et al., Reference Myatt, Nasuto and Maybank2006). The SWC format allows a neuron to be represented as a set of compartments each defined by coordinates in space and local radii. More details can be found in the author’s manual available at the program site (http://www.reading.ac.uk/neuromantic). Average branch order (ABO) and average partition asymmetry (APA) are related to cell topology. ABO is a measure of branching profusion. The respective program function returns the order of the branch with respect to soma. APA is a measure of branching asymmetry. Branching asymmetry at each bifurcation was calculated as abs(n 1 − n 2)/(n 1 + n 2 − 2), where n 1 and n 2 are the numbers of tips on the left and on the right of bifurcation, respectively. APA was then found by averaging branching asymmetries for all bifurcations. Average contraction (ACON) was calculated by averaging ratios between Euclidean distance of each branch and its path length. Average remote bifurcation amplitude (ARBA) was found as follows. At each bifurcation, an angle between that bifurcation and the ends of its growing segments was calculated. ARBA was then obtained by averaging angles for all bifurcations. Further details can be found at the L-measure site (http://cng.gmu.edu:8080/Lm/help/index.htm).
All AOS GCs were monostratified within a very narrow (1–2 μm) scleradmost zone of the sclerad IPL half. Coextensive dendrites of neighboring cells often were close to each other and occasionally interlaced (see Results section). For this reason, parameters related to the level of dendrite stratification would be of little use for classification purposes. They thus were not used in the present study.
Classification
To examine morphological heterogeneity of the GC sample, several clustering algorithms were used (Gordon, Reference Gordon1999). Hierarchical agglomerative algorithms included simple average, centroid, median, group average, and Ward’s minimum variance, and nonhierarchical ones were k-means and k-medoids. Euclidean distance was used as a similarity measure in all cases.
An hierarchical agglomerative algorithm begins with each object as a separate cluster. It joins similar objects into successively larger clusters by using some measure of between-cluster similarity (distance). Thus, Ward’s method uses ANOVA to determine the distances between clusters. The result is a hierarchical tree (dendrogram), with its branching points representing relative distances between clusters. As distinct from hierarchical clustering, partitioning algorithms iteratively change the assignment of objects to clusters to minimize the within-cluster variation. The k-means algorithm calculates the within-cluster variation based on the multivariate mean (centroid) of each cluster, whereas the k-medoids method uses a set of representative objects (medoids), one for each cluster, with this purpose. The medoid of a cluster is the object for which the average distance to all other objects in the cluster is minimum. Both algorithms stop when no movement of an object from one cluster to another reduces the within-cluster variation. Further details on clustering algorithms may be found in Gordon (Reference Gordon1999) and Kaufman and Rousseeuw (Reference Kaufman and Rousseeuw1990).
Silhouette value (S) was used as a general measure of the appropriateness of classification of each cell. It measures the average distance from a point representing the cell in the multidimensional space defined by classification variables to all the other points in its own cluster and compares it with the average distance to all the points in the closest adjacent cluster. Silhouette value is calculated as follows. Let Ai be an ith point in cluster A; a, average distance from Ai to all other points in A; B, a cluster other than A that has the smallest average distance between its points and Ai; and b, average distance between Ai and the points in B. S(Ai) = 1 − a/b, if a < b; b/a − 1, if a > b; and 0, if a = b. If A contains one object then S(Ai) = 0. Silhouette can range from −1 to 1. Silhouettes of well-classified objects are close to 1. Ambiguously classified objects have silhouettes close to 0. Silhouettes of inappropriately classified objects range between 0 and −1.
Average silhouette (SC) was used as a quantitative measure of solution quality. The average silhouette of a solution was calculated by averaging the silhouettes of all its objects. SC values of 0.71–1.00 were interpreted as indicative of a strong structure; 0.51–0.70, a reasonable structure; 0.26–0.50, a weak and possibly artificial structure; and −1 to 0.25, a lack of substantial structure (Rousseeuw, Reference Rousseeuw1987). The SC of a cluster was calculated by averaging the silhouettes of the cells assigned to the cluster.
The quality of hierarchical solutions was also estimated using cophenetic correlation coefficients. They show how well the distances between objects that result from the cluster dendrogram reproduce the original distances in the cluster space. The coefficient is calculated as a correlation between the matrices of the original and reproduced distances (Sokal & Rohlf, Reference Sokal and Rohlf1962). Values above 0.75 suggest a good solution quality.
Hierarchical algorithms do not provide explicit partitioning into clusters (Kaufman & Rousseeuw, Reference Kaufman and Rousseeuw1990). Proceeding from physiological studies and data on AOS GC diversity in different vertebrates (see Discussion section), the number of AOS GC types in the common frog is unlikely to exceed three. We therefore analyzed solutions containing two to five clusters. While choosing the optimum solution, in addition to SCs, we also considered statistical reliability of the solutions (see below), the size and nature of between-cluster differences, and cohesiveness and isolation of individual clusters.
In case of nonhierarchical algorithms, solution depends heavily on the initial position of cluster centroids. As a result, a locally optimum solution may be found, which may differ substantially from the global optimum (Gordon, Reference Gordon1999). The problem may be efficiently solved by running an algorithm a sufficient number of times with different initial positions of cluster centroids (in k-means) or medoids (in k-medoids) and choosing the best solution. In the present case, the number of trials was 1000 in case of either algorithm, with initial centroid positions (in k-means) or medoids (in k-medoids) chosen at random. Solutions containing two to five clusters were compared and the optimum number of clusters was determined as above.
The parameters were normalized by subtracting the mean and dividing by the standard deviation to equalize their impact on the results of the CA. The multimodality index (MI) of each parameter was calculated based on its frequency distribution as follows: MI = [S2 + 1]/[K + 3{(n − 1)2/(n − 2)(n − 3)}], where S is skewness, K is kurtosis, and n is sample size (Schweitzer & Renehan, Reference Schweitzer and Renehan1997). The value of MI allows one to judge whether the distribution is mono-, bi-, or multimodal. An MI of >0.55 indicates at least bimodal and, possibly, multimodal distribution (Schweitzer & Renehan, Reference Schweitzer and Renehan1997).
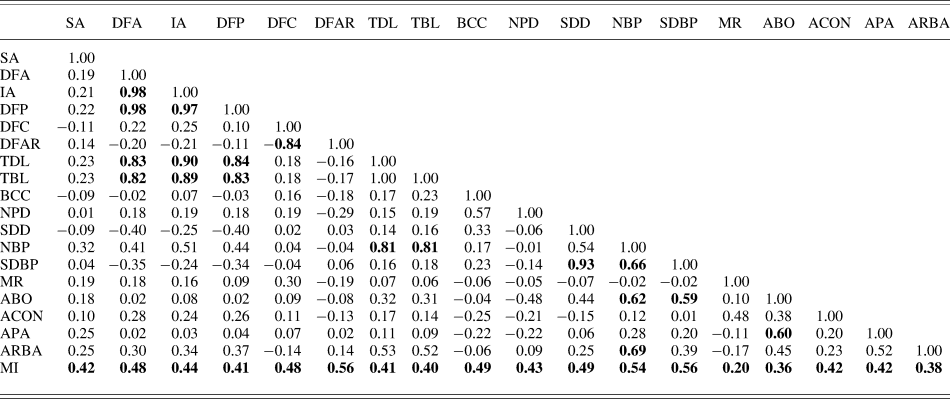
The correlation between parameters was measured using Pearson linear correlation analysis. The scatter plots of pairwise distributions of correlated parameters were also examined to reveal spurious correlations due to outliers (Jain & Dubes, Reference Jain and Dubes1988). In each group of strongly and significantly correlated parameters (R ≥ 0.8 at P < 0.05), only one parameter, that with the maximum MI, was chosen for the analysis to assure that the respective aspect of cell morphology is adequately, yet nonredundantly represented (Schweitzer & Renehan, Reference Schweitzer and Renehan1997). The MIs of most parameters were well below 0.55 suggesting a monomodal distribution. Such parameters are generally not suitable for classification purposes (Bajgier & Aggarwal, Reference Bajgier and Aggarwal1991; Schweitzer & Renehan, Reference Schweitzer and Renehan1997). However, CA of their joint distributions, especially combined with other data mining techniques, may reveal a latent cluster structure not directly reflected in a single variable justifying their cautious use (Davis, Reference Davis2002).
The clustering quality was improved by excluding parameters of least discriminating power, determined by means of discriminant function analysis (Davis, Reference Davis2002). Given a solution based on several variables, discriminant function analysis allows one to determine their relative contribution to discrimination between clusters. We started with solutions obtained using various algorithms and based on the subset of parameters selected using MIs and correlation analysis as described above. The variable that made the least contributions was excluded. The procedure was then repeated using solutions based on the remaining variables until further exclusion did not result in a substantial change in the solution quality. Parameters displaying prominent masking effects on the solution quality were also excluded (Gordon, Reference Gordon1999; Friedman & Meulman, Reference Friedman and Meulman2004).
Solution quality was further improved using the optimal variable weighting (OVW) algorithm (De Soete, Reference Deplano and Pedemonte1986, Reference De Soete1988; Makarenkov & Legendre, Reference Makarenkov and Legendre2001). Presented with a clustering solution based on equal variable weights, the OVW algorithm changes the weights to minimize the objective function related to within-cluster variation. The algorithm is applicable to both hierarchical and nonhierarchical clustering.
As an alternative to OVW, R-mode factor analysis was used. It allows one to reduce the dimensionality of the cluster space by describing variability of the original variables in terms of fewer number of latent variables (factors) (Überla, Reference Überla1977). Using factors instead of original variables may improve the classification quality (Gordon, Reference Gordon1999). From a set of highly correlated original variables, a variable with the greatest MI was included in the factor model to avoid multicollinearity. Variables that had low (<0.5) loadings on significant factors or high (>0.6) cross-loadings were also excluded from the model. The factors were extracted by using principal axis factoring and orthogonally rotated by using Varimax. The number of significant factors was determined by using the Kaiser criterion and the Cattell’s scree plot test, while also considering the strength of factor loadings and interpretability of factors (Überla, Reference Überla1977; Costello & Osborne, Reference Costello and Osborne2005). Significant factors were used as classification variables. The solutions based on the factor variables were then processed as described above to select the most discriminating variables and find the optimum solution.
The stability of the cluster structure was examined by measuring the discrepancy between solutions obtained using different clustering approaches. It was found as a percentage of cells assigned to different clusters in a pair of solutions with the same number of clusters.
To determine solution reliability, the significance of between-cluster differences was estimated using the Kruskal–Wallis ANOVA-on-Ranks with post hoc pairwise comparisons using Mann–Whitney U test (Sheskin, Reference Sheskin2000).
Analysis of dendritic field orientation
For quantitative analysis of dendritic field orientation, a polar distribution of dendrite mass was obtained for each cell. To do this, a cell image with dendrites reduced to one-pixel-wide lines was placed on a circular mask divided into 24 sectors each subtending 15 deg, with the soma coinciding with the center of the mask. A number of pixels was counted in each sector, divided by the total number of pixels in all sectors, and the fractions were plotted as a polar diagram (Fig. 2A). A joint polar plot of dendrite mass distribution was constructed by superposing plots of 33 cells and averaging the fractions in coinciding sectors (Fig. 2C). In many vertebrates, the geometrical center of GC dendritic field is shifted centrifugally relative to soma. To reveal possible impact of this factor, prior to superposing, each single-cell plot was rotated around its center to the angle between the dorsoventral axis and the direction from the soma to the optic disk (Fig. 2B).
Plots of polar distribution of dendrite mass. (A) Plot of a single cell. Abscissa (Cartezian), percentage of dendrite mass. Ordinate (polar), degrees. The abscissa coincides with the dorsoventral axis of the whole mount. The plot is superposed with the respective cell as seen in the whole mount. The cell is shown in its true position relative to the whole-mount axes. The arrow shows the direction towards the optic disc. (B) The same plot as in (A) rotated, so that the abscissa now coincides with the direction towards the optic disc. (C) Joint plot for 33 cells constructed by by-sector averaging single-cell plots after their rotation as shown in (B). D, dorsal; V, ventral; N, nasal; T, temporal; OD, optic disk. See Materials and methods section for details of plot construction.

Software
There are a lot of software packages performing CA and other procedures described above, for example, SPSS, Statsoft Statistica, NCSS, and R. They offer similar basic functionality, although they differ in interface and details of procedure implementation. In the present study, multivariate analysis and statistical tests were performed using the Statistica 6.0 package (Statsoft Inc., Tulsa, Oklahoma). Specifically, the Basic statistics/Tables module was used for the frequency distribution analysis of the structural parameters and correlation analysis; Nonparametrics, for nonparametric statistical tests and comparisons; Multivariate exploratory techniques, for discriminant function, cluster, and factor analyses. Automatic variable weighting was performed using the OVW program available free at http://www.bio.umontreal.ca/casgrain/en/labo/ovw.html. Some descriptive statistics were obtained using the Data analysis module of MS Excel for Windows XP.
Results
Morphology
A qualitative description of the morphology of AOS GCs in Rana temporaria was made by Podugolnikova et al. (Reference Podugolnikova, Orlov and Reuter1992a) and Cook and Podugolnikova (Reference Cook, Chalupa and Werner2001) and will be only briefly reviewed here to give the reader an idea of the cells under scrutiny. Most AOS GCs were orthotopic, with just a few displaced to the IPL. The cells were monostratified within a narrow (1–2 μm) scleradmost zone of the IPL forming a relatively large profusely branching dendritic arbor (Fig. 3). Higher-order dendrites bore rare en passant and terminal varicosities. They often curved to form loop-like structures. The smallest cells were found in the visual streak and the largest closer to the retina periphery. Neighboring cells were often found in clusters of two to three, with their higher-order dendrites intimately cofasciculating (Figs. 3 and 4).
AOS GCs. Drawing of a cell as seen in the whole mount (A) and reconstruction of its side view (B). The arrowheads mark the axon. (C) Drawing of two neighboring cells in their true retinal context. Note tightly cofasciculating dendrites. (D) Low-power micrograph of several neighboring cells (Nomarski contrast). The focal plane is centered on the scleradmost portion of the IPL. The somata (marked with asterisks), lying at the boundary between IPL and GC layer, are out of focus. The brightness and contrast of the image in (D) were slightly (∼5%) adjusted by using the Gimp 2.6.6 software. Bars (A, C, and D) 100 μm; (B) 10 μm.

Enlarged fragments of the whole mount presented in Fig. 1 with the GCs shown in their true retinal context. (A) Ventrotemporal midperiphery. (B) Nasal midperiphery. (C) Ventronasal midperiphery. Dendrite thickness was slightly enlarged to make thin dendrites visible. Bar (A–C) 500 μm.

Heterogeneity of dendritic field orientation
The cells sampled for the analysis, as well as most of the AOS GCs stained in our whole mounts, had highly asymmetric dendritic arbors shifted centrifugally relative to their somata. The arbors of neighboring cells were shifted in approximately the same direction (Fig. 4). These observations were consistent with the joint polar distribution of dendrite mass for the sampled cells (Fig. 2C). It was constructed by by-sector summing polar distributions of dendrite mass for single cells rotated around soma, so that the direction from the soma to the optic disk coincided with the abscissa (see Materials and methods section). The joint distribution was monomodal (MI = 0.51) and had a peak at 142 deg.
Structural heterogeneity
Table 2 summarizes descriptive statistics of the sampled cells, and Table 3 presents linear correlations between numerical parameters. All strong (R ≥ 0.8) correlations were significant at P ≤ 0.05 (corrected for the number of comparisons). The scatter plots of pairwise distributions of correlated parameters were examined, and no spurious correlations due to outliers were found. None of the parameters were significantly correlated with the distance from the cell to the visual streak (P ≤ 0.05 corrected for the number of comparisons). This suggests that their region-dependent variation was weak within the sampling area. MIs of all parameters were below or close to 0.55 indicating their monomodal distribution. This calls into question their use for classification purposes (Schweitzer & Renehan, Reference Schweitzer and Renehan1997). However, here, we included parameters with low MIs into the initial group of clustering variables to make it as representative as possible. From groups of highly (R ≥ 0.8) correlated parameters, parameters with the highest MIs were selected. This resulted in a set of eleven parameters, DFA, DFAR, BCC, NPD, NBP, SDBP, MR, ABO, ACON, APA, and ARBA. A variety of solutions based on various combinations of parameters were analyzed, and parameters with prominent masking effects and low discriminating power were successively discarded as described in Materials and methods section.
Statistics for the GC types presently describedFootnote a

Measurement units: SA, DFA, IA—μm2; DFP, TDL, TBL—μm; SDD—μm−1; SDBP—μm−2; ARBA— degrees; other parameters are dimensionless.
a See Table 1 for abbreviations.
Pairwise correlations and multimodality indices of the initial parametersFootnote a

See Table 1 for the other abbreviations.
a Correlations significant at P ≤ 0.05 (corrected for the number of comparisons) are in bold.
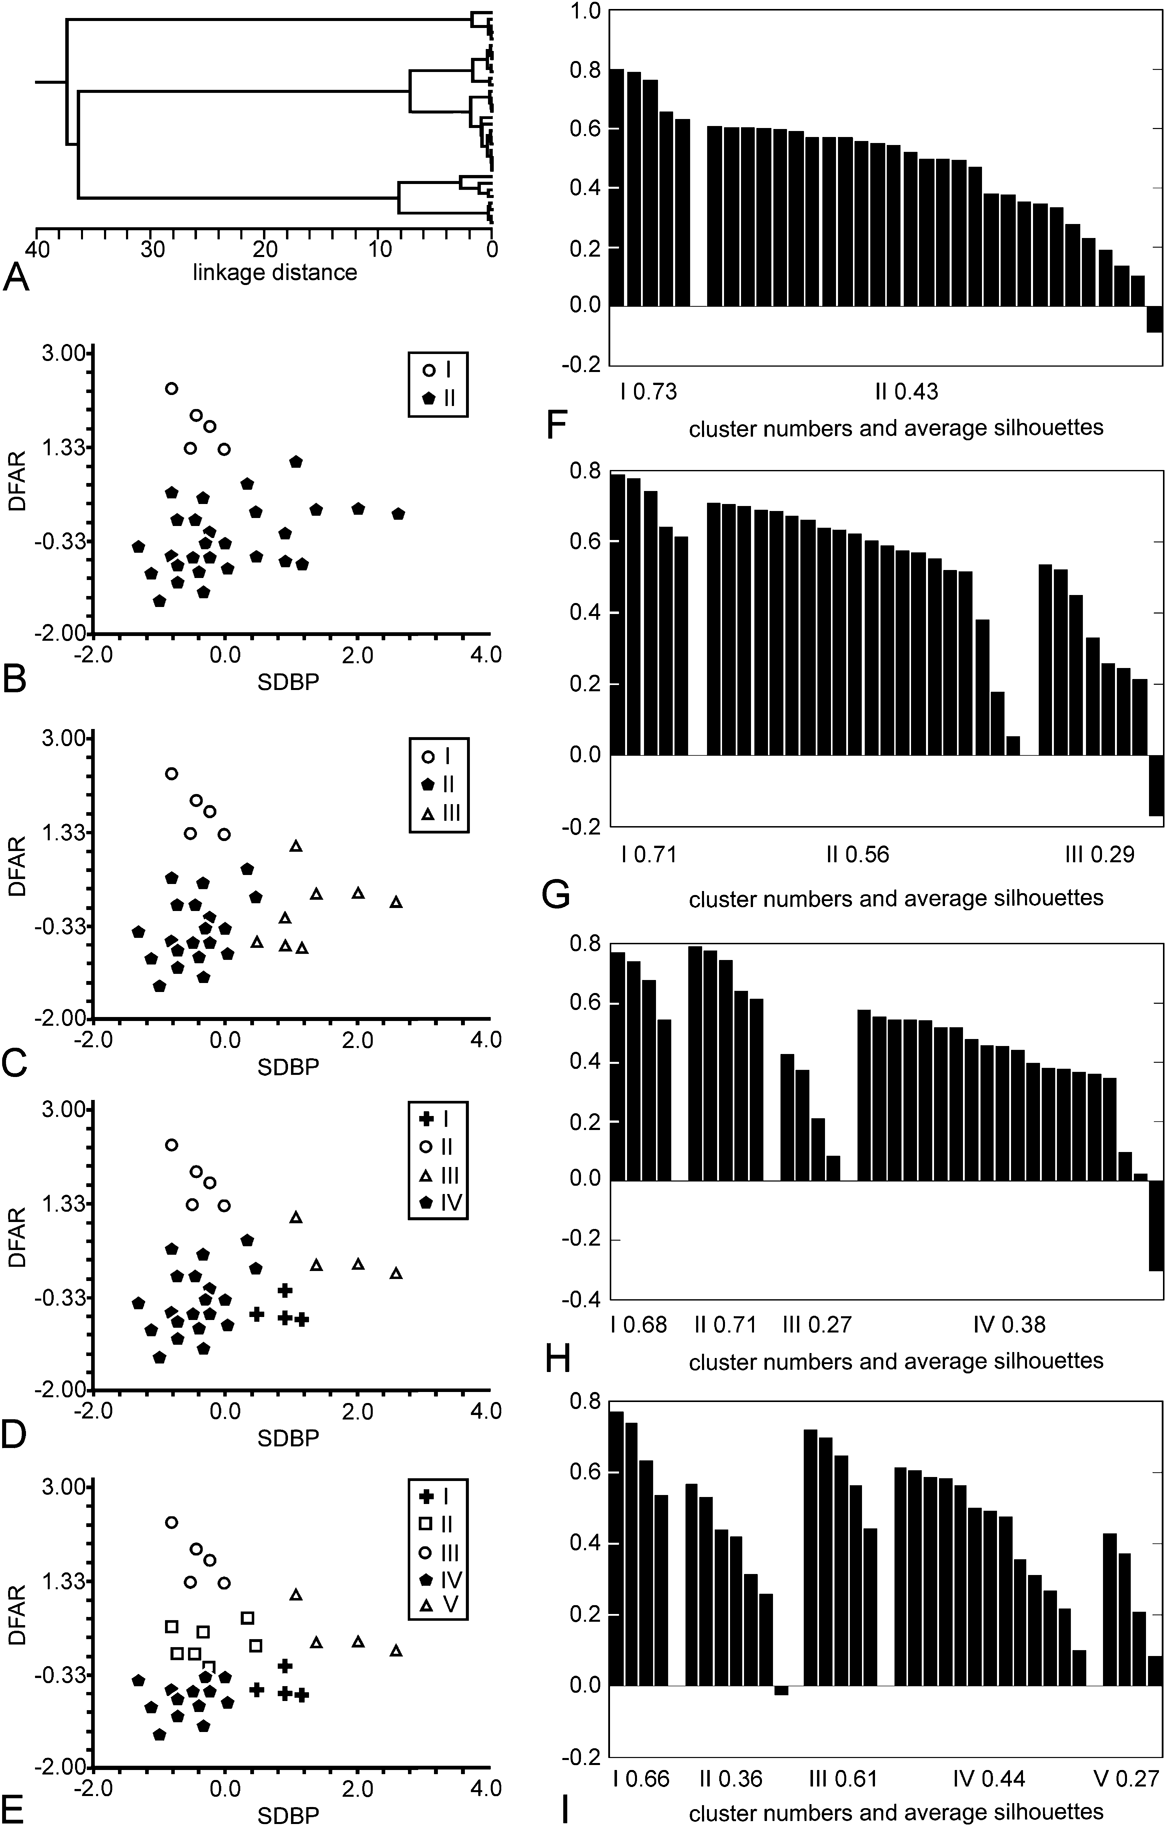
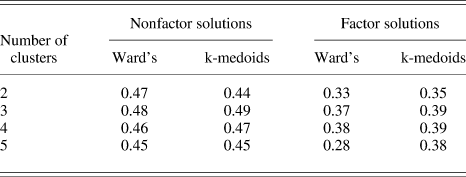
The best nonweighted solutions were based on two parameters, DFAR and SDBP. They were obtained using Ward’s agglomerative algorithm (Fig. 5), while applying k-medoids provided slightly worse results as reflected in SCs of the respective solutions (Table 4).
The best nonfactor solutions (Ward’s method). (A) Cluster dendrogram. (B–E) Scatter plots representing two- to five-cluster solutions, respectively. Boxed symbols designate cluster numbers. (F–I) Silhouette plots for two- to five-cluster solutions, respectively. Bins representing silhouette values of individual cells are grouped by cluster and plotted in decreasing order.

Average silhouettes of the best factor and nonfactor clustering solutions

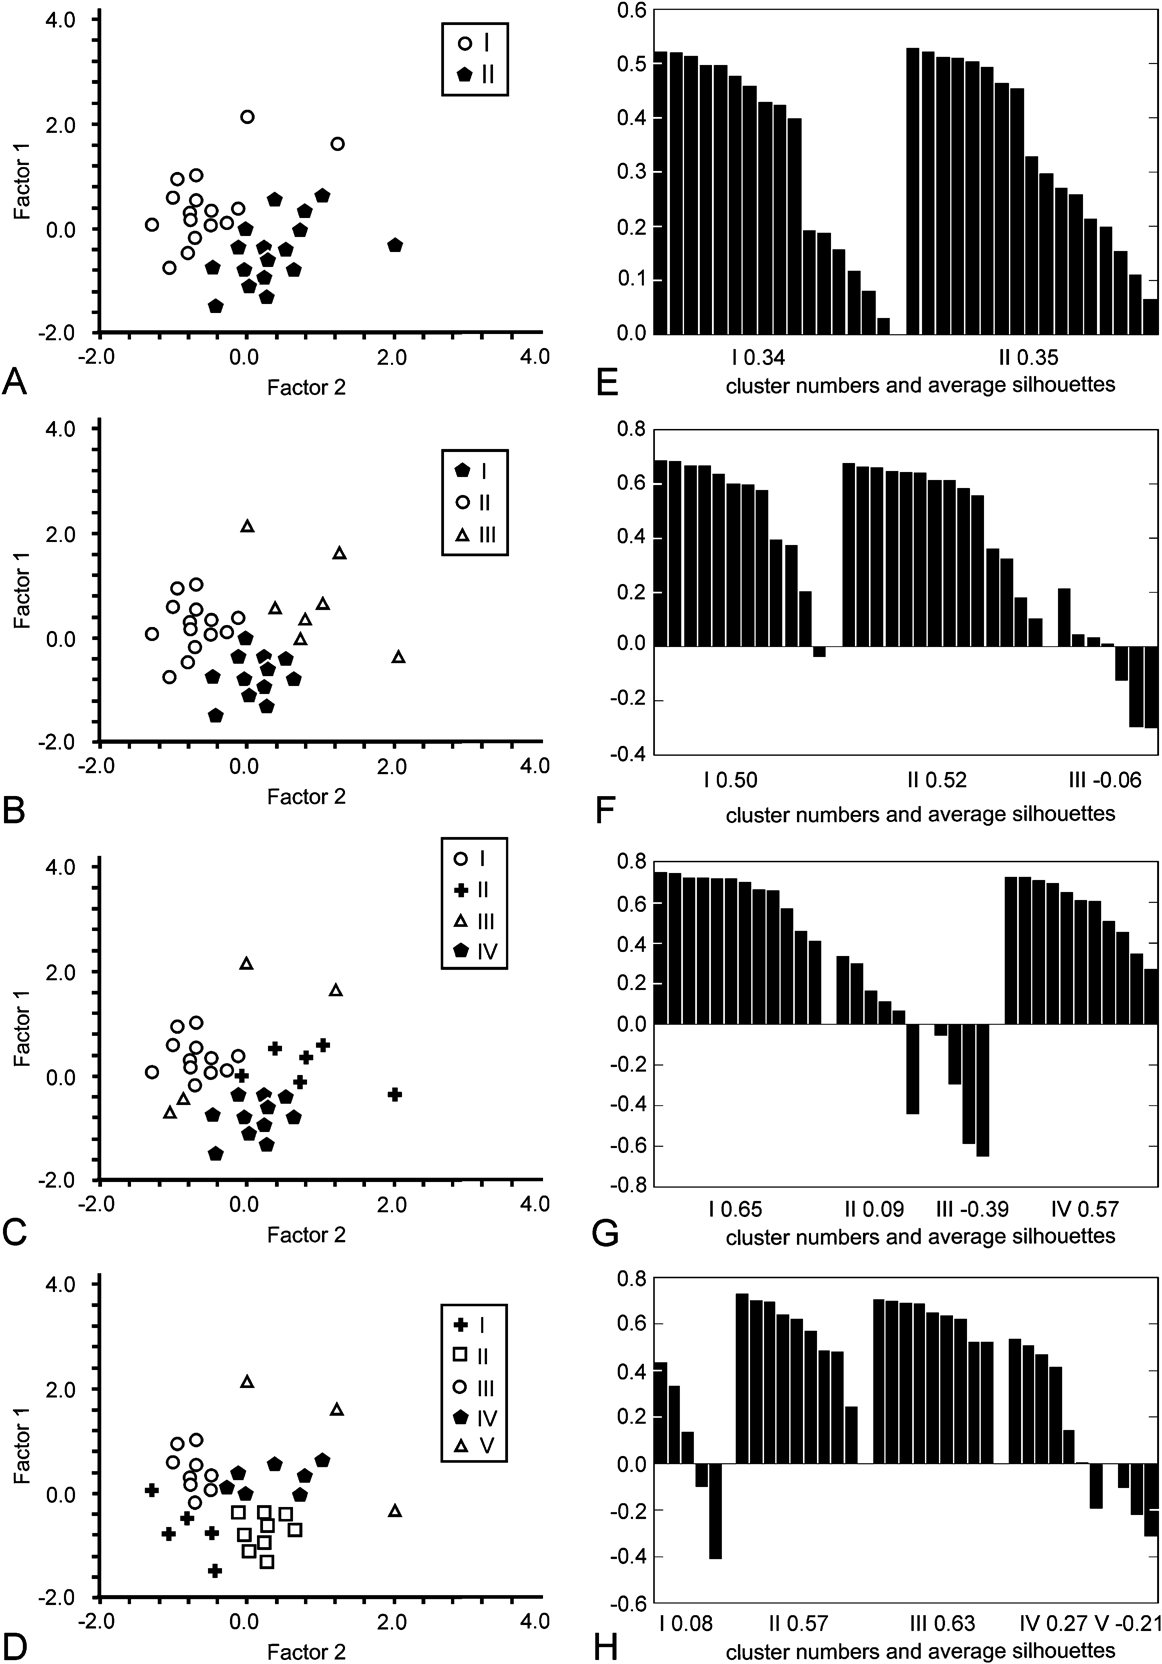
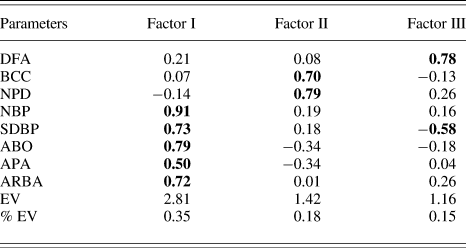
The best factor solutions were based on two significant factors extracted from a set of eight variables (Fig. 6, Table 5). They were obtained using k-medoids partitioning, while Ward’s method provided the second best clustering (Table 4). The MIs of factor variables extracted from the original parameter set varied within 0.36–0.51 indicating monomodal distribution.
The best factor solutions (k-medoids partitioning). (A–D) Scatter plots representing two- to five-cluster solutions, respectively. Boxed symbols designate cluster numbers. (E–H) Silhouette plots for two- to five-cluster solutions, respectively. Bins representing silhouette values of individual cells are grouped by cluster and plotted in decreasing order.

Factor loadings for significant factors extracted from the original data matrixFootnote a

EV, variance explained by a factor. % EV, proportion of the variance explained by a factor to the total variance. See Table 1 for the other abbreviations.
a Loadings with an absolute value of 0.5 or more are in bold.
The quality of the best solutions was quite poor, both by eye (Figs. 5B–5E and 6A–6D) and proceeding from their SCs. The clusters were not cohesive and well isolated from each other as reflected in low SCs of most clusters (Figs. 5F–5I and 6E–6H). The discrepancy in cell assignment between hierarchical and nonhierarchical solutions was quite high varying within 12–30% and 12–21% in nonfactor and factor models, respectively. The SCs of factor and nonfactor solutions varied within 0.39–0.49 and 0.28–0.39, respectively, indicating the absence of a reasonable structure (Table 4). The cophenetic correlation coefficients of Ward’s solutions varied within 0.35–0.61 suggesting their low representativeness (see Materials and methods section).
In case of two- and three-cluster solutions, neighboring cells with considerably (30–60% of field area) overlapping dendritic fields were occasionally assigned to the same cluster.
The quality of the best solutions remained poor as the number of clusters increased (Table 4) implying that a lack of distinct structure was not due to distinguishing too few clusters.
The cluster structure of the best solutions was extremely unstable depending heavily on clustering algorithm, the number of clusters (nonhierarchical solutions, Fig. 6), and random exclusion of a small fraction of cells from the sample.
Kruskal–Wallis ANOVA-on-Ranks with post hoc Mann–Whitney U tests revealed no significant between-cluster differences (P ≤ 0.05, corrected for the number of comparisons), except for a few pairwise differences in three to five-cluster solutions. However, in these solutions, at least one pair of clusters displayed no significant differences in any original or factorial variable.
OVW applied to various variable sets based on either original or factor variables usually led to trivial solutions with one variable given weight 1, and the others, weight 0. In a few cases, it only subtly changed original weights, with the final solutions being essentially the same as their nonweighted counterparts. OVW-weighted solutions were therefore not subject to further analysis.
Discussion
Below, we provide a formal analysis of the present results and discuss the advantages and limitations of the adopted methodology.
Sample and parameter representativeness
As has been noted above, the representativeness of the material and parameter choice are important prerequisites for adequate analysis of neuron diversity. Here, we present the evidence that these prerequisites were met in the present study.
Bastakov et al. (Reference Bastakov, Orlov and Panyutin1992) identified two functional types of AOS GCs in the common frog differing in the preferred direction of stimulus motion. Units of different types occurred in approximately equal proportion. Cook and Podugolnikova (Reference Cook, Chalupa and Werner2001) showed that in the common frog, AOS GCs are distributed as a polymosaic, which can be efficiently modeled by superposition of several regular mosaics. The analysis of the AOS GC polymosaic’s correlogram suggests the presence of two to four types. As distinct from this, Montgomery et al. (Reference Montgomery, Fite and Bengston1981) described six morphological types of AOS GCs in the leopard frog. However, their system has serious drawbacks. First, it is not based on a set of quantitative parameters related to various aspects of cell morphology and does not use automatic clustering algorithms—two important prerequisites of an adequate classification (Rodieck & Brening, Reference Rodieck and Brening1983). Second, it is partly based on the level of location of cell body in the retina, a feature often varying within a single GC type (Cook, Reference Cook and Podugolnikova2003). Third, it does not obviously take into account region-dependent variation in GC morphology. We therefore believe that these authors overestimated the actual number of AOS GC types in the leopard frog. In other vertebrates, three (in some birds, four) functional AOS GC types have been described (e.g., Oyster & Barlow, Reference Oyster1967; Bowling, Reference Bowling1980; Wylie & Frost, Reference Wylie and Frost1990; Deplano & Pedemonte, Reference De Soete2002; Sun et al., Reference Sun, Deng, Levick and He2006), which has a sound physiological ground (Giolli et al., Reference Giolli, Blanks and Lui2005). Given the above, the number of AOS GC types in R. temporaria is probably no more than three. Therefore, the GC sample presently used seems sufficiently large to reveal potential between-type differences in morphology of AOS GCs and identify their morphological types.
As has been described above, GCs of the same type form regular mosaics spatially independent from those formed by other GC types (Cook, Reference Cook and Podugolnikova2003). Neighboring cells of the same type respect each others territory, while those of different types may overlap considerably. In the present case, neighboring AOS GCs with substantially overlapping dendritic arbors probably differ in preferred direction of stimulus motion. As the bulk of the sample is formed by clusters of such cells, we expect it to represent functionally different AOS GCs in nearly equal proportions.
The parameters used to describe the sample were related to various aspects of cell morphology, particularly, dendritic field size and shape (DFA, DFP, IA, DFAR, DFC), soma size (SA), dendrite course and arborization (ACON, ARBA, NBP, NPD, SDBP, SDD), dendritic arbor topology (ABO, APA), and surface and overall structural complexity (BCC, MR, TBL). We are therefore quite sure that our parameter set represents well the morphology of the cells studied. Note that the level of dendrite stratification in the retina was deliberately excluded from the analysis as frog AOS DCs vary negligibly in this parameter (see Materials and methods section).
Structural heterogeneity of AOS GCs
The cells studied displayed no apparent heterogeneity in orientation of dendritic arbor. The visual inspection revealed a considerable centrifugal shift of their arbors relative to the somata as confirmed by monomodal joint distribution of their dendrite mass. This centrifugal shift is a well-known phenomenon typical of many GC types in all vertebrate classes (e.g., Kalinina & Zhukov, Reference Kalinina and Zhukov1985; Bloomfield, Reference Bloomfield1994; Kittila & Granda, Reference Kittila and Granda1994; Mangrum et al., Reference Mangrum, Dowling and Cohen2002). It is partly accounted for by exclusionary dendritic interactions between growing cells and their more centrally located older counterparts (Hitchcock & Easter, Reference Hitchcock1986; Hitchcock, Reference Hitchcock and Easter1989).
CA did not reveal a reasonable and statistically reliable cluster structure in the cell sample studied. Bearing in mind low MIs of original parameters and a lack of significant correlations between structural parameters and distance from the visual streak, we conclude that the bulk of the observed variation among the cells under scrutiny is random in nature.
The present results suggest that frog AOS GCs with different preferred directions do not differ in morphology or dendritic arbor orientation. This agrees with what is known about AOS GCs in other vertebrates. Qualitative estimations made in available studies report no structural heterogeneity among AOS GC populations retrogradely labeled from the AOS nuclei and therefore potentially comprising different functional types (turtle: Kittila & Granda, Reference Kittila and Granda1994; Zhang & Eldred, Reference Zhang and Eldred1994; chameleon: Bellintani-Guardia & Ott, Reference Bellintani-Guardia and Ott2002; chicken: Reiner et al., Reference Reiner, Brecha and Karten1979; rabbit: He & Masland, Reference He and Masland1998; mouse: Yonehara et al., Reference Yonehara, Ishikane, Sakuta, Shintani, Nakamura-Yonehara, Kamiji, Usui and Noda2009). The present findings are also anticipated by many parallelisms and similarities between AOS GCs and another group of directionally selective GCs, so-called ON–OFF GCs, projecting to the superior colliculus in amniotic vertebrates (Oyster, Reference Oyster and Barlow1968; Uchiyama et al., Reference Uchiyama, Kanaya and Sonohata2000). There are four functional types of ON–OFF GCs that are morphologically indistinguishable (Vaney et al., Reference Vaney, He, Taylor, Levick, Zanker and Zeil2001). However, a decisive evidence on the present issue requires that functional identity of each cell be revealed prior to structural analysis. This could be done, for example, by intracellular recording from individual cells with subsequent dye injection or by selective retrograde labeling provided that axons of functionally different AOS GCs are spatially segregated.
Methodological considerations
In the present study, we tried to be as consistent as possible in meeting formal prerequisites for CA and other statistical procedures and tests we used. We found that all solutions containing more than one cluster were spurious. Their spurious nature was easily detected by eye and confirmed by silhouette analysis and statistical tests suggesting that the sample under scrutiny is structurally homogeneous. There is independent evidence in favor of structural homogeneity of frog AOS GCs (see above).
Previously, CA and related techniques were successfully used to reveal heterogeneity in neuron populations and discover neuron types (e.g., Pennartz et al., Reference Pennartz, De Jeu, Geurtsen, Sluiter and Hermes1998; Nowak et al., Reference Nowak, Azouz, Sanchez-Vives, Gray and McCormick2003; Kong et al., Reference Kong, Fish, Rockhill and Masland2005). Here, we demonstrated that it can also be effectively used for reliable confirmation of homogeneity of neuronal populations including those formed by several neuron types.
The major drawback of multivariate classification techniques including CA is that variables discriminating well between some clusters discriminate poorly between others, degrading the classification quality. This usually limits the number of variables in the model. The problem may be partially solved by using dimensionality reduction techniques such as factor analysis or multidimensional scaling. However, they are not always applicable, and their use results in a partial loss of information about sample variability (Jain & Dubes, Reference Jain and Dubes1988; Gordon, Reference Gordon1999). In recent years, some sophisticated clustering algorithms have been proposed that allow the above difficulties to be partially obviated (e.g., Ertöz et al., Reference Ertöz, Steinbach and Kumar2001; Friedman & Meulman, Reference Friedman and Meulman2004). Their effectiveness for neuron classification is yet to be tested. In the present case, diminishing the number of variables in the model, as well as using CA, did not result in a substantial improvement of the solution quality, with the best factor and nonfactor solutions displaying similar SCs. This is apparently explained by low masking effects of irrelevant variables and relatively equal discriminating potential of all variables in case of homogenous samples like the present one.
The basic limitation of any classification approach is a limited set of parameters. When considering neurons, usually it is not known whether the parameters in hand reflect the between-type variability sufficiently well for all neuron types to be discovered even if the population is excellently represented. It is therefore important to compare different classifications based on different parameter sets (e.g., morphological vs. physiological ones) to elaborate a comprehensive view on the diversity of the neurons in hand. In the retina, the analysis of the spatial arrangement of neuron populations proved to be effective in discovering neuron types. Different types of retinal neurons, in particular, GCs, form nonrandom mosaics spatially independent from those formed by other types (Wässle & Boycott, Reference Wässle and Boycott1991; Cook, Reference Cook and Podugolnikova2003). Normally, such mosaics are first revealed by the morphology of their neurons. Their regularity and spatial independence are then analyzed using special algorithms to (dis)prove their presumptive identity. However, some neuronal types cannot be easily distinguished by morphology and so their mosaics cannot be discerned. In this case, using multivariate approaches like the present one may be especially useful as it may help one to identify clusters in the data that potentially correspond to natural types. The adequacy of this preliminary classification may be then checked by analyzing spatial arrangement of mosaics formed by neurons assigned to different clusters as described above.
Acknowledgments
The authors are grateful to Dr. Vladimir Bastakov (A.A. Kharkevich Institute of Information Transmission Problems, Moscow, Russia) for providing one of the retinal whole mounts used in the study and to Dr. Elena Maximova from the same institute for her valuable comments and suggestions on the manuscript. The study was supported in part by the Russian Foundation for Basic Research (grants 01-04-48515, 01-04-63112, and 02-04-07559), by the President of the Russian Federation’s grant for young candidates and doctors of science (MK-1573.2009.4), and by the Far Eastern Branch of the Russian Academy of Sciences (grants 09-I-OBN-09, 09-III-B-06-259, and 09-III-A-06-208).