Introduction
Neuroticism is a latent factor that consistently appears in factor analyses of different sets of adjectives that people use to describe daily behaviours and features in all the major personality models (e.g. Eysenck & Eysenck, Reference Eysenck and Eysenck1985; Cloninger, Reference Cloninger1986; McCrae & Costa, Reference McCrae and Costa1997). As a moderately heritable trait, neuroticism is regarded as an important marker of (genetic) ‘vulnerability’ for internalizing disorders, as shown by its predictive value with regard to onset, duration and outcome of mild and severe depression (Goodwin et al. Reference Goodwin, Fergusson and Horwood2003; Ormel et al. Reference Ormel, Rosmalen and Farmer2004). Neuroticism is also associated with the genetic risk for depression (e.g. Jardine et al. Reference Jardine, Martin and Henderson1984; Kendler et al. Reference Kendler, Kessler, Neale, Heath and Eaves1993; Khan et al. Reference Khan, Jacobson, Gardner, Prescott and Kendler2005; Hettema et al. Reference Hettema, Neale, Myers, Prescott and Kendler2006), generalized anxiety disorder (Hettema et al. Reference Hettema, Neale, Myers, Prescott and Kendler2006; Kendler et al. Reference Kendler, Gardner, Gatz and Pedersen2006; Mackintosh et al. Reference Mackintosh, Gatz, Wetherell and Pedersen2006) and panic disorder and phobias (Hettema et al. Reference Hettema, Neale, Myers, Prescott and Kendler2006). In addition, neuroticism is related to exposure to stressful situations (Ormel & Wohlfarth, Reference Ormel and Wohlfarth1991; Kendler et al. Reference Kendler, Gardner and Prescott2003), and modifies the effect of stressors to increase the risk for depression (Ormel et al. Reference Ormel, Oldehinkel and Brilman2001).
In spite of this, the nature of the vulnerability of neuroticism to psychopathology is unclear and therefore limits its use as an explanatory concept in aetiological theory and research of psychopathology (Ormel et al. Reference Ormel, Rosmalen and Farmer2004). In this context, a meaningful approach is to expand our knowledge of the physiological, cognitive and behavioural underpinnings of neuroticism. The importance of cognitive processes is reflected in definitions that characterize neuroticism as a broad dimension of individual differences in the tendency to experience negative, distressing emotions and to possess associated behavioural and cognitive traits (Costa & McCrae, Reference Costa and McCrae1987). This conceptualization of neuroticism taps into cognitive theories of depression, in which the role of negative biases in information processing is emphasized. According to Beck's model (Beck et al. Reference Beck, Rush, Shaw and Emery1985), vulnerability to depression consists of tendencies to negatively interpret the self, others and the future. Via an attention bias the encoding of negative (emotional) stimuli is favoured, affecting various aspects of processing (i.e. reasoning, memory) and this negative processing may play a role in the onset and recurrence of depression (Beck et al. Reference Beck, Rush, Shaw and Emery1985).
The cognitive basis of neuroticism is an area of research which is well represented and has been reviewed by several authors (e.g. Martin, Reference Martin1985; Mathews & MacLeod, Reference Mathews and MacLeod1994; Rusting, Reference Rusting1998). In most of these studies neuroticism is related to cognitive processing of emotional rather than neutral information. The reviews show that the most promising cognitive processes studied are: biases in attention (high-neuroticism individuals show increased attention to negative or threatening information, and are faster to respond to similar stimuli); biases in interpretation (high-neuroticism persons tend to interpret ambiguous words in a negative way and make inferences that serve to maintain awareness of threat); biases in memory (high-neuroticism individuals show an enhanced recall of negative or threatening information).
The present study investigates the cognitive basis of neuroticism by investigating the relationship between a composite score of neuroticism (Ncomp) and (i) the proportion of recalled pleasant and unpleasant words and (ii) the reaction time (RT) on target stimuli while inducing pre-conscious bias by subliminally presented emotional or neutral stimuli (Ekman & Friesen, Reference Ekman and Friesen1976; faces). A genetically sensitive design was used including identical and non-identical twin pairs from a volunteer twin sample from the general population. The additional information provided by the twin design is not only estimates of heritabilities of the cognitive tasks, but also the extent to which their correlation with neuroticism is due to genetic and/or environmental factors.
The specific hypotheses are: (i) that high neuroticism is associated with recall of more unpleasant (negative) than pleasant words; (ii) that neuroticism is associated with faster responses to target stimuli when presented at the location of an emotionally negative cue; (iii) that previous effect might be most apparent in the left visual field (right hemisphere involvement) as proposed by Mogg & Bradley (Reference Mogg and Bradley1999) ; (iv) that these associations will be due to genetic rather than environmental factors. A genetic relationship could indicate that the liability to, for example, depression and anxiety disorders is mediated by genetic influences that predispose individuals to experience negative, distressing emotions and the tendency to focus on negative (emotional) stimuli. In addition, we explored the possibility of nonlinear associations between neuroticism and the cognitive measures (i.e. the correlations are a function of the level of neuroticism so that neuroticism is both a variable of interest and a moderator).
Method
Subjects
This study is part of a larger project named the Twin Interdisciplinary Neuroticism Study (TWINS) in which the genetic and environmental origins of neuroticism are explored. The sample for the TWINS was randomly selected from the Groningen Twin Register (GTR) established in 2001. In 2002 (T1), the 1047 participants of the GTR returned a survey, including a zygosity questionnaire (Nichols & Bilbro, Reference Nichols and Bilbro1966) to determine whether a twin pair is monozygotic (MZ) or dizygotic (DZ). For the current study a group of 125 female twin pairs (74 MZ and 51 DZ) between ages 18 and 30 years were randomly selected from the GTR and invited to our psychophysiological laboratory in 2002 and 2004 (T2). Zygosity of this group was determined using 10 microsatellite markers. Due to technical failures, zygosity of three twin pairs could not be determined by DNA and the zygosity questionnaire information was used. All subjects reported normal or corrected to normal vision. The Ethics Committee of the University Medical Centre Groningen approved the study, and all subjects gave written consent prior to participation. General characteristics of the study sample are reported elsewhere (Riese et al. Reference Riese, Rosmalen, Ormel, van Roon, Oldehinkel and Rijsdijk2007).
Characterization of neuroticism
Four neuroticism measures were available for each subject. At T1 neuroticism was evaluated with the NEO Five Factor Inventory (NEO-FFI) (Costa & McCrae, Reference Costa and McCrae1992; Hoekstra et al. Reference Hoekstra, Ormel and De Fruyt1996). At T2 neuroticism was evaluated with the NEO-FFI and the Eysenck Personality Questionnaire (Eysenck & Eysenck, Reference Eysenck and Eysenck1975; Sanderman et al. Reference Sanderman, Eysenck and Arrindell1991). To control for self-report bias, subjects also filled out the NEO-FFI for their co-twin sister at T2. To simplify analyses but maximize all available information, for each individual a composite score (Ncomp) was generated by the latent variable score estimator (LaVaSE) program (Campbell et al. Reference Campbell, Rijsdijk and Sham2007) using the correlational structure of the four neuroticism scores, accounting for both rater bias and zygosity misclassification of twin pairs (Riese et al. Reference Riese, Rosmalen, Ormel, van Roon, Oldehinkel and Rijsdijk2007). Similar models have shown a substantial decrease in variance attributed to individual-specific environment and a proportional increase in heritability of liability for, for example, major depression and generalized anxiety disorder (Kendler et al. Reference Kendler, Prescott, Jacobson, Myers and Neale2002). This could increase the power to detect familial correlations between neuroticism and the cognitive measures. The Ncomp was available for a larger sample: 115 MZ and 91 DZ pairs.
Free recall task
Stimuli and procedure
The task consisted of eight word lists, each containing 11 words from one of eight categories: pleasant or unpleasant, social or non-social, verbs or nouns (Tops et al. Reference Tops, van der Pompe, Baas, Mulder, Den Boer, Meijman and Korf2003). For each subject, the order of the word lists was randomized, with the restriction that no more than two pleasant or two unpleasant lists were presented consecutively. The order of the words within each list was also randomized. Words were presented in the middle of a computer screen for 1 s, followed by a white central fixation-cross (2 s). After presentation of each list, subjects had 2 min to write down as many words as they could remember. Subjects were instructed to pay close attention and to try to remember as many words as possible.
In order to assess primacy and recency effects, for each of the eight categories the proportion of recalled words was generated for the first four and last four words (omitting the middle three), yielding scores of 0, 0.25, 0.50, 0.75 or 1. However, for current analyses, the total proportion recalled of pleasant and unpleasant words was summed across the primacy/recency, social/non-social and verb/noun dimensions, yielding scores for pleasant and unpleasant words, both with theoretical values between 0 and 8. The scores were approximately normally distributed (range 2–7) with a skewness of −0.21 and −0.22, respectively.
Dot-probe task
Stimuli and procedure
Mogg & Bradley's ‘emotion face dot-probe task’ (Mogg & Bradley, Reference Mogg and Bradley1999) was used as a template for the task developed in the current study to test pre-attentive biases for threat faces. The face stimuli used consisted of Ekman & Friesen (Reference Ekman and Friesen1976) pictures of different individuals. The presented face pairs (equal number of male and female faces) consisted of two pictures of the same person: one threat and one neutral, each 50×70 mm. Using E-Prime® software (version 1.1.4.1. for Windows ME; Psychology Software Tools Inc., Pittsburgh, PA, USA), face pairs were presented side by side in the centre of the monitor of a standard personal computer with a distance of 70 mm between the inside of the pictures. Pictures were black and white and all other stimuli were black drawings presented against a white background. Subjects were seated about 100 cm from the monitor.
Preceded by a central fixation-cross (500 ms), a face pair was displayed for 19 ms, followed by a 50 ms display of a mask pair (randomly reassembled bits of a pair of neutral faces) and a blank period of 19 ms. A dot-group-pair was then presented at the same location of the mask pair, consisting of a group of 11 dots, and a group of either three or four dots (the probe). Subjects were asked to indicate whether they had seen three (pressing a left button) or four dots (pressing a right button). They were instructed to respond as quickly as possible, while avoiding errors. RTs in ms were recorded using a stop clock that started at the onset of the dots display, and stopped at the response. The position (left/right visual field) of the threat faces and the number of three or four dots were balanced across trials so that each appeared in either location with equal frequency. The order of presentation of the face pairs was randomized. The task comprised of 26 practice trials, followed by 96 experimental trials and was administered twice. In the visual feedback session after each trial the correct number of dots were presented (for 1000 ms) in the centre of the screen (in Courier New 18-point font). In the auditory feedback session after each wrong response the subjects were submitted to 100 dB white noise (for 500 ms). Subjects were familiarized with the auditory feedback before starting the second session. For current analyses, we use two different definitions of attention bias: first, raw RTs on dot-probes presented at either the position of the neutral or the threat face (i.e. RTs on incongruent and congruent trials). The idea is that subjects preferentially allocate attention to spatial locations with threat faces rather than neutral faces and, therefore, are expected to respond faster on a probe that is presented in an attended rather than unattended region of the visual space (Mogg & Bradley, Reference Mogg and Bradley1999). For this purpose, the RTs were averaged across feedback type and number of dots, yielding approximately normally distributed scores for the right-neutral, right-threat, left-neutral and left-threat conditions, with skewness of 0.36, 0.36, 0.41 and 0.39, respectively. Second, we considered a frequently used within-subject bias measure: left- and right-bias scores, calculated by subtracting the mean RT of congruent from incongruent dot-probes presented in the left and right visual field, respectively.
Awareness check
The time required to become aware of a visually presented stimulus is highly variable between individuals: 14–40 ms. Since we wanted to explore the effects of subliminally presented stimuli, an awareness check was performed, by using a forced-choice gender discrimination task using the same face stimuli and stimulus durations used in the dot-probe task (response was pressing one of two buttons). There were eight practice trials and 48 main trials, comprising an equal number of male and female faces. Subjects not performing on chance level were excluded from the analyses of the dot-probe task as they might have had some level of conscious information processing.
Statistics
Phenotypic analyses
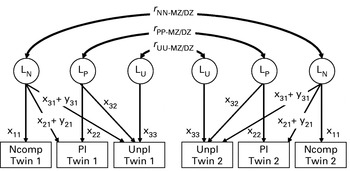
To account for the pair-wise (non-independent) structure of the data, correlations between variables were estimated using the structural equation-modelling program Mx (Neale, Reference Neale1999). Fig. 1 depicts the model used for the analyses of the Ncomp and recalled pleasant/unpleasant words (note that a similar model was used for Ncomp and RT in threat and neutral valence conditions). The within-person correlations (Fig. 1) are specified as a Cholesky decomposition, where the path x11 represents the standard deviation of variable 1, and the paths x22 and x21 represent the standard deviations of variable 2 independent and dependent of variable 1, respectively (note that the squared path coefficients will represent the variances). All paths are constrained to be the same across twins and zygosity groups in order to produce one set of within-person correlations. The correlations between the latent factors (LN, LP, LU of twin 1 and 2) are estimated in MZ and DZ twin groups separately.
The phenotypic correlation model. Ncomp, Neuroticism composite score; Pl, proportion of recalled pleasant words; Unpl, proportion of recalled unpleasant words. Cross-twin correlations (r) between the latent factors (LN, LP, LU) are estimated separately for the monozygotic (MZ) and dizygotic (DZ) twins. The within-person correlations are specified as a Cholesky decomposition, with x11, x22 and x33 representing the variable-specific standard deviations of variables 1, 2 and 3, respectively. The covariance between, for example, Ncomp and Pl consists of a moderator-independent part (x11×x21) and moderator-dependent part (x11×y21), which is multiplied by Ncomp to see how the total covariance changes as a function of Ncomp level. This is illustrated in Fig. 2.

Moderator effects
To examine whether the correlation between Ncomp and each of the cognitive variables changes as a function of the level of Ncomp, one could estimate the correlations for different subgroups based on the level of the Ncomp. However, a more powerful approach is using the full continuous distribution of the moderator (Ncomp in this case) by means of fitting a model that differs for each subject in the sample (Neale et al. Reference Neale, Boker, Xie and Maes2002; Purcell, Reference Purcell2002). This moderating effect is modelled in the parameters y21 and y31 (Fig. 1). The covariance between, for example, Ncomp and the proportion of recalled pleasant words (Pl) will now consist of a moderator-independent part (x11×x21) and -dependent part (x11×y21), which is then multiplied by Ncomp to see how the total covariance changes as a function of Ncomp level (see Fig. 2).
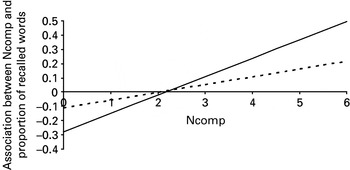
Moderator effect of neuroticism composite score (Ncomp) on the association between Ncomp and proportion of recalled pleasant words (Pl; - - -) and unpleasant words (Unpl; ––). The expected positive correlation between neuroticism and Unpl is observed only at the higher end of the distribution (i.e. Ncomp >5). The moderator effect of Ncomp on the association Ncomp–Pl was non-significant.

Genetic model fitting
In the classical twin design, the differences between identical (MZ) and non-identical (DZ) intra-pair covariances provide the power to decompose the variation of a trait (individual differences) into additive genetic influences (A, the sum of the average effects of the individual alleles at all loci affecting the phenotype), shared (familial) environmental influences (C) and individual-specific factors (E, influences that are not shared between family members) (Neale & Cardon, Reference Neale and Cardon1992). Maximum-likelihood estimates of the components were estimated by the Mx program (Neale, Reference Neale1999), which minimizes a goodness-of-fit statistic between observed and model-predicted variance-covariances. Confidence intervals (CIs) of parameter estimates were obtained by maximum likelihood (Neale & Miller, Reference Neale and Miller1997).
When more than one trait is measured in each twin, this model can be extended to the multivariate case, in which the cross-trait, cross-twin correlations of the MZ and DZ pairs provide the additional information to partition the phenotypic correlation between variables within individuals into genetic, shared-environmental and non-shared environmental components (Neale & Cardon, Reference Neale and Cardon1992).
Moderator effects
To test whether the A, C or E components of the correlation between Ncomp and the cognitive variables change as a function of the level of Ncomp, one can use the same approach as described above using continuous moderator values (Purcell, Reference Purcell2002).
Results
Neuroticism and word recall
Phenotypic analysis
The twin correlations for Ncomp were r MZ=0.87 (95% CI 0.82–0.91) and r DZ=0.61 (95% CI 0.46–0.72); for the proportion of recalled pleasant words (Pl), r MZ=0.33 (95% CI 0.12–0.51) and r DZ=0.30 (95% CI 0.03–0.52); for the proportion of recalled unpleasant words (Unpl), r MZ=0.42 (95% CI 0.22–0.58) and r DZ=0.26 (95% CI −0.01 to 0.49). The correlation between and Pl and Unpl was significant: 0.58 (95% CI 0.49–0.66). The model depicted in Fig. 1 (incorporating moderator effects) showed a good fit to the data [χ2(35)=40.2, p=0.25], meaning a non-significant difference between observed and predicted variances and covariances. Estimated correlations between Ncomp and Pl and Unpl were non-significant: −0.05 (95% CI −0.18 to 0.08) and −0.10 (95% CI −0.23 to 0.03), respectively. Based on the moderator-dependent and -independent path coefficients, the correlations between Ncomp and either Pl or Unpl can be plotted as a function of Ncomp level (Fig. 2). The graph shows that for the higher scorers on Ncomp, the correlation between Ncomp and Pl increases from −0.11 to 0.21 and the Ncomp–Unpl correlation from −0.28 to 0.50, but only the latter increase was significant [Δχ2(1)=7.2, p=0.007]. In other words, a significant linear relationship between Ncomp and Unpl is present at the higher end of the Ncomp distribution. This means that, as predicted, high neuroticism subjects show an increased proportion of recalled unpleasant but not pleasant words.
Genetic analysis
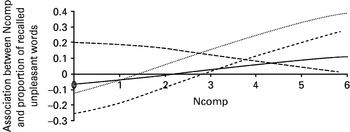
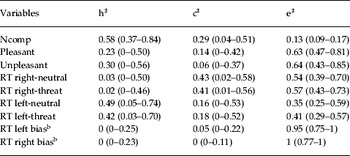
In order to test whether the increased association between neuroticism and recall of unpleasant words for increased levels of Ncomp is due to genetic or environmental effects (whether there is a genetic basis for this association) a standard genetic (ACE) model incorporating moderator effects was fitted to the data. This model showed a good fit to the data [χ2(25)=29.3, p=0.25]. Standardized estimates of A, C and E influences on the variables are shown in Table 1 (upper panel). Ncomp shows both significant heritable (58%) and shared-environmental (30%) effects. Although both word recall measures show significant familial effects (A=37%+C=36%), there was no power to detect the genetic and shared-environmental components individually. Fig. 3 shows how the phenotypic correlation between neuroticism and recall of unpleasant words as a function of moderator level is composed of genetic, C and E effects. None of these effects were individually significant. Dropping all three simultaneously resulted in a similar χ2 difference as in the phenotypic moderator model, but achieved only marginal significance at 3 degrees of freedom [Δχ2(3)=6.5, p=0.09]. However, Fig. 3 shows that the trajectory of the phenotypic correlation as a function of the moderator is closely followed by its shared-environmental component, not the genetic one.
Moderator effect of neuroticism composite score (Ncomp) on the total phenotypic correlation between Ncomp and proportion of recalled unpleasant words (........) and its A (– – –), C (- - - -) and E (——) components. The trajectory of the total phenotypic correlation is mostly reflected by the effects of shared environment (component C).

Standardized estimates of the ACEFootnote a model (with 95% CI) for Ncomp, proportion of recalled pleasant and unpleasant words, RT on neutral and threat valenced conditions and bias measures in the dot-probe task

CI, confidence interval; Ncomp, neuroticism composite score; RT, reaction time; h2, c2 and e2, standardized effects of A, C and E factors on the variance of the traits; RT neutral or threat, RTs on neutral or threat valenced stimuli; RT right or left, RTs on stimuli administered in the right or left visual field.
a For ACE, A represents additive genetic influences (the sum of the average effects of the individual alleles at all loci affecting the phenotype), C represents shared (familial) environmental influences, and E represents individual-specific factors (influences that are not shared between family members).
b Left and right RT biases refer to difference scores between RTs on threat and neutral trials.
Neuroticism and dot-probe task
Preliminary processing
On the awareness check all subjects scored within the allowed limits of chance performance. The mean proportion of correct scores on the gender discrimination task was 50.5%, and the maximum percentage of accurate answers was 66.7%, which is comparable with that reported by Mogg & Bradley in Reference Mogg and Bradley1999 (67%). On the visual dot-probe task one subject with an accuracy rate of 50% was excluded because of failure to comply with the task instruction. In addition, trials with errors and RTs deviating more than 3 standard deviations from the mean were discarded (2.1% and 1.2%, respectively). On the auditive dot-probe task data, these exclusions were 1.2% and 1.1% of the data, respectively. RTs on non-correct responses were substituted by missing values before aggregation.
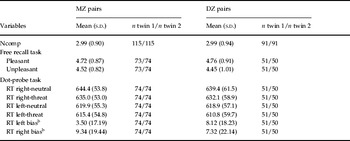
In Table 2 mean RTs are given for the four conditions. There were no RT differences across zygosity groups for the right-neutral, right-threat, left-neutral and left-threat condition [Δχ2(1)=0.30, 0.12, 0.00, and 0.27, p=0.58, 0.73, 0.99 and 0.61, respectively]. Significantly shorter RTs were observed in the threat condition for the left [Δχ2(1)=19, p<0.001] and right visual field [Δχ2(1)=40, p<0.001]. This effect was not stronger for the left visual field as previously reported (Mogg & Bradley, Reference Mogg and Bradley1999), but on average RTs where faster for both neutral and threat valence dot-probes in the left visual field [Δχ2(1)=61.7 and 53.3, p<0.001]. For the bias scores (as measured by the differences in RT between threat and neutral trials), there were no mean differences across zygosity groups in each of the visual fields nor across visual fields.
Descriptive statistics for NcompFootnote a, recalled pleasant and unpleasant words, and RT (ms) for neutral and threat valenced dot-probes and bias measures in the left and right visual fields (dot-probe task)

Ncomp, Neuroticism composite score; RT, reaction time; MZ, monozygotic; DZ, dizygotic; s.d., standard deviation; n, number of individuals; RT neutral or threat, RTs on neutral or threat valence stimuli; RT right or left, RTs on stimuli administered in the right or left visual field.
a Ncomp scores were available for a larger sample.
b Left and right RT biases refer to difference scores between RTs on threat and neutral dot-probes.
Phenotypic analysis
The twin correlations for RTs in the four conditions were as follows: right-neutral, r MZ=0.42 (95% CI 0.22–0.58), r DZ=0.48 (95% CI 0.25–0.66); right-threat, r MZ=0.37 (95% CI 0.16–0.54), r DZ=0.48 (95% CI 0.24–0.65); left-neutral, R MZ=0.64 (95% CI 0.49–0.75), r DZ=0.41 (95% CI 0.16–0.60); left-threat, r MZ=0.58 (95% CI 0.41–0.70), r DZ=0.41 (95% CI 0.16–0.60). Estimated correlations between Ncomp and right-neutral, right-threat, left-neutral and left-threat RTs were all non-significant: 0.08, 0.07, 0.06 and 0.03, respectively. The model depicted in Fig. 1 (but in which Pl and UnPl are replaced by ‘neutral’ and ‘threat’) showed a good fit to the Ncomp and right visual field data [χ2(35)=37.1, p=0.33] and to the Ncomp and left visual field data [χ2(35)=33.8, p=0.53]. However, no significant interaction effect was observed, meaning that there was no increased negative association between RT-threat and neuroticism as a function of Ncomp level in either visual field. The same results were observed for attention bias as defined by bias scores.
Genetic analysis
RT measures in the right visual field showed significant shared-environmental influences: 43% for the neutral and 41% for the threat condition (Table 1, lower panel). In contrast, there were significant genetic influences on the RT measures in the left visual field: 49% for the neutral and 42% for the threat condition. The variance of the attention bias scores was totally explained by unique environment (including measurement error).
Discussion
As a potential cognitive mechanism of neuroticism, the present study investigates the relationship between an Ncomp and the proportion of recalled pleasant and unpleasant words and the RT on target stimuli primed with or without negative emotional cues. These relationships were also estimated as a function of the neuroticism score level, in the sense that the correlation between neuroticism and cognitive measures might only be detectable at the higher end of the neuroticism distribution (moderator effects). We found that the (expected) positive correlation between neuroticism and the proportion of recalled unpleasant words was only detectable at the higher end of the neuroticism distribution and that this effect seems to be due to shared environmental rather than genetic effects. As expected, these effects were not observed for the proportion of recalled pleasant words. No significant effects were found for the relationship between neuroticism and the RTs in the threat and neutral condition of the dot-probe task. In addition, this is, to the best of our knowledge, the first study to examine the heritabilities of these cognitive tasks.
Both our positive and negative results are in accordance with previous findings. Attention and memory bias (in the context of facial expression recognition tasks, emotional categorization, word recall, and memory) is commonly reported in depressed patients (Bradley & Mogg, Reference Bradley and Mogg1994; Bouhuys et al. Reference Bouhuys, Geerts and Gordijn1999; Mogg et al. Reference Mogg, Bradbury and Bradley2006), in healthy subjects following negative mood induction (Bouhuys et al. Reference Bouhuys, Bloem and Groothuis1995), in ‘elevated risk’ daughters of depressed mothers following negative mood induction (Joormann et al. Reference Joormann, Talbot and Gotlib2007) and in healthy subjects selected on high versus low scores on a neuroticism scale (Bradley & Mogg, Reference Bradley and Mogg1994; Chan et al. Reference Chan, Goodwin and Harmer2007). Less consistently found in depressed patients as well as in healthy volunteers is the effect of attention bias as measured in the attention probe paradigm (Hill & Dutton, Reference Hill and Dutton1989; Chan et al. Reference Chan, Goodwin and Harmer2007).
Using a twin design, the additional value of our study was to unravel potential correlations between neuroticism and cognitive mechanisms into genetic and environmental components. A genetic relationship could indicate that the liability to, for example, depression and anxiety disorders is mediated by shared genetic influences that predispose individuals to experience negative, distressing emotions and the tendency to focus on negative (social) stimuli. We found a weak indication that the link between neuroticism and recall bias for negative words is driven by familial factors that are environmental in nature (i.e. shared or common environment). Shared environmental effects make individuals in the same family more similar, and may persist even if family members are separated later in life. It is difficult to speculate what these shared environmental factors could be, but parenting style is a potential candidate. In an earlier study (Lau et al. Reference Lau, Rijsdijk and Eley2006) it was found that the association between parental use of negative sanctions and the tendency to attribute negative events to self (a vulnerability marker for depression) was predominantly determined by environmental factors (19% by shared and 55% by non-shared environment). It is important to keep in mind, though, that ‘environmental’ variables like parental style and life events themselves are influenced by genetic factors, a first indication of more complex processes like gene–environment correlations which are beyond the scope of these analyses (Rijsdijk & Sham, Reference Rijsdijk and Sham2002).
The twin design enabled estimation of the extent to which individual differences in these cognitive tasks are due to latent genetic and environmental influences. The most intriguing results were for the dot-probe task. In accordance with the study of Mogg & Bradley (Reference Mogg and Bradley1999) our data shows that individuals preferentially allocate attention to the spatial location of threat faces presented outside awareness. We did not find a stronger effect for the left visual field as reported by the authors. One explanation could be their recruitment procedure favouring high and low scorers on screening measures of anxiety and depression.
On average, RTs were faster on all dot-probes (regardless of emotional valence) presented in the left visual field. In addition, individual differences in these RTs were substantially determined by genetic effects, whereas those in the right visual field were not. Our results, thus, suggest that non-conscious processing of faces, and consequent attentional orientation towards those stimuli, might be primarily mediated by the right hemisphere, and that this characteristic might be under genetic control. We did not find any evidence, however, that this could be a potential behavioural mechanism of neuroticism. Another interesting finding is that within-subject bias scores, that is, the difference in mean RT between congruent and incongruent trials (often used as attention bias index in the dot-probe task), are totally due to unique environment (including measurement error). The MZ twin correlations (a proxy for test–retest reliability) of around zero confirm that these attention bias indices might not be reliable measures (Schmukle, Reference Schmukle2005). Although difference scores are not necessarily unreliable measures (Rogosa & Willett, Reference Rogosa and Willett1983), in this particular task it might be better to use the raw RTs as bias indices (at least in non-clinical samples).
Limitations
The results of these analyses should be interpreted in the context of several potential limitations. First, there are limitations inherent in the twin design and the genetic models. These include chorionicity, atypical gestation of monozygotic twins, and increased similarity of environment for MZ twins as compared with DZ twins (Martin et al. Reference Martin, Boomsma and Machin1997), as well as the inclusion of gene–environment correlations and interactions in the genetic or environmental parameters. Effects of these limitations are likely to be small and variable in their direction, some resulting in conservative, others in inflated heritability estimates (Rijsdijk & Sham, Reference Rijsdijk and Sham2002). Second, the sample size was too small to detect genetic, shared and non-shared environmental interaction effects on the correlation between Ncomp and proportion of recalled unpleasant words. Bigger samples are needed to replicate these findings. As the sample comprised female twins only, results are not generalizable to the whole population.
Third, we were only able to model linear interaction effects. Although raw-data plots of the correlation between neuroticism and the proportion of recalled unpleasant words showed nonlinear trends at the lower levels of neuroticism, at the higher levels, the effects were mainly linear. Finally, another limitation that might account for the negative findings could be that the neuroticism construct is too broad and heterogeneous. We cannot exclude that relationships exist at more specific lower-order narrow facets (e.g. anxiety). It is possible that lower-order facets of neuroticism have counteracting effects with RTs in the threat and neutral condition of the dot-probe task and that combining such facets into a higher-order neuroticism construct obscures such relationships.
Conclusions
Neuroticism correlates with a higher proportion of recalled unpleasant words but not between neuroticism and RTs in the threat and neutral condition of the dot-probe task. Neither of these relationships is genetic in nature, as hypothesized. The results, therefore, do not suggest that a possible underlying genetic mechanism of neuroticism is the predisposition of individuals to focus on negative (emotional) stimuli. As such, these measures would not make good candidates as endophenotypes for molecular genetic studies of neuroticism.
Acknowledgements
This research is part of the Twin Interdisciplinary Neuroticism Study (TWINS) supported by the Netherlands Organization for Health Research and Development (ZonMw 904-57-130), and the UK–Netherlands Partnership Program in Science (BR 56-481 and BR 96-229) which is jointly run and financed by the British Council and the Netherlands Organization for Scientific Research (NWO).
Declaration of Interest
None.