

INTRODUCTION
Glial cells are involved in dynamic interactions with neurons in both the developing and the adult nervous system. In both vertebrates and invertebrates, they affect numerous processes, including neurogenesis, synaptogenesis, axon growth, fasciculation, targeting, synapse maintenance and removal, synaptic function and dendritic pruning.
Our particular focus is on developmental roles for glial cells in the olfactory system. Olfactory systems in multiple species have several populations of glial cells, each with specific functions that are required for normal development. For example, in the developing olfactory pathway of the large hawkmoth Manduca sexta, centrally derived glial cells are triggered to proliferate by ingrowing olfactory receptor axons and then in turn are key players in the navigation of later-growing axons to their targets in the developing brain (Rössler et al., Reference Rössler, Oland, Higgins, Hildebrand and Tolbert1999; Oland and Tolbert, Reference Oland and Tolbert2011). Glial cells are important in the construction of glomerular compartments after they arrive in the olfactory lobe (Oland et al., Reference Oland, Orr and Tolbert1990), as they are in the rodent olfactory bulb (Bailey et al., Reference Bailey, Puche and Shipley1999; Treloar et al., Reference Treloar, Purcell and Greer1999; Au et al., Reference Au, Treloar and Greer2002). Also, development of the normal adult repertoire of ion channels in neuropil glial cells of the moth olfactory lobe requires the presence of olfactory receptor neurons (Lohr et al., Reference Lohr, Oland and Tolbert2001, Reference Lohr, Tucker, Oland and Tolbert2002). Thus, many developmental processes depend on reciprocal signaling between the two cellular classes.
Here we turn to an examination of peripheral glial cells that arise in the olfactory sensory epithelium of M. sexta, with the goal of understanding developmental interactions between ingrowing receptor axons and the glial cells that eventually form a complex three-dimensional network that ensheathes bundles of axons. The final spatial distribution of the peripherally derived glial cells in the M. sexta olfactory pathway is well understood (Sanes and Hildebrand, Reference Sanes and Hildebrand1976), and the general morphological organization of the nerve with bundles of thin axons, each bundle separated by glial processes, closely resembles that of the vertebrate olfactory nerve (Kreutzberg and Gross, Reference Kreutzberg and Gross1977; Barber and Lindsay, Reference Barber and Lindsay1982; Doucette, Reference Doucette1984). In the present study, we used anatomical and electrophysiological methods to examine glial development in the three-dimensional context of the normal nerve. The olfactory (antennal) nerve of the moth is ideal for this study in that it is a large, easily accessible structure in which the centrally and peripherally derived glial populations can be distinguished easily by position in the nerve, and in which migration and division can be examined readily throughout development. The glial cells populating the antennal nerve (AN), the AN glia, derived from the olfactory epithelium, in this case located in antennae, and are similar in many respects to the olfactory ensheathing cells (OECs) in the olfactory nerves of mammals (Su and He, Reference Su and He2010).
A key question is whether formation of the glial network in the moth nerve depends on the presence or activity of olfactory receptor neurons. We have shown previously that when AN glial cells are grown in the presence of olfactory receptor neurons (ORNs), they form multi-cellular arrays that are reminiscent of the ensheathing glial networks in the intact nerve (Tucker and Tolbert, Reference Tucker and Tolbert2003). This tendency of glial cells to form networks falls off with distance from explants of ORNs and is not contact-dependent, suggesting that a diffusible signal acts at short range between the glial cells and the ORNs. Although the signal is not known in moth, signaling between axons and glial cells is known from other systems to include transmitters such as glutamate and ATP released from mouse axons and eliciting an increase in cytosolic calcium in OECs (Thyssen et al., Reference Thyssen, Hrinet, Wolburg, Schmalzing, Deitmer and Lohr2010), in mouse suprachiasmatic nucleus glial cells (van den Pol et al., Reference van den Pol, Finkbeiner and Cornell-Bell1992) and in Schwann cells in frog optic nerve (Chiu and Kriegler, Reference Chiu and Kriegler1994). Electrical stimulation of the olfactory nerve in mouse also induces an increase in intracellular calcium in astrocytes in the olfactory bulb (Doengi et al., Reference Doengi, Deitmer and Lohr2008); blocking this increase in vivo reduces the migration of these glial cells, raising the possibility that stimulation-induced increase in calcium mediates migration of AN glial cells.
Objectives
In this study, we used confocal and electron microscopy, immunocytochemistry, cell culture methods and whole-cell and perforated-patch recording techniques to describe the involvement of glial migration, process extension and proliferation in development of the AN glial network; to determine the repertoire of currents in glial cells; to determine the effect of blocking the glial R-like calcium current on development of the glial network; and to ask whether normal development of the calcium current depends on neuronal activity.
METHODS
Animals and preparation
M. sexta (Lepidoptera: Sphingidae) were reared in the departmental insect-rearing facility under a long-day photoperiod as described previously (Oland and Tolbert, Reference Oland and Tolbert1987). Metamorphic development starts with pupation and ends with the emergence of the moth after passing through 18 stages, each lasting about a day. The precise stage of development was determined by following changes in structures that are visible under the pupal cuticle (Oland and Tolbert, Reference Oland and Tolbert1987). Before dissection of the brain, staged pupae were anesthetized by cooling on ice or by exposure to CO2 for at least 30 min. The brains then were dissected quickly from the head and placed in cold dissecting solution (see Solutions below). The entire intracranial portion of the AN (~2 mm) and the antennal lobe to which it projects were isolated from the remainder of the brain and the perineural sheath was removed. After isolation and removal of the perineurial sheath, a drop of dissecting solution carrying an antennal lobe and attached nerve was transferred onto a glass cover slip into a dish containing recording saline (see Solutions below).
Solutions
The following solutions were adjusted to pH 7.0 and an osmolarity of 370–375 mOsm unless otherwise noted.
PHYSIOLOGY SOLUTIONS
AIS (An insect saline): 150 mM NaCl, 4 mM KCl, 6 mM CaCl2, 10 mM HEPES buffer, 5 mM glucose and 360 mOsm. Dissecting solution: 27% L-15, 53% AIS, 20% culture chow and 1.7 g/l glucose. Recording saline: 150 mM NaCl, 4 mM KCl, 6 mM CaCl2, 10 mM HEPES buffer, 5 mM glucose and pH 6.8. BaCl 2 recording saline: Standard recording saline with 2 mM BaCl2 and 4 mM MgCl2 substituting for 6 mM CaCl2. 4-AP(4-amino pyridine) recording saline: 140 mM NaCl, 4 mM KCl, 6 mM CaCl2, 10 mM HEPES buffer, 10 mM 4-AP, 5 mM glucose and pH 6.8. K +-free, 4-AP containing BaCl 2 recording saline: 144 mM NaCl, 6 mM BaCl2, 10 mM HEPES buffer, 10 mM 4-AP, 5 mM glucose and pH 6.8. Low Ca 2+, 4-AP recording saline: Standard recording saline with 0.6 mM CaCl2, 5.4 mM MgCl2 substituting for 6 mM CaCl2 and pH 6.8. Low Ba 2+, Ba 2+ substituted for Ca 2+, 4-AP recording saline: 140 mM NaCl, 4 mM KCl, 0.6 mM BaCl2, 10 mM HEPES buffer, 10 mM 4-AP, 5 mM glucose and pH 6.8. Pipette solution: 150 mM K aspartate, 8 mM NaCl, 2 mM MgCl2, 1 mM CaCl2, 11 mM EGTA, 2 mM ATP and 0.01 mg/ml Lucifer Yellow lithium salt. TEA (tetraethyl-ammonium) Pipette solution: 120 mM K aspartate, 8 mM NaCl, 2 mM MgCl2, 1 mM CaCl2, 11 mM EGTA, 2 mM ATP, 30 mM TEA and 0.01 mg/ml Lucifer Yellow lithium salt. Cs + Pipette solution: Standard pipette solution with 150 mM Cs+ aspartate substituted for K+ aspartate.
CULTURE SOLUTIONS
Culture medium (supplemented Leibovitz's L-15 culture medium; Lohr et al., Reference Lohr, Tucker, Oland and Tolbert2002): The following ingredients were added to 492 ml of L-15: 25 ml fetal bovine serum (FBS), 185 mg α-ketoglutaric acid, 200 mg d-(-)-fructose, 350 mg d-glucose, 335 mg dl-malic acid, 30 mg succinic acid, 1.4 g lactalbumin hydrolysate, 1.4 g TC yeastolate, 0.1 mg niacin, 30 mg imidazole, 500 µg 20-hydroxyecdysone (H5142; Sigma), 100 U/ml penicillin, 100 µg/ml streptomycin, 5 µg/ml insulin, 290 µg/ml glutamine, 200 µg/ml cysteine, 110 µg/ml pyruvate and 2.5 ml stable vitamin mix (SVM). A 5 ml stock solution of SVM consisted of 15 mg aspartic acid, 15 mg cystine, 5 mg β-alanine, 0.02 mg biotin, 2 mg vitamin B12, 10 mg inositol, 10 mg choline chloride, 0.5 mg lipoic acid, 5 mg p-aminobenzoic acid, 25 mg fumaric acid, 0.4 mg coenzyme A, 15 mg glutamic acid and 100 ml of the supplemented L-15 before the FBS, SVM, 20-HE and penicillin/streptomycin are added. The osmolarity was raised to 375 mOsm with d-glucose prior to sterile filtration. Simple salt solution: 160 mM NaCl, 6 mM KCl, 78.8 mM d-glucose, 10 mM HEPES, 100 U/ml penicillin and 100 µg/ml streptomycin. Recovery solution: A total of 50% (v/v) culture saline and 50% (v/v) simple salt solution, 390 mOsm. Dissecting medium: The following ingredients were used: 50% Leibovitz's L-15 (41300-039; Gibco), 25% (v/v) culture saline, 25% simple salt solution with 5 mM EDTA and 18 mM d-glucose.
Whole-cell and perforated-patch-clamp recording
Preparations were transferred into a recording chamber (volume approximately 1 ml) and fixed in place using a U-shaped stainless steel frame laced with nylon strings. The recording chamber was mounted on the fixed stage of an upright microscope (Axioskop FS; Zeiss, Oberkochen, Germany). A motorized three-axis micromanipulator (model 460A; Newport Corporation, Irvine, CA) was mounted beside the microscope. The microscope was equipped with infrared (infrared condenser filter RG715; A.G. Heinz) and fluorescence optics, a CCD video camera (C2400; Hamamatsu, infrared filter removed), and a water-immersion objective lens (Zeiss Achroplan 403, NA 0.75, working distance 2 mm). Recording pipettes were pulled from thin-walled borosilicate glass capillary tubes (TW150-3; World Precision Instruments, Sarasota, FL) with a vertical puller (Type PP-83; Narishige, Japan). The whole-cell pipettes were filled with the pipette solution directly before an experiment and had resistances of 8–10 MΩ. Perforated-patch pipettes were loaded with pipette solution that also contained 198.5 U/μl Nystatin (Sigma N-4014 Lot# 114K8315 or MP Biomedicals 194534 Lot# 3029KA) and had resistances of 6–8 MΩ. Whole-cell and perforated-patch currents were recorded with an Axopatch 200B amplifier (Axon Instruments) and digitized using a Digidata 1440A (Axon Instruments). Current signals were filtered with a lowpass Bessel filter at 1 kHz. Data acquisition and analysis were done using pClamp 10 software (Axon Instruments). Leak currents were subtracted online using a p/4 protocol. Two runs per trial were averaged, and only the averaged traces were stored and analyzed. Whole-cell pipettes were filled with Lucifer Yellow as described previously (Oland et al., Reference Oland, Marrero and Burger1999), allowing the dye to diffuse throughout the cell during recording for a total of 15 min before removal of the pipette to ensure consistency of time for dye spread from the recorded cell. Preparations were imaged with a Zeiss 510 Meta laser scanning confocal microscope.
Data analysis
Current amplitudes were measured at the end of either 100-ms or 1000-ms voltage steps. I–V plots were made at the maximal amplitude and the minimum amplitude after inactivation, if applicable. Current traces from pharmacologically treated cells were subtracted from the recordings taken before the application of the pharmacological agent to reveal the current sensitive to the agent.
Immunocytochemistry
PHOSPHO-HISTONE H3
Glial-cell proliferation was assessed by monitoring DNA synthesis by labeling exposed phospho-histone H3 molecules using an antibody generated against histone H3 phosphorylated at serine 10 (Sigma H0412-200UL Lot# 092K4804). Brains were dissected at the stage of interest and immediately placed in a 4% paraformaldehyde in 0.1 M PO4 buffer fixative solution for 48 h at 4°C on a shaker. After fixation brains were washed with phosphate-buffered saline (PBS) then rinsed 3 × 10 min, embedded in 7% low-melting-point agarose and serially sectioned in the frontal plane with a vibratome at 75-μm thickness. Sections subsequently were incubated in PBS with 40 U/ml DNase and 4 mM MgCl2 for an hour at 37°C followed by a 45-min permeabilization step in 2% normal goat serum (NGS) in PBS with 0.5% Triton X-100 (PBST). The sections were then incubated in anti-phospho-histone H3 at 1:300 in PBST with 2% NGS overnight (ON) on a shaker at room temperature. The sections then were washed 3 × 10 min in PBS with 0.1% Triton X-100 (0.1% PBST) before incubating for 4 h in goat anti-rabbit F(ab)2-Cy3 (Jackson ImmunoResearch Laboratories 111-166-047 Lot# 93574) at 1:200 in 0.1% PBST. After incubation in secondary antibody, the sections were washed 1 × 10 min in 0.1% PBST and 2 × 10 min in 10 mM Tris buffer (TB), before incubating for an hour in Syto-59 (Invitrogen S11341 Lot# 695905) at 1:10,000 in TB. After Syto-59 staining, sections were rinsed in TB for 10 min, washed for 15 min in 50:50 glycerol:water, washed for 15 min in 80:20 glycerol:water and finally mounted in 80:20 glycerol:water.
GLUTAMINE SYNTHETASE
Brains were fixed in a microwave oven (Pelco) under vacuum in 600 µl of fixative solution (1.34 mM sodium cacodylate, 0.53 mM sodium metabisulfate (SMB), 2.56% paraformaldehyde and 0.96% glutaraldehyde, pH adjusted to 7.2 with HCl) at Power 2 for the sequence: 2 min on, 2 min off, 2 min on, 2 min off and then placed in fresh fixative solution ON on a shaker at 4°C. Brains then were rinsed in 0.05 M Tris-HCl followed by 15 min in sodium borohydride (0.01 M NaBH4, 0.5 wt% SMB, in 0.05 M Tris-HCl, pH 7.5). After washing 3 × 10 min in PBS, they were embedded in 7% low-melting-point agarose and sectioned at 75-μm intervals using a Vibratome. Sections were washed 3 × 20 min in TBS, incubated 20 min in 2 N HCl in 0.1 M PO4, washed 3 × 10 min in TBS, blocked for 2 h in TBS with 5% IgG-free BSA and 0.3% Triton, and incubated ON at 4°C in TBS with 1:100 anti-glutamine synthetase (BD Transduction Laboratories 610518 Lot# 37506), 1% IgG-free BSA, and 0.1% Triton. Sections were washed in TBS with 0.3% Triton 4 × 30 min, then incubated in goat anti-mouse Fab'-Alexa 488 (Invitrogen A11017 Lot# 54254A) at 1:400 in TBS with 0.1% Triton for 2 h. Sections then were washed in TBS 2 × 10 min, then in 0.1 M TB 3 × 5 min followed by a 45-min incubation in 1:5000 Syto-59 (Invitrogen S11341 Lot# 695905) in 0.1 M TB, washed 2 × 5 min in 0.1 M TB and cleared in 50:50 glycerol:water for 15 min, then mounted in 80:20 glycerol:water.
SYTO STAINING
To reveal the position of glial cells in preparations otherwise unlabeled, tissue was stained with the nucleic acid stain Syto 13 (Invitrogen S7575 Lot# 24508W) or Syto 59 (Invitrogen S11341 Lot# 695905). The tissue was placed in fixative solution ON, then was washed with 0.1 M TB 2 × 5–10 min, incubated in Syto at 1:5000 in TB for 3 h, washed in TB 5 × 10 min, and then cleared and mounted in glycerol as above.
TETRODOTOXIN (TTX)
To measure the effects of TTX inhibition of neuronal activity on the development of calcium currents in AN glial cells, stage 6 male animals were injected with 20 µl of a stock 1 × 10⁻² M TTX solution (Calbiochem 554412 Lot# D0082298 and D0089323) and dissected at stage 9. Assuming an approximately 2-ml volume for the animal (Morton and Truman, Reference Morton and Truman1985), this would result in a 1 × 10⁻⁴ M final TTX concentration. At dissection, half of the brain was placed in 4% paraformaldehyde in 0.1 M PO4 at 4°C for subsequent Syto 13 labeling, as above; the other half was prepared for perforated-patch recording from the AN glial cells.
SNX-482
SNX-482 is a toxin isolated from the venom of the tarantula Hysterocrates gigas. Acute application of SNX-482 for electrophysiological recordings was performed as follows. The perfusion of saline was halted, leaving approximately 1 ml of saline in the recording chamber. Ten microliters of 10 µM SNX-482 in H2O were pipetted into the chamber resulting in a final SNX-482 concentration of 100 nM. The SNX-482-containing solution remained in place for 10 min before resuming perfusion with saline. In vivo exposure to SNX-482 consisted of injecting 10 µl of a 10 µM SNX-482 solution (to yield a final concentration of 100 nM) into the headspace beginning at early stage 5, and each day thereafter for 2–3 days. Animals were dissected 18–36 h after the final injection. In vitro exposure to SNX-482 consisted of the addition of 1 or 10 µl of a 10 µM SNX-482 solution to a total volume of 1 ml of culture medium (to yield a final concentration of 100 nM) 4 h after plating the glial cells, which had been plated 24 h after ORN explants (Tucker and Tolbert, Reference Tucker and Tolbert2003). Stock SNX-482 was made in distilled water. Controls for the in vivo and in vitro experiments consisted of injection or addition of an equal volume of vehicle.
Tissue culture
Co-cultures of AN glial cells and explants of the olfactory sensory epithelium from the antenna were made exactly as reported by Tucker and Tolbert (Reference Tucker and Tolbert2003). In brief, the sensory epithelial portions of antennae from stage 4 female animals were exposed to Liberase (22.5 µg/ml Liberase Blendzyme 1 (Roche, Indianapolis, IN) in Ca2+ and Mg2+-free Hank's balanced salt solution (21250–014; Gibco, Grand Island, NY)) at 37°C for 4 min, crudely dissociated by mechanical trituration to yield explants ~100 µm in diameter, spun sequentially through culture saline at 500 rpm, then culture medium and finally plated onto a concanavalin A/laminin-coated well in a standard 35-mm Petri dish. After 18–24 h, the AN of stage 6 female animals were dissected free in dissection medium, dissociated by exposure to Papain at 37°C for 4 min followed by gentle trituration and centrifugation first in recovery solution and then in culture medium both at 1800 rpm. In all, 50 µl of medium was removed from the explant cultures and replaced by 50 µl of medium containing glial cells. Cultures were flooded with 1 ml of culture medium after ~1 h and were allowed to grow for an additional 48 h. n = 3 experiments, each with two control and four treated dishes.
Electron microscopy
Stage 6 (n = 3), stage 12 (n = 3) and stage 18 (n = 2) animals were anesthetized, and their brains were quickly dissected free from the surrounding tissue. Brains were fixed ON in 0.5% paraformaldehyde, 2.5% glutaraldehyde, 0.002% CaCl2, 7.5 mg/ml sucrose in 0.1 M phosphate buffer and then rinsed 2 × 10 min in 0.1 M phosphate buffer. The brains then were incubated in 1% OsO4 in 0.1 M PO4 buffer for 3–4 h, then were rinsed in 0.1 M PO4 buffer 2 × 15 min, after which they were dehydrated through an ethanol series: 10 min each in 30, 50 and 70% EtOH. The brains then were transferred into 1% uranyl acetate in 70% EtOH for 1 h, then placed in 90 and 95% EtOH, followed by 3 × 15- min washes in 100% EtOH. The brains were washed in propylene oxide (PO) 2 × 15 min, then moved through 3:1 PO:Epon/Araldite for 2 h, 1:1 PO:Epon/Araldite ON on a rotator at room temperature, placed in 1:3 PO:Epon/Araldite for 2 h, in fresh 100% Epon/Araldite for 7 h, and finally embedded in fresh 100% Epon/Araldite. Silver-gold sections were cut on an RMC Products Power-Tome X, and imaged in a JEOL 1200 EX electron microscope. Corel Draw was used to assemble image montages and to mask the images with a transparent overlay to show the position of the glial cells and their processes. Glial processes were identified by their characteristic inclusion of ribosomes and glycogen in the cytoplasm and, if the nucleus was present, by its irregular shape and infolding of the nuclear membrane.
RESULTS
Two major classes of glial cells invest the olfactory (antennal) nerve (AN) in M. sexta. The region of the nerve proximal to the olfactory (antennal) lobe of the brain, the so-called axonal sorting zone, is populated by cells that derive from the antennal lobe, so are central in origin (Oland et al., Reference Oland, Pott, Higgins and Tolbert1998). The distal part of the nerve, extending in from the antenna, is populated by glial cells that arise in the olfactory sensory epithelium in the antenna and subsequently migrate along the axons. The entire AN is ensheathed by perineurial cells and a sub-perineurial glial layer (Oland et al., Reference Oland, Pott, Higgins and Tolbert1998).
In the present study, we characterized in detail at the cellular level the development of the glial network. ORN axons grow in from the antenna along a slender pupal nerve. The first ORN axons reach the antennal lobe by late stage 3/stage 4, and others continue to grow into the lobe through stage 9 (Oland and Tolbert, Reference Oland and Tolbert1987). Initially the AN has no glial cells along its length, but soon glial cells migrate in from the antenna and populate the nerve, the leading glial cells reaching the outer border of the sorting zone during stage 7 (Rössler et al., Reference Rössler, Oland, Higgins, Hildebrand and Tolbert1999). One experimentally useful consequence of the slightly delayed migration of AN glial cells into the very long AN is that, before stage 7, it is very easy to distinguish sorting zone and AN glial cells by position, both in fixed preparations prepared for immunocytochemistry and in in situ preparations used for electrophysiology. The border between the two regions remains visually obvious under the dissecting microscope nearly to the end of the period of axon ingrowth (stage 9).
Development of the glial network in the AN
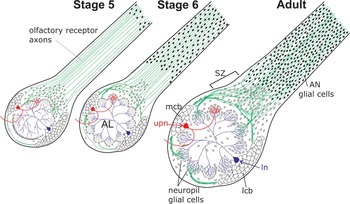
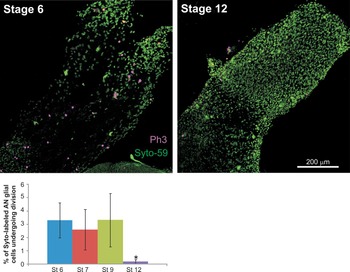
Figure 1 shows schematically the change in distribution of AN glial cells during development. The number of glial cells in the AN increases greatly during the period of migration, which begins during stage 3 when glial cells can be seen dividing in the AN branches in the antenna (Rössler et al., Reference Rössler, Oland, Higgins, Hildebrand and Tolbert1999). The leading front of glial cells has reached the intracranial portion of the nerve by stage 5, and the first AN glial cells have reached the distal border of the sorting zone region of the nerve by stage 7. Phospho-histone H3 labeling of the intracranial portion of the nerve (Fig. 2) reveals an essentially constant level of division within the peripheral nerve glial population during the period of migration (n = 12 preparations). The percent of cells dividing was 3.3% at stage 6, 2.6% at stage 7 and 3.3% at stage 9, decreasing significantly to 0.18% by stage 12, a profile of division that closely matches the rising and then falling titer of the steroid hormone 20-hydroxyecdysone (Kirschenbaum et al., Reference Kirschenbaum, Higgins, Tveten and Tolbert1995). With our methods, it was not possible to determine whether the cells that were dividing were actively migrating, had paused to divide, or had completed their migration.
Schematic diagrams of the moth olfactory pathway showing the position of the migrating peripheral (antennal nerve, AN) glial cells (black) at stages 5 and 6 and in the adult. AN glial cells migrate from the sensory epithelium in the antenna to the antennal lobe. Centrally derived sorting zone and neuropil glial cells, open ovals; olfactory receptor axons, green; AL, antennal lobe; lcb, lateral neuronal cell body cluster; ln, local interneuron; mcb, medial neuronal cell body cluster; SZ, sorting zone; upn, uni-glomerular projection neuron.

Phospho-histone H3 labeling (magenta) shows that a small number of AN glial cells (green) are dividing in the AN during the period of glial migration, which overlaps and extends slightly beyond the period of receptor axon ingrowth. The image of a stage 6 nerve shows the nerve from near the antennal lobe (bottom left) to the base of the antenna (top right) where it divides into two antennal nerve branches. By stage 12, dividing glial cells were rarely detected in the AN. Error bars in graph indicate 95% confidence intervals (*represents a significant difference at the 95% confidence level).

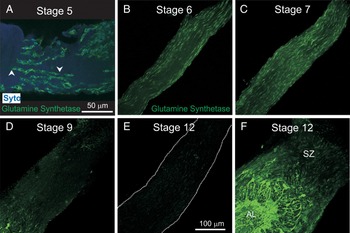
An antibody to glutamine synthetase labels AN glial cells during their period of migration. The labeled glial cells often appear in chains, as has been seen in other systems (Sepp et al., Reference Sepp, Schulte and Auld2000; Gilmour et al., Reference Gilmour, Maischen and Nüsslein-Volhard2002; Silies et al., Reference Silies, Edenfeld, Engelen, Stork and Klämbt2007; Aigouy et al., Reference Aigouy, Lepelletier and Giangrande2008; von Hilchen et al., Reference von Hilchen, Beckervordersandforth, Rickert, Technau and Altenhein2008) (Fig. 3A). Antibody labeling of AN glia disappears by the end of the migratory period (~stage 12), but by stage 12 central glia are labeled strongly (Fig. 3B–F).
Developmental changes in glutamine synthetase expression and distribution of migrating glial cells. (A) Migrating glial cells often form chains of cells (e.g. between arrowheads). Glutamine synthetase labeling is present in AN glial cells early in their migration toward the antennal lobe (B), but gradually decreases in intensity until labeling is nearly absent by stage 12 (C–E). Dotted lines in E indicate edges of the nerve. (F) Labeling in the central glial cells does not diminish. Scale bar in A applies only to A; in E applies to B–F.

AN glial cells also are highly dye-coupled during the early stages of migration. During whole-cell recording from these glial cells at different developmental stages, Lucifer Yellow was included in the recording electrode. Figure 4 shows that the dye spread to many tens of cells across long distances at stage 6, but coupling was dramatically reduced by stage 7. From stage 7 onward, dye in a single recorded glial cell never spread to more than 5 other glial cells, indicating that coupling is developmentally regulated. We found no evidence of dye coupling between glial cells and ORN axons at any stage of development.
Dye coupling in AN glial cells. (A) Infra-red, water-immersion optics allows easy visualization of glial-cell bodies (arrows) interspersed among the receptor axons. (B) During stage 6, Lucifer Yellow diffuses from the single patched cell to most, if not all, other glial cells across a wide portion of the nerve. (C) From stage 7, only small numbers (3–5) of glial cells are dye-coupled. Red, Syto 59 labels nuclei of all glial cells in the nerve.

The result of the migration, proliferation and process extension by glial cells is the formation of a network of glial processes in the AN. Figure 5A–C shows cross-sections through the intracranial portion of the nerve at stages 6, 7 and 9. Glial processes in the sections were labeled with the lectin lycopersicon, which recognizes N-linked glycoproteins and in this system specifically labels all glial cells (Gibson et al., Reference Gibson, Hildebrand and Tolbert2004). The sequence shows a gradual increase in glial process extension into the nerve. During stages 6 and 7, AN glial cells have rather short processes and most glial-cell nuclei are found near the perineurial sheath around the nerve. In subsequent stages, the glial presence in the nerve develops further as the glial cells migrate both along and into the body of the nerve and as the glial cells extend processes that branch and begin to roughly segregate groups of axons, seen as encircled regions of the nerve (arrows). The glial processes become more extensive, finer in caliber and often vellate. In the electron microscope, comparison of cross-sections of stage 12 (axon ingrowth complete) and stage 18 (just before emergence of the adult moth) nerves shows glial processes defining smaller and smaller subsets of axons (Fig. 5D,E). As is the case for their vertebrate counterparts (Kreutzberg and Gross, Reference Kreutzberg and Gross1977; Barber and Lindsay, Reference Barber and Lindsay1982; Doucette, Reference Doucette1984), olfactory receptor axons in the moth are small-diameter (0.1–0.4 µm) unmyelinated axons (Sanes and Hildebrand, Reference Sanes and Hildebrand1976). In the mature moth nerve, these glial processes typically envelope groups of 50–80 axons. The axons in these bundles are not yet sorted by odor-receptor subtype, but are merely traveling with axons whose origin is nearby in the sensory epithelium (Rössler et al., Reference Rössler, Oland, Higgins, Hildebrand and Tolbert1999).
Pattern of glial process extension in the development of the glial network in the antennal nerve. (A–C) Glial processes, which begin as fairly thick processes, gradually become thinner and somewhat flattened, and branch to surround increasingly smaller, roughly circular regions (arrows). (D,E) At the electron microscopic level, comparison of cross-sections of stage 12 (D) and stage 18 (E) nerves reveals the processes to segregate smaller and smaller bundles of axons. Glial processes highlighted by a transparent green overlay. t, tracheole. (F) Gap junctions between glial processes (arrowheads) are often found early in development, when dye-coupling between glial cells can be demonstrated easily. Two circular profiles in bottom left corner (arrows) are receptor axons. Inset, higher magnification view of a gap junction between glial cells, stage 6. Scale bar in A applies to A,C; in D applies to D,E.

In higher magnification electron micrographs of cross-sections of the intracranial portion of the nerve at stage 7, extensive gap junctions were readily found between glial-cell processes (Fig. 5F), consistent with the finding that dye-coupling was seen at this stage. Gap junctions were difficult to locate in micrographs of cross-sections of the nerve at stage 18. We found no evidence of gap junctions between glia and axons at the EM level at any stage, consistent with findings in the vertebrate olfactory nerve (Blinder et al., Reference Blinder, Pumplin, Paul and Keller2003).
Glial-cell electrophysiology during the period of axon ingrowth
Whole-cell voltage-clamp recordings were taken at stages 6, 7 and 9 of metamorphic development. Recordings resulting from 100-ms or 1-s voltage steps made in 10-mV increments from a holding potential of −70 mV showed outward currents that activated at −40 mV (Fig. 6A,B). Some current profiles showed a peak and plateau configuration; both profiles were found at all stages examined in approximately equal numbers. A plateau with an amplitude of about 500 pA was reached by 150 ms in the 1-s voltage step. Current–voltage plots were constructed by measurement of the current amplitude at 75 ms for the short (100-ms) voltage steps and at 750 ms for the long (1-s) voltage steps (Fig. 6C,D). They show the similarities of the whole-cell family of currents throughout development and show no statistically significant difference in current amplitude among stages. Differences in current profiles could reflect migratory or cell-cycle status, or could reflect the presence of electrophysiologically distinct subsets of glial cells.
Whole-cell currents in AN glial cells in situ at different stages of development in response to a family of 10 mV voltage steps from a holding potential of −70 mV. (A) Short pulse = 100 ms. (B) Long pulse = 1 s. The different shapes of the current profiles depicted in this figure were seen at all stages. (C,D) Corresponding I/V curves. Threshold of activation at ~−50 mV is constant across stages. Error bars show 95% confidence intervals and indicate no significant differences in amplitude across stages.

CURRENT DISSECTION
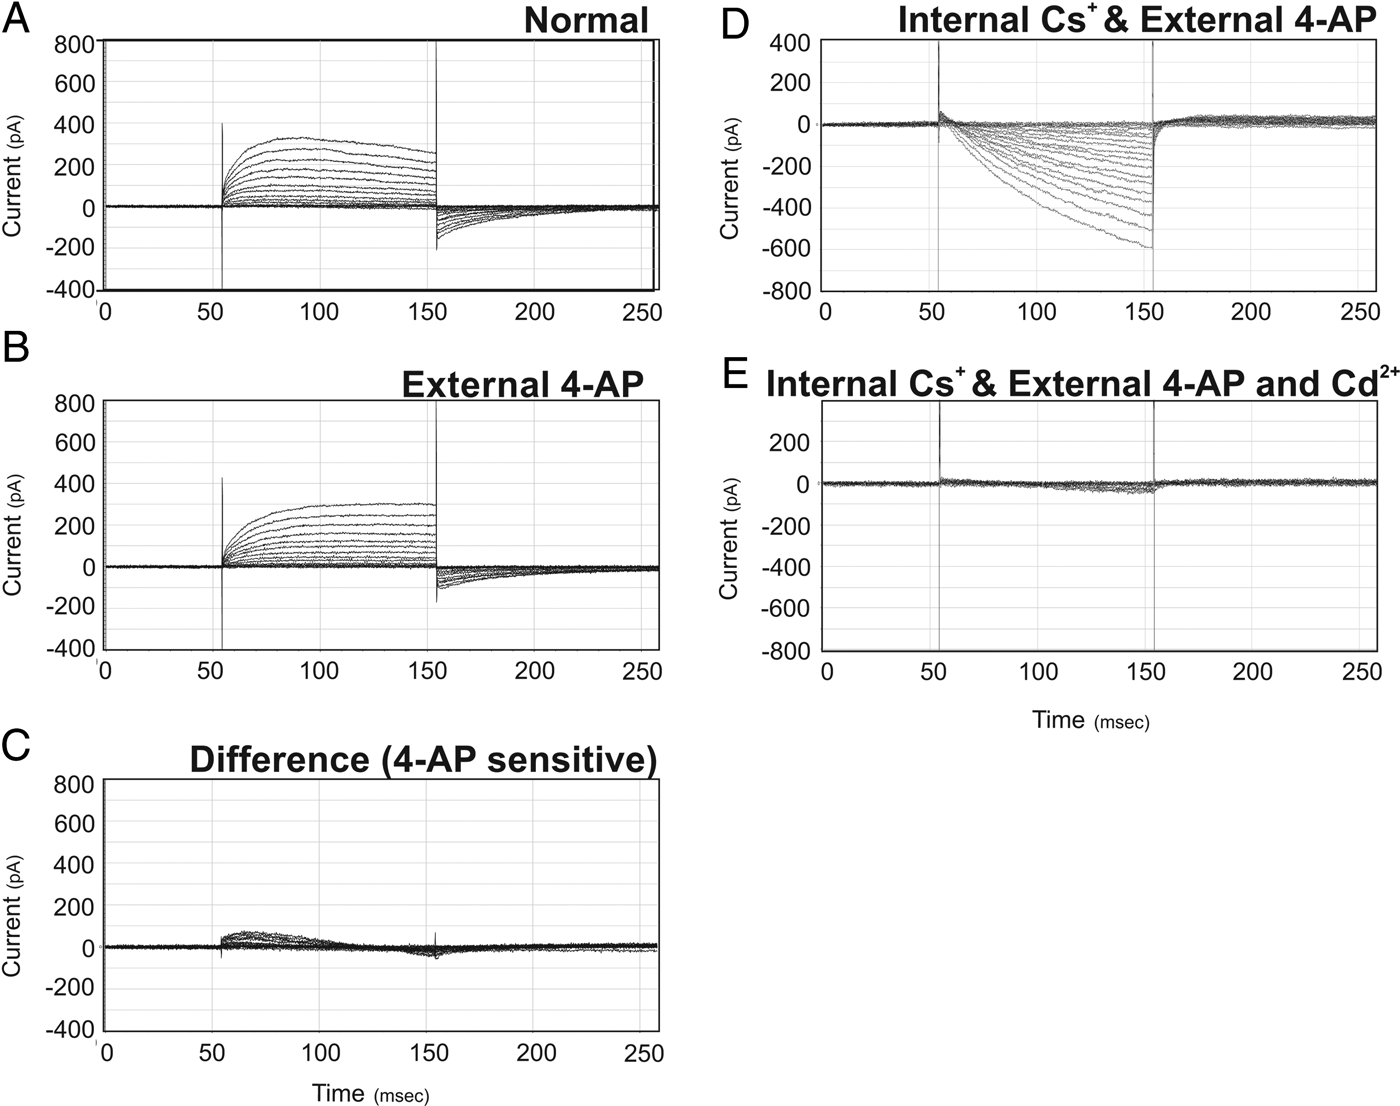
When the recording solution was replaced with 4-AP-containing recording solution, a reduction in the outward current was observed (Fig. 7A,B). The difference current displays inactivation, with a peak amplitude of 100 pA occurring at 15 ms (Fig. 7C); the remaining current had the appearance of a delayed-rectifier potassium current and was abolished in the presence of internal Cs+ and an external 4-AP-containing solution. Abolishing the outward current revealed an inward current of roughly 400–600 pA (Fig. 7D) that activated at about −50 mV and could be abolished by application of Cd2+ or Mg2+ (Fig. 7E). Under standard whole-cell recording configuration, the inward current rapidly decreased in amplitude over a period of 10 min and was completely lost within 30 min. Thus we used Nystatin to achieve perforated-patch recordings (Fig. 8). Because all currents could be abolished with internal Cs+, external 4-AP and Cd2+ or Mg2+, we conclude that these glial cells exhibit only potassium and calcium currents.
AN glial cells in situ possess at least two types of outward potassium currents and an inward calcium current. All recorded at stage 7. (A) Whole-cell current present in normal saline. (B) External 4-AP blocks an A-like current (C) that peaks at ~100 pA and completely inactivates within 100 ms. (D) Internal replacement of potassium with Cs+ in the presence of external 4-AP completely abolishes the outward current and unmasks an inward-going current that can be blocked with the addition of Cd2+ (E).

The R-type channel blocker SNX-482 reversibly blocks the Ca2+ current recorded in AN glial cells in situ using perforated-patch technique. (A) At stage 7, a slow-rising inward current is recorded in the presence of internal Cs+ and external 4-AP. (B) External application of the R-type channel blocker SNX-482 abolishes most of the inward current within 10 min, leaving only a small (<50 pA) early inward current and a small (~75 pA) slow outward current. (C) The current is recovered with a 10-min perfusion of saline with 4-AP.

The L-type calcium-channel blocker, Verapamil, had been shown at high concentrations (5 mM) to inhibit the migration of neuropil glial cells in M. sexta (Lohr et al., Reference Lohr, Heil and Deitmer2005). Five millimolar Verapamil was applied acutely and reduced the amplitude of the inward current by ~2/3, and washout reversed most of the reduction (not shown), but because Verapamil can be rather poorly selective, especially at this concentration (Diochot et al., Reference Diochot, Richard, Baldy-Mounlinier, Nargeot and Valmier1995), we sought more specific blockers. The slow kinetics of the current suggested the possibility that the channel might be an R-like channel (Naidoo et al., Reference Naidoo, Dai and Galligan2010). R-like channels have been seen in neurons of Periplaneta americana (Benquet et al., Reference Benquet, Pichon and Tiaho2004). The agatoxin SNX-482, a highly specific blocker of R-type channels (Naidoo et al., Reference Naidoo, Dai and Galligan2010), was pipetted into the recording chamber to yield a final concentration of 100 nM, and the response of the cell to a standard family of voltage steps was followed at 1-, 5- and 10-min intervals. The calcium current had already decreased at 1 min and was essentially abolished by 10 min, and it could be recovered with a 10-min wash in recording solution even after repeated applications of SNX-482 (Fig. 8), leading to the conclusion that the inward current is an R-like current.
Role of calcium currents and effect of blocking neuronal activity
Because glial migration is a necessary part of the process of network formation in the AN and because the migration of the central glial cells has been shown specifically in the moth olfactory pathway to be calcium-dependent (Lohr et al., Reference Lohr, Heil and Deitmer2005), we examined the effect of blocking the R-like current on glial network formation.
CALCIUM BLOCKERS IN VIVO
We injected pupae with SNX-482 at early stage 5, when the first AN glial cells migrating from the antennal sensory epithelium have reached the intracranial portion of the nerve, and repeated the injection daily to yield a total of three or four injections. Eighteen or 36 h after the last injection, the animals had reached late stage 6 to stage 7 of metamorphic development; the SNX-482-injected animals lagged behind the vehicle-injected control animals by less than one stage. The nerves were isolated and processed with Syto-13 to allow us to determine the extent of glial migration. The desheathed nerves of SNX-482-injected animals (n = 4 with three injections and n = 4 with four injections) were approximately the right diameter for the stages tested. Three were devoid of AN glial cells; in the other three, AN glial migration was greatly reduced. In the latter ANs, glial cells were arrayed in obvious chains that were located mainly in the outer portions of the nerve. Glial cells in the vehicle-injected control animals had reached the distal edge of the sorting zone region and were found across the full width of the nerve (n = 7) (Fig. 9A,B).
Effect of blocking the R-like Ca2+ current. (A,B) Chronic exposure to SNX-482 in vivo by injection for 3 days beginning at stage 5 of metamorphic development stops AN glial migration, has no obvious effect on the migration of the centrally derived SZ glial cells, and reduces migration of the centrally derived neuropil glial cells (arrows). Dotted line in B indicates edges of the AN. (C,D). In co-cultures of antennal explants, which contain olfactory receptor neurons, and AN glial cells, groups of glial cells near the explants form multi-cellular arrays. Yellow arrowheads indicate cell bodies of AN glial cells plated 18–24 h after the explants. Xs indicate explants here and in panel E. (E) Example of a tracing of glial-cell arrays in the vehicle-treated culture shown in D. Red arrows indicate glial-cell nuclei. (F) The percent of glial cells participating is unaffected by the presence of 100 nM SNX-482. Scale bar in B also applies to A.

Interestingly, in these SNX-482-injected animals, the centrally derived sorting zone glia that populate the sorting zone at the base of the AN had continued to migrate and the density of glial cells in the SZ appeared to be normal, but the centrally derived neuropil glial cells that form the glial envelopes around each glomerulus did not migrate as far into the neuropil as would be expected for late stage 6/stage 7 antennal lobes (Fig. 9A,B).
CALCIUM BLOCKERS IN VITRO
When AN glial cells are co-cultured with ORN explants, they form multi-cellular arrays over a period of 72 h (Tucker and Tolbert, Reference Tucker and Tolbert2003) (Fig. 9C). In these experiments, the AN glial cells are added to cultures 18–24 h after the antennal explants are plated. Over the course of the next 72 h, newly added glial cells that are located near explants form chains of a few to many cells, with the chains becoming increasingly interconnected with time (Fig. 9D), and eventually forming an array of glial cells that in two dimensions resembles the arrangement of glial processes seen in cross-sections of the AN (Fig. 5). In the current in vitro experiments, we did not expect linear chains of AN glial cells as seen in Fig. 3A because the glial cells are not migrating out from the explants along axons. This array formation was shown to be independent of physical contact between the axons and glial cells, but instead was the result of glial-cell proliferation and process extension.
In the current study, live-cell images were used to quantify chaining of AN glia in the vicinity of explants. The percentage of glial cells involved in chains within each field and the average and maximum number of glial cells comprising a chain were determined. Exposure to SNX-482 had no significant effect on any of these parameters (Fig. 9E,F).
EFFECT OF NEURONAL ACTIVITY ON GLIAL CALCIUM CURRENTS
In vivo, AN glial cells develop in the presence of ORN axons that display spontaneous neuronal activity that can be blocked by TTX, and from other studies, there is no evidence for calcium action potentials in ORN axons in the developing M. sexta AN (Zufall et al., Reference Zufall, Stengl, Franke, Hildebrand and Hatt1991). In cultured M. sexta neurons, TTX blockade of sodium currents is irreversible (Hayashi and Levine, Reference Hayashi and Levine1992), and previous in vivo experiments showed that a single injection of TTX into metamorphosing animals chronically blocks neuronal activity. When TTX was injected into pupae at stage 3/early 4, the gin-trap motor reflex was abolished within 2–6 h and still could not be elicited 9–12 stages later. Also, in intracellular recordings made in TTX-treated animals during stages 12–16, no spontaneous action potentials could be recorded nor could action potentials be evoked by electrical stimulation of the AN, although both could be detected in vehicle-treated animals (Oland et al., Reference Oland, Pott, Bukhman, Sun and Tolbert1996). Thus we were able to test whether the development of calcium currents in AN glial cells is dependent on neuronal activity by chronically blocking neuronal activity. We exposed animals to 1 µM TTX by injection at stage 6, just prior to the time when spontaneous activity first can be detected in ORN axons (Oland et al., Reference Oland, Pott, Bukhman, Sun and Tolbert1996).
When TTX was applied acutely during perforated-patch recordings, there was no effect on the AN glial calcium currents (Fig. 10A,B). Thus, the glial cells themselves were insensitive to TTX, as expected given the lack of evidence for TTX-sensitive Na+ currents in the glia. Nor was there an effect of acutely reducing neuronal activity on the glial-cell calcium current. We then recorded from AN glial cells in stage 9 TTX-treated or vehicle-treated control animals (Fig. 10C). The amplitude of the calcium current in the TTX-treated AN glial cells was consistently reduced to ~150 pA (n = 7 of 8); the amplitude of the current in the vehicle controls was ~450 pA (n = 4).
Chronic inhibition of neuronal activity with TTX reduces the amplitude of the AN glial-cell calcium current. Recordings from stage 9 AN glial cells in situ using perforated-patch technique in the presence of external Cs+ and internal 4-AP. (A,B) Neither chronic exposure to vehicle by injection into the animal at stage 5 nor acute exposure to TTX during recording had any effect on the calcium current. (C) After chronic exposure to 1 µM TTX by injection at stage 6, the Ca2+ current recorded in situ at stage 9 was severely reduced. (D,E) 2D reconstruction of optical sections, z-stack sizes are the same. There was no visibly obvious effect on AN glial migration after chronically blocking neuronal activity with TTX. AL, antennal lobe; SZ, sorting zone.

We also examined the extent of glial-cell migration in TTX-treated ANs (eight TTX-treated and ten control animals). Careful comparison of glial position and density at several positions across the nerves of the TTX- and vehicle-treated animals revealed no visually obvious changes in either parameter (Fig. 10D,E). Thus, neuronal activity does influence the development of calcium currents in AN glial cells, but does not appear to affect the ability of AN glial cells to migrate.
CONCLUSIONS
We used the experimentally accessible developing olfactory system of the moth M. sexta to study interactions between the olfactory receptor axons and the peripherally derived glial cells of the developing AN.
We found that:
• AN glial cells migrate along the nerve, proliferate, and extend processes to form a glial network that surrounds small bundles of ORN axons.
• During the period of migration, glial cells along the nerve initially are highly dye-coupled; by the end of the period of glial migration, only small groups of glia are dye-coupled.
• In the developing nerve, AN glial cells exhibit at least two potassium currents and an R-like calcium current, and the calcium current is reduced after neuronal activity in the nerve is blocked chronically by TTX.
• Acute exposure to SNX-482 abolishes the calcium current. Chronic exposure to SNX-482 in vivo greatly reduces, and in some cases blocks, migration of the AN glia, but chronic exposure of receptor neuron-AN glial cultures does not reduce the formation of multi-cellular glial arrays.
DISCUSSION
Our findings suggest that an interaction between AN glial cells and the ORN axons underlies development of the glial calcium current and that the calcium current in turn is required for development of the normal architecture of the nerve.
Network formation
At the cellular level, formation of the glial network in the moth's AN comprises several steps: gliogenesis, migration from the sensory epithelium (Rössler et al., Reference Rössler, Oland, Higgins, Hildebrand and Tolbert1999) and process extension to ensheathe axonal bundles. Glial proliferation begins in the sensory epithelium by stage 3 (Rössler et al., Reference Rössler, Oland, Higgins, Hildebrand and Tolbert1999), shortly after the birth of the olfactory receptor neurons (Sanes and Hildebrand, Reference Sanes and Hildebrand1976). In the moth, which has a substantial nerve comprising more than 300,000 axons (Sanes and Hildebrand, Reference Sanes and Hildebrand1975; Oland and Tolbert, Reference Oland and Tolbert1989), dividing glial cells also are found throughout the nerve as the population is migrating toward the brain. We do not know if glial cells are proliferating while migrating, as has been shown in NG2 glial cells of mice (Ge et al., Reference Ge, Zhou, Luo, Jan and Jan2009) and in the glial cells populating the enteric plexus in M. sexta embryos (Copenhaver, Reference Copenhaver2007), if glial cells have simply paused in their migration, or if the only proliferating glial cells are those that have reached their terminal position in the nerve. Nor do we know in M. sexta to what signals glial cells are responding that determine their terminal positions. Reduction in fibroblast growth factor receptor activation has been implicated, for example, in halting the migration of glial cells into the Drosophila eye imaginal disc (Murakami et al., Reference Murakami, Umetsu, Maeyama, Sato, Yoshida and Tabata2007; Silies et al., Reference Silies, Edenfeld, Engelen, Stork and Klämbt2007), but does not affect the migration of AN glial cells in M. sexta (Gibson, unpublished). Changes in the expression of various cell adhesion molecules also have been implicated in regulating migration (e.g. Copenhaver, Reference Copenhaver2007; Silies and Klambt, Reference Silies and Klämbt2010), and several, including GPI-linked and transmembrane Fasciclin II (an OCAM homolog) and Neuroglian (an L1 homolog) are expressed in the developing olfactory pathway in M. sexta (Higgins et al., Reference Higgins, Gibson, Eckholdt, Nighorn, Copenhaver and Nardi2002; Gibson and Tolbert, Reference Gibson and Tolbert2006). In general, however, this part of the process is poorly understood, even in systems where good progress has been made in identifying key signaling pathways that initiate and maintain glial migration (Klämbt, Reference Klämbt2009).
Collective or chain migration is a fundamental feature of migration in Drosophila wing and peripheral nerve (Giangrande, Reference Giangrande1994; Sepp et al., Reference Sepp, Schulte and Auld2000; Aigouy et al., Reference Aigouy, Van de Bor, Boeglin and Giangrande2004; von Hilchen et al., Reference von Hilchen, Beckervordersandforth, Rickert, Technau and Altenhein2008), in the M. sexta enteric nervous system (Copenhaver and Taghert, Reference Copenhaver and Taghert1989; Wright and Copenhaver, Reference Wright and Copenhaver2000) and in zebrafish peripheral nerves (Kucenas et al., Reference Kucenas, Takada, Park, Woodruff, Broadie and Appel2008). In the moth AN, AN glial cells often appear in chains in vivo especially at the early stages of migration, although the dimensions of the nerve and the pattern of glial process extension indicate that chaining alone cannot be responsible for continuous ensheathment of axon bundles. A more complex behavior was also suggested by the formation of multi-cellular glial arrays in vitro when dissociated AN glial cells were grown close to, but not in contact with, receptor axons (Tucker and Tolbert, Reference Tucker and Tolbert2003). In these experiments, the formation of the multi-cellular arrays was the result of glial-cell migration and process extension in response to an as yet unidentified short-range diffusible signal.
During the early migratory phase in M. Sexta, as early as we have been able to record from them, AN glial cells are highly dye coupled, raising the possibility that some of the signals affecting the migratory or proliferation pattern of the glial cells may be passed via gap junctions among the AN glial cells. In other systems in which glial cells migrate in chains (LeCaudey and Gilmour, Reference LeCaudey and Gilmour2006), the leading glial cells must pass to the follower cohort information that maintains the chain of glial cells. Whether gap junctions between the cells forming a chain participate in coordinating the pioneer and follower cells in the AN system of the moth is not yet known. Alternatively, signals that coordinate migration and proliferation within a group of glial cells may be disrupted by the loss of gap junctional coupling, allowing the cells to stop migrating and to develop their mature morphological and physiological state (Caveney, Reference Caveney1985; Bruzzone and Dermietzel, Reference Bruzzone and Dermietzel2006).
What causes the dramatic loss of dye coupling among moth glial cells between stages 6 and 9? At the time the coupling is reduced, the titer of the steroid hormone 20-hydroxecdysone is near its peak (Kirschenbaum et al., Reference Kirschenbaum, Higgins, Tveten and Tolbert1995) and might either directly affect coupling or affect the development of electrical activity in the receptor axons. Development of the calcium current in the AN glial cells clearly depends on activity in the ORN axons and a change in cytosolic calcium may affect the formation or regulation of gap junctions between the glial cells. Although we detected few gap junction in stage 18 ANs, it is possible that small, difficult to discern junctions remain between glial processes at more mature stages in the moth. If so, the coupling ratio among them may be regulated (Stebbings et al., Reference Stebbings, Todman, Phillips, Greer, Tam and Phelan2002; Goodenough and Paul, Reference Goodenough and Paul2009). In contrast to the situation in moth, gap junctions in mice are readily detected between OECs in the olfactory nerve layer in adult mice by both immunocytochemistry and electrophysiology, although OECs varied in the number of OECs to which they were coupled via gap junctions (Rela et al., Reference Rela, Bordey and Greer2010).
In other systems, such as the Drosophila embryo, long-distance signals such as Netrin guide the migration of the longitudinal glial cells (von Hilchen et al., Reference von Hilchen, Hein, Technau and Altenhein2010). In M. sexta, however, a long-distance signal from the target that regulates the directionality of glial migration is unlikely. The brain can be removed at the start of metamorphic development and a nerve still often forms (Sanes et al., Reference Sanes, Hildebrand and Prescott1976), although ending in a neuroma, and glial cells still migrate into the nerve (Oland et al., Reference Oland, Pott, Higgins and Tolbert1998). Receptor axons, on the other hand, are attracted to the antennal lobe by a diffusible signal (Oland et al. Reference Oland, Pott, Howard, Inlow and Buckingham2003).
The third stage of glial network formation is process extension. The axons coursing in the mature AN are ensheathed in small bundles by the processes of the peripherally derived AN glial cells. The glia enwrap bundles of 50–80 small-diameter axons, giving the AN a cross-sectional appearance similar to that of the olfactory nerve in vertebrates (Kreutzberg and Gross, Reference Kreutzberg and Gross1977; Barber and Lindsay, Reference Barber and Lindsay1982; Doucette, Reference Doucette1984; Burd, Reference Burd1991). This pattern of glial ensheathment of bundles of small-diameter axons is also seen in the vertebrate central nervous system, for example in the cerebellar array of parallel fibers (Peters et al., Reference Peters, Palay and Webster1991) and in Lissauer's tract in the spinal cord (Chung and Coggeshall, Reference Chung and Coggeshall1979).
The pattern in Drosophila is somewhat different from that in M. sexta. The cells that are functionally equivalent to AN glial cells in enwrapping the axonal bundles in the AN are centrally derived (Sen et al., Reference Sen, Shetty, Jhaveri and Rodrigues2005); glial cells that arise in the olfactory sensory epithelium of the antenna form a sheath around the nerve branches in the antenna and contribute to the network of glial processes associated with the cell bodies of the sensory neurons, but apparently do not migrate into the nerve (Jhaveri et al., Reference Jhaveri, Sen and Rodrigues2000).
The pattern of ensheathment in the olfactory nerves of moth and mammals is very different from that seen in the peripheral nerves and most cranial nerve in vertebrates. In most vertebrate peripheral nerves, non-myelinating Schwann cells extend processes around small-diameter axons, separating each individual member of the axonal group from its neighbor in a structure called a Remak bundle. Remak-like bundles also are formed by wrapping glia in the typical peripheral nerve of Drosophila (Rodrigues et al., Reference Rodrigues, Schmidt and Klämbt2011). In the olfactory nerves of both mammals and M. sexta, axons are not myelinated. Instead they are ensheathed as bundles by the olfactory nerve glial cells (Peters et al., Reference Peters, Palay and Webster1991).
The functional consequence of ensheathing bundles of small axons rather than providing a glial wrap for individual axons is especially interesting in the context of the olfactory nerve where the axons in each bundle in the AN are not physically separated from each other but also are not expected to share an odotypic phenotype and therefore would not be expected to be simultaneously active in response to stimulation with a particular odorant. The question arises then, what is the physiological function of this arrangement? Because the axons in a bundle are not related by a shared olfactory receptor in the AN of the moth or in the olfactory nerve of vertebrates, having not yet reached the sorting regions of these pathways, the role cannot be one of electrical isolation of groups of related active axons. The glia could be serving the traditional role of metabolic support (Nave and Trapp, Reference Nave and Trapp2008), the consistency in the size of the bundles in both vertebrate and invertebrate olfactory nerves suggesting that there might be an optimal distance from active axons at which a glial-cell presence is required. On the other hand, in Xenopus, axon bundles in the olfactory nerve are typically in the same size range, but bundles as large as several thousand axons have been found in the nerve (Burd, Reference Burd1991), suggesting that a simple distance argument does not explain the arrangement. In other olfactory systems, OECs have been shown to support axon extension (Kafitz and Greer, Reference Kafitz and Greer1999) in culture and in vivo (Li et al., Reference Li, Li and Raisman2005), and several studies have implicated OECs as a source of neurotrophic factors (Mackay-Sim and Chuah, Reference Mackay-Sim and Chuah2000; Carter and Roskams, Reference Carter and Roskams2002; Su and He, Reference Su and He2010). Support of axon extension could be useful in a system in which there is continuous axon ingrowth in the adult, but may be important only in the later stages of axon ingrowth during development in the moth. Having a nearby source of neurotrophic factor(s) may be useful in both moth and mammalian olfactory nerves as well as those CNS tracts with a similar organization.
Calcium current in the AN glial cells
Calcium transients in glial cells have been reported in many systems, including OECs in the mammalian olfactory bulb (Rieger et al., Reference Rieger, Deitmer and Lohr2007), astrocytes in the mouse cortex (van den Pol et al., Reference van den Pol, Finkbeiner and Cornell-Bell1992), neuropil glial cells in the antennal lobe of the moth and giant glial cells in the ganglia of the medicinal leech (Lohr et al., Reference Lohr, Heil and Deitmer2005; Lohr and Deitmer, Reference Lohr and Deitmer2006). Many of these calcium transients in invertebrates have been attributed to voltage-gated calcium channels (Lohr and Deitmer, Reference Lohr and Deitmer2006), but we have found no reports of recordings from glial cells in invertebrate nervous systems in which the type of calcium current was identified.
In the current study, abolition of the dominant outward potassium currents with Cs+ and 4-AP revealed a voltage-gated inward current that could be abolished with external Cd2+ or Mg2+ indicating it to be a calcium current. Exposure to SNX-428 further characterized the current as an R-like current (see below). We found no evidence for Na+ channels in the AN glia, although expression of Na+ channels has been described in mammalian astrocytes (e.g. Waxman and Black, Reference Waxman, Black, Kettenmann and Ransom1995).
We initially found that the calcium current was reduced by Verapamil (not shown), an L-type channel blocker, but only at concentrations at which Verapamil has been shown to be non-selective (Diochot et al., Reference Diochot, Richard, Baldy-Mounlinier, Nargeot and Valmier1995). The kinetics of the currents we recorded could not be used to classify the type of calcium current in part because glial cells can be coupled during the stages at which we recorded, sometimes in large networks. Further, although we showed that dye coupling was dramatically reduced between stages 6 and 7, we do not know whether coupling can be modulated by neuronal activity during the stages from which we recorded. Nevertheless, the relatively slow rise time suggested the possibility that the current could be an R-like current (Shih et al., Reference Shih, Hsu, Wang and Ko2010). R-like currents mostly have been described in vertebrate neurons where in rat they have been shown to be involved in the formation of presynaptic calcium microdomains that evoke long-term potentiation at parallel fiber-to-Purkinje cell synapses (Myoga and Regehr, Reference Myoga and Regehr2011). They also have been reported in cultured cockroach embryonic neurons where they showed a developmentally regulated increase in current density (Benquet et al., Reference Benquet, Pichon and Tiaho2004) and were associated with both survival and neurite outgrowth (Benquet et al., Reference Benquet, Guen, Dayanithi, Pichon and Tiaho1999). In the moth AN glia, the inward current can be almost completely abolished, reversibly, by exposure to 100 nM SNX-482, indicating that these glial cells express a voltage-gated R-like calcium channel.
The importance of calcium transients in neuronal migration is widely recognized (Cook and Becker, Reference Cook and Becker2009), but is less understood in glial migration. Glial migration in the moth AN has begun by stage 3 of metamorphic development, a stage at which neuropil glia have not yet developed calcium transients (Lohr et al., Reference Lohr, Tucker, Oland and Tolbert2002). In the neuropil glia, calcium imaging showed that calcium transients begin to appear at stage 6, when neuropil glial cells begin to migrate to surround and stabilize developing glomeruli; they were present in all neuropil glial cells by stage 7 (Baumann et al., Reference Baumann, Oland and Tolbert1996; Lohr et al., Reference Lohr, Heil and Deitmer2005; Lohr and Deitmer, Reference Lohr and Deitmer2006). We began our whole-cell recordings from AN glial cells at stage 6, when some of the AN glia have migrated from the sensory epithelium in the antenna and entered the intracranial portion of the nerve. At this time, the calcium current is present in at least a subset of AN glia. By stage 7, when AN glial cells have reached the lateral border of the sorting zone, the calcium current could be recorded in all glial cells, similar to the finding in the neuropil glia.
In vivo exposure to SNX-482 during the first 3 days of glial migration into the nerve resulted in a greatly reduced glial investment of the nerve, in some cases blocking it entirely. When some glial migration did occur, the glial cells formed obvious chains. The formation of multicellular glial arrays in vitro, which depends mainly on glial-cell proliferation and process extension, was not affected during exposure to SNX-482, consistent with the presence of glial chains in vivo when migration occurred. We know that blocking Na+-based activity in ORNs with chronic TTX exposure did not block AN glial migration and, as noted earlier, Zufall et al. (Reference Zufall, Stengl, Franke, Hildebrand and Hatt1991) reported that M. sexta ORNs lack a voltage-gated calcium channel. Taken together, these data indicate that the inhibition of glial migration seen with SNX-exposure was due to blocking the R-like glial calcium current in the AN glial cells, not to an indirect effect mediated by blocking an R-like channel expressed by ORN axons. Reducing, but not blocking, the R-like calcium current, by chronic exposure to TTX or by Verapamil (not shown), did not block migration, implying that migration of AN glial cells can occur within a fairly wide range of cytosolic calcium concentrations.
The disruption of migration of AN glial cells caused by blocking the R-like current in the moth provides an opportunity to explore the functional role for the glial/axonal arrangement characteristic of the olfactory nerve. At the gross anatomical level, the perineurial and subperineurial layers of the nerve appear to be intact in treated animals, reducing the possibility of osmotic, toxic or inflammatory effects due to disruption of the blood–brain barrier. Previous studies in which Drosophila glial cells were genetically removed or ablated from peripheral nerves are somewhat difficult to interpret because the barrier may also have been affected, but glial cells clearly are important in maintaining the integrity of the nerve. For example, in glial cells missing, axons in the peripheral nerves are disorganized structurally, with regions of degeneration and swelling of the extracellular space (Banerjee et al., Reference Banerjee, Pillai, Paik, Li and Bhat2006). In fray mutants, ensheathment is abnormal in larval peripheral nerves and axons often are swollen in regions along the nerve (Leiserson et al., Reference Leiserson, Harkins and Keshishian2000); recent studies with the mammalian homolog of fray have revealed that the mutation affects transporter activity that may be important in maintaining normal ionic homoeostasis (Piechotta et al., Reference Piechotta, Lu and Delpire2002).
Role of activity in network formation
The ensheathment of small bundles is essentially complete at about the time the developing moth becomes responsive to odorants, during the last few stages of metamorphic adult development (Schweitzer et al., Reference Schweitzer, Sanes and Hildebrand1976), but begins during earlier stages when spontaneous action potentials first appear in the receptor axons. Glia are known to respond to neuronal activity. For example, Schwann cells in the frog optic nerve display activity-dependent changes in cytosolic calcium (Chiu and Kriegler, Reference Chiu and Kriegler1994), mouse OECs show calcium transients in response to the glutamate released from axons by electrical stimulation of the olfactory nerve and the ensheathing cells in turn release ATP (Rieger et al., Reference Rieger, Deitmer and Lohr2007), Schwann cells in peripheral nerves respond to ATP released from active axons (Grafe et al., Reference Grafe, Schaffer and Rucker2006), and ATP released from dorsal root ganglion cells elicits calcium transients in immature Schwann cell that in turn inhibit Schwann cell proliferation and differentiation (Stevens and Fields, Reference Stevens and Fields2000).
In several developing systems, glial cells also respond to neuronal activity, as has been shown with developing Xenopus spinal cord neurons (Antonov et al., Reference Antonov, Chang, Zakharenko and Popov1999; Zakharenko et al., Reference Zakharenko, Chang, O'Donoghue and Popov1999) and with developing hippocampal neurons (Gao and van den Pol, Reference Gao and van den Pol2000). In the mouse olfactory pathway, for example, nerve stimulation increased extracellular potassium which in turn induced voltage-dependent calcium transients in OECs (Hartl et al., Reference Hartl, Heil, Hirsekorn and Lohr2007). In the moth, Lohr et al. (Reference Lohr, Heil and Deitmer2005) showed that calcium transients in neuropil glial cells developed shortly after the arrival of olfactory receptor axons and failed to appear in systems chronically deprived of receptor axons. It was not clear, however, whether the absence of calcium transients was due specifically to activity in the receptor axons, or even to spontaneous release of either nitric oxide or transmitter from the tips of growing axons (Young and Poo, Reference Young and Poo1983; Gibson and Nighorn, Reference Gibson and Nighorn2000). In the current study, the R-like current was reduced but not abolished by loss of neuronal activity. The reduction in the R-like calcium current seen when activity in the axons is chronically blocked certainly suggests that neuronal activity affects the full development of the R-like current. The TTX-treated animals showed no obvious change in glial density or position (Fig. 10), suggesting either that the residual calcium current was sufficient to support glial proliferation and migration or that these processes are not dependent on calcium entering the cell via this kind of channel. Given the importance of calcium in numerous developmental processes, the residual calcium current present in glial cells in TTX-treated animals may underlie effects other than regulation of coupling or glial-cell migration in both the developing and adult olfactory nerve.
ACKNOWLEDGEMENTS
The authors gratefully acknowledge the help of Margaret Marez, who maintains the Department of Neuroscience M. sexta colony; Anna Burns, who manages the Cell Culture Facility and made solutions and culture dishes; Patricia Jansma, who manages the Imaging Facility and provided excellent technical advice on immunocytochemistry and microscopy; Nicholas Gibson, who generously provided us with the images that appear in Fig. 5A–C; Jinhui Zhang, who generously provided us with the image that appears in Fig. 5F; and Jon Hayashi, who was an essential guide in M.K.'s early training in whole-cell recording methods. Funding for this project was provided by NIH NIDCD DC00857 to LAO, HHMI 52003749 in support of M.K. through the University of Arizona Undergraduate Biology Research Program, and a Microscopy Society of America Undergraduate Research Award to M.K.
Statement of interest
None.