


Introduction
Since coalmining was started at Svea-Nord, Svalbard, in autumn 2001, the operation of the mine during summer seasons has been complicated by water intrusions originating from a glacier above the mine (Reference Melvold, Schuler and LappegardMelvold and others, 2003). During summer, the water inflow reaches maximum rates in the order of 1000–2000 m3 h–1. Since the lowermost part of the mine is about 60 m below the mine entrance, the water cannot drain freely out and backs up in the lowest parts of the mine. The current praxis, pumping the water to the surface, is an expensive undertaking, hence the investigation of alternative possibilities to evacuate the water. In an earlier paper, we argued against evacuating the water along the bed of an adjacent glacier since simulations of drainage through a subglacial channel indicate that under the given conditions water flow would most likely be pressurized, so gravitational drainage from the mine would be inhibited (Reference Melvold, Schuler and LappegardMelvold and others, 2003).
As significant enlargement of the mine is planned, the design and evaluation of alternative techniques to evacuate the water requires reliable predictions of the total volume and the rate of future water intrusions. In this paper, we simulate the 2003 melt- and rainwater production at the glacier surface and its transfer to the mine and use this model to assess the possible future evolution of water intrusions.
Field Site and Data Acquisition
Gruvefonna is a small ice cap in the southwestern part of Spitsbergen, Svalbard. This relatively flat ice field is about 3km long and 2.5 km wide and its elevation ranges from 600 to 880m (Fig. 1). The ice cap is considered to be polythermal, in common with most glaciers in Svalbard (e.g. Reference LiestølLiestøl, 1976), and is up to 250m thick. Gruvefonna feeds three large outlet glaciers: Slakbreen (41.5 km2), Marthabreen (18.3 km2) and Høganesbreen (13.4 km2) (Reference Hagen, Liestøl, Roland and JørgensenHagen and others, 1993). Ice flows through steep bedrock channels to Marthabreen from the northern parts of Gruvefonna and to Høganesbreen from the southern parts. The western parts are gently sloping and drain towards Slakbreen.
Map of the Gruvefonna region. The glacierized and nonglacierized areas are shown in white and grey respectively. The dots mark the positions of ablation stakes, and the star and the diamond indicate the positions of the weather station and the summit temperature sensor, respectively. The extents of both the excavated (shaded) and the planned (outlined) mine are indicated on the map. Grid zone is UTM 33 and units are metres. The inset shows the locations of the study site (GF) and Longyearbyen (Lyb) within Svalbard.

The planned extent of the mine underneath Gruvefonna is outlined in Figure 1. The dotted area denotes the parts where coal has been excavated up to summer 2003. After removal of the coal, the roof of the mine is brought down to reduce the load on the remaining coal layer, thus presumably increasing the permeability of the material between the glacier bed and the mine.
Mass-balance measurements
To calibrate a glacier melt model, we conducted mass-balance measurements over parts of the 2003 ablation season. In April 2003, we installed ten ablation stakes distributed over Gruvefonna and along Høganesbreen (Fig. 1) to capture the mass-balance distribution. The stakes are distributed over an altitudinal range of 280-880 m and the dominating aspect classes.
To assess the water equivalent of the snow cover at the beginning of the period over which the mass balance is to be determined, we measured thickness and density of the snowpack at each stake location. In addition, we probed the snow thickness manually in a regular grid of ∼250m spacing across Høganesbreen, and on the Gruvefonna plateau we used Ramac ground-penetrating radar with 500 MHz antennae. The radar data were later resampled to a 200 m resolution. The thickness measurements were spatially interpolated according to the description by Reference Liu, Jezek and LiLiu and others (1999) to construct a map of the initial snow cover. The snow thickness was converted to water equivalent using a mean density of 328 kg m–3. The standard deviation of the density measurements from this mean value is <12% and we estimate the total error associated with the map to be in the same order.
In August 2003, the winter snow cover had completely disappeared at all stakes and we measured the stake emergences in two instances on 9 and 10 August and 17 August.
Automatic weather station
Close to the stake at 480 m a.s.l., we operated an automatic weather station (AWS) to measure air temperature and surface lowering. We used an Aanderaa 2775 air-temperature sensor mounted in a radiation screen and installed it initially 2 m above the ice surface. An ultrasonic rangefinder ULS 3600 Aanderaa was installed to record a high-resolution time series of surface lowering. During the 2003 melt season the glacier surface had melted back such that the rangefinder was >3 m away from the glacier surface. The instrument was subsequently set to a lower position to reduce its vibrations with the wind and thus attain more stable readings. The station was operated until the end of the ablation season in November 2003 at intervals of 10 min.
To analyze the temperature variations with elevation, a second temperature sensor was installed at the top of Gruvefonna, at 880 m a.s.l. The sensor and instrument set-up was identical to that at the lower station, and the summit station was operated from 7 April to 10 August 2003 and yielded an average lapse rate of −0.0068Km–1.
Discharge measurements in the mine
Water intrudes at many different places into the mine and flows in small creeks towards a pool of ∼ 1000m3 at the lowest part of the mine. Pumps conducting the water to the surface are triggered when the water level in this pool exceeds a critical value. The effective pump rate was measured at intervals of 10min using two ultrasonic Doppler flow meters (Endress prosonic flow 93 P) that were attached to the pipes through which the water was conducted to the surface. The producer quotes the accuracy of these measurements to be better than 5%.
Production of Surface Meltwater
Air temperature has been found to correlate well with melt since temperature directly or indirectly affects various components of the surface energy budget, especially the turbulent heat fluxes and longwave atmospheric radiation (Reference BraithwaiteBraithwaite, 1981; Reference OhmuraOhmura, 2001). This dependency forms the physical basis of so-called temperature-index melt models which describe an empirical relationship between air temperatures and melt rates. Such temperature-index models are the most common approach for melt modelling for a variety of reasons, such as the wide availability of air-temperature data and their relative ease of interpolation and forecasting possibilities, and the generally good model performance despite their simplicity (Reference HockHock, 2003).
Model description
We have applied a distributed temperature-index method developed by Reference HockHock (1999) that includes potential direct solar radiation. The latter accounts for shading of the glacier due to surrounding topography, and the effects of local slope and aspect of the glacier surface. The diurnal melt rate M (mm d- 1 ) is then calculated as

where MF is a melt factor (mmd–1˚C–1), a snow/ice is a radiation coefficient different for snow and ice surfaces (m2W–1 mm d-1 °C–1) and T is air temperature (°C). The potential direct solar radiation at the glacier surface, I (Wm–2) , is calculated as a function of solar geometry and topographic characteristics (Reference HockHock, 1999). In several different applications, the model formulation was able to simulate accurately meltwater production (e.g. Reference HockHock, 1999; Reference Flowers and ClarkeFlowers and Clarke, 2002; Reference Schuler, Fischer, Sterr, Hock and GudmundssonSchuler and others, 2002).
Model operation
Melt rates at the glacier surface were calculated using Equation (1) for each glacier gridcell of a digital elevation model (DEM). To this end, we used a 50 m resolution DEM of the Gruvefonna region as the computational domain. This DEM was constructed from 1990 aerial photographs. The outlines of the glacier-covered regions were derived from the same aerial photographs. The computation of potential clear-sky solar radiation requires further digital maps of slope and aspect angles, which were derived directly from the DEM. In addition, the effect of topographic shading at each gridcell was determined at hourly time-steps based on the effective horizon and the position of the sun. A further raster map contains the distribution of initial snow water equivalent and served as a starting situation for the calculations. Air temperature is required as input data for the model (Fig. 2b). Precipitation is also considered because the period over which the model is run includes times of snow accumulation, and also because it accounts for the contribution of rainfall to total water input. For this purpose, we used precipitation data from the meteorological station in Longyearbyen, approximately 37 km north of Gruvefonna (Fig. 2a).
Daily values of (a) precipitation, P, in Longyearbyen, (b) air temperature, T, at the AWS on Høganesbreen and (c) melt rate, M, averaged over the entire model domain.

Typically, model runs were performed for the period of the temperature record, from 8 April 2003 to 4 November 2003 when the recording of pump rates was stopped. The model was run with daily time-steps since precipitation data were available only at this interval. The air temperature recorded at the AWS was extrapolated and distributed to each gridcell using the linear lapse rate of –0.0068 Km–1 that was derived from measurements. Precipitation was distributed spatially using a gradient with elevation for which we adopted a value of +15%(100m)–1 in agreement with measurements of Reference Sand, Winther, Maréchal, Bruland and MelvoldSand and others (2003). A threshold temperature of 1˚C was used to decide whether the precipitation was snow or rain, and a correction factor was applied to account for undercatch of the precipitation gauge. The calculated melt rate is shown in Figure 2c.
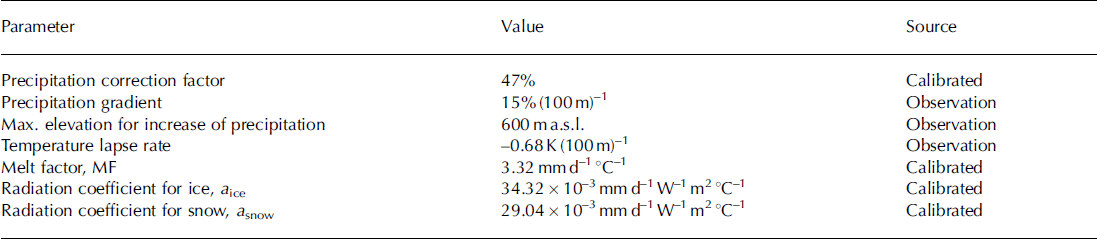
The melt-factor and radiation coefficients for snow and ice are empirical coefficients, the values of which were adjusted iteratively to optimize the agreement between model results and mass-balance measurements. In doing so, attention was paid to a number of different criteria. Mainly, we aimed to minimize the deviation of modelled from observed values at individual stakes (Fig. 3a). An additional condition was to reproduce the variation of mass balance with elevation (Fig. 3b), and a third target was to replicate the high-resolution time series of ice ablation that was provided by the ultrasonic rangefinder after the winter snow cover disappeared (Fig. 3c). Calibrated parameter values are presented in Table 1. Compared to former applications of this model (Reference HockHock, 1999; Reference Schuler, Fischer, Sterr, Hock and GudmundssonSchuler and others, 2002), we find that the melt factor and the radiation factors are approximately twice as large, probably reflecting the persistent summer melting in the High Arctic.
Model performance. (a) Measured vs modeled mass balance at individual ablation stakes. (b) Mass balance vs elevation; squares represent values of the period 8 April–10 August 2003, and circles those of 8 April–17 August 2003. (c) Time series of cumulative melt at the weather station site.

Adjusted model parameters and their optimized values
Subglacial Catchment Area
In principle, the direction of water flow follows the gradient in hydraulic potential. At the bed of a glacier, the hydraulic potential is determined by both the topography of the glacier bed and the thickness of the overlying ice (Reference ShreveShreve, 1972).
Combining datasets from exploratory drilling by the mining company and different radar surveys (Reference Hamran and AarholtHamran and Aarholt, 1993; Reference Melvold, Schuler and LappegardMelvold and others, 2003; C. Jaedicke, unpublished data), Schuler and Melvold (unpublished information) constructed an ice-thickness map of the Gruvefonna region. Assuming that the basal water pressure equals the ice overburden pressure, we calculated the hydraulic potential H at the glacier bed

where z is the topographical height of the glacier bed, ρ i and ρ w denote the densities of ice and water respectively, hi is the local ice thickness and H is expressed in terms of hydraulic head (m). The elevation of the glacier bed was derived by subtracting the ice thickness from surface elevation. Adopting Reference ShreveShreve’s (1972) concept of water flow being always directed down the potential gradient, we determined the subglacial catchment area of the mine (Fig. 4).
The subglacial catchment area (thick line) of the current mine (hatched rectangles) and several steps of enlargement (unhatched rectangles) delineated from the distribution of hydraulic potential at the glacier bed. The hydraulic potential is shown as both contours and shading whereby light and dark shades of grey indicate high and low values, respectively.

Results
Meltwater production
In general, the simulated melt corresponds fairly well to the measured melt (Fig. 3), and evaluating the model performance we find a discrepancy of ∼19%. This value is comparable to accuracy estimates in previous studies (e.g. Reference Schuler, Fischer, Sterr, Hock and GudmundssonSchuler and others, 2002). However, some deviations are recognized from Figure 3a, where the points off the 1:1 line at low melt rates indicate that the model fails to explain the observed variability on the plateau of Gruvefonna. We associate this low variability of our results with the weakly pronounced topography on the plateau and the nearly homogeneous distribution of solar radiation, two factors that control melt distribution in our model formulation. In contrast, the natural distribution of melt is strongly influenced by snow redistribution by wind, a process that is not accounted for by our simple model. The underestimation of melt at the stakes located between 400 and 600ma.s.l. and at the top of Gruvefonna (Fig. 3b) can be explained by the same mechanism. Erosion of snow due to higher wind speed at the summit and at the entrance into the narrow valley that confines Høganesbreen may lead to an earlier exposure of glacier ice and thus induce increased melting. The good match of measured and calculated time series of melt shown in Figure 3c demonstrates that apart from uncertainties due to the complex distribution of snow, the melt model performs well. The total meltwater production in the period 8 April–4 November 2003 varies from 1000 mm on Gruvefonna to ∼3000mm further down along Høganesbreen at lower altitudes.
The time series of meltwater production (Fig. 2c) in the entire model domain demonstrates that melt in early June occurred sporadically. Continuous melt production is marked by a sudden onset in late June. The main melt season lasted throughout July and large parts of August, and shows large melt variability, presumably reflecting local weather patterns. Melt production during that period reached peak values of 2.5 × 10⁶ m3 d–1 and rarely declined below 1 × 1 0 6m3d–1 . After 20 August, melt production dropped suddenly and was almost terminated. A last pronounced melt event occurred at the beginning of September before melting at the glacier surface ceased.
Input–output analysis
To analyze the transfer of water from the glacier surface to the mine, we compare the total volumes of water production (including rain) and of pumped water out of the mine. However, the exact extent of the surface area that contributes to the mine discharge is a priori unknown; therefore we have estimated the contributing area considering two extreme situations. For a minimum contributing area, we assume that only the glacier surface located directly above the mining area contributes to mine discharge (scenario A). For a maximum contributing area, we assume that the entire surface located above the subglacial catchment drains to the mine (scenario B).
The subglacial catchment area was determined based on the distribution of hydraulic potential at the glacier bed as described above. The calibrated melt model was applied to each of these two surface areas.
The simulated, total melt production in the area considered in scenario A amounts to 1.69 × 10⁶m3 (±20%), most of it originating from melt. The contribution of rain is <2%. In comparison, the total discharge volume pumped from the mine was about 2.83 × 10⁶ m3 (±5%) and exceeds the total water production on the glacier surface by 67%. This implies that the mine discharge receives contributions from a significantly larger surface area than in scenario A.
The subglacial catchment area of the current mine is approximately 1.7 times larger than the mining area itself, and the calculated runoff from the glacier surface directly above this area (scenario B) amounts to 2.85 × 1 0 6m3 (±20%). Again, the bulk of the water stems from glacier melt, and the contribution of rain is 3.5%. The excellent agreement between calculated and measured water volumes indicates that the approach in scenario B is appropriate for estimating the catchment area of the mine, and we apply this procedure in our subsequent considerations.
Figure 5 displays the calculated meltwater flux from the surface directly above the subglacial catchment, and the measured mine discharge. The mine discharge shows a sudden onset similar to the melt production but with a delay of a few days. It appears that the variations of melt production during July and August are much larger than those of the mine discharge. After surface melt drops to low levels around 20 August, mine discharge continues at a high level for a few days before starting a gentle, exponential decline. This decline lasts approximately until the beginning of November when the logging of pump rates was stopped, while melt production had already ceased in September. This behaviour can be described using a linear reservoir approach (e.g. Reference Chow, Maidment and MaysChow and others, 1988). The method describes routing of water through a system, the outflow of which is proportional to the stored water volume. At the time nΔt, the response of a linear reservoir to a sequence of rectangular pulses is expressed by

The melt- and rainwater flux calculated for the catchment area of the actual mine (grey line), and the discharge in the mine simulated by the linear reservoir model (dotted line) and derived from pumping records (black solid line).

where I and Q denote the input and output discharge, k is a storage constant and Δt is the time-step of the calculation (e.g. Reference Chow, Maidment and MaysChow and others, 1988).
Applying this model, we have calibrated the storage constant and found that a value of 14 days yields minimum discrepancy between the modelled output and the observed mine discharge (Fig. 5). This simple model simulates the discharge in the mine surprisingly well (r 2 = 0.95) considering that it describes in reality a complex system of water transfer at the glacier surface, through the glacier body and through the cracked bedrock to the mine. The discrepancies between model predictions and discharge measurements presumably originate from the simple structure of the linear reservoir model, which cannot account for the entire complexity of the considered system. Due to its overall good performance, we have selected this approach to produce scenarios of future water intrusions into a progressively enlarged mine.
Implications for future evolution
To predict future water intrusions into a mine that is progressively enlarged, we applied the coupled melt and transfer models to several stages of the planned extension. In detail, we have mapped the subglacial catchment area for each of the planned panels and applied the melt model to the corresponding glacier surface. The melt model was driven by the meteorological data available for 2003. Finally, the calculated melt- and rainwater fluxes served as input to the linear reservoir model to predict the rate of water intrusions into the mine for each considered step of enlargement.
The model results for eight steps of enlargement are presented in Figure 6. Since we have used the same meteorological data in all calculations, and the water intrusion is largely controlled by glacier melt, the shape of the hydrograph as simulated for the current mining area is preserved in the future scenarios. However, the predicted hydrographs appear vertically stretched relative to the reference curve, since the total discharge volume increases considerably with enlargement of the mine. Our predictions suggest that the total water volume will increase from 2.8 × 1 0 6m3 (±20%) to about 9 . 8 × 1 0 6m3 (±20%) (an increase of 350%) when the mining area is enlarged from the current to full size. The maximum diurnal discharge will increase from ∼54 × 103 m3 d–1 (±20%) in 2003 to roughly 190 × 103 m3 d–1 (±20%) as the maximum extent is reached (an increase of 350%).
The hydrograph of discharge in the mine as predicted for the current mine (2003) and eight steps of enlargement. The hydrograph is based on the meteorological input data from 2003.

Concluding Discussion
In this study, we have calibrated a spatially distributed melt model using mass-balance measurements to simulate water production at the surface of Gruvefonna. The transfer of meltwater produced in the catchment area of the mine was simulated using a linear reservoir approach. The modelled hydrograph of water intrusions reproduces the observed pump rates reasonably well, in terms of both volume and shape. This model has then been used to predict the rate of water intrusions into the mine at several stages of enlargement. The results suggest that the volume of water intruding into the mine will increase by about 350% when the mine reaches its full planned extent.
The reliability of the predictions might be affected by the following simplifying assumptions which are implied in the formulation of our model. First, we assume that the parameters of the melt model are constant and equally valid in the future. However, the parameters of the melt model are constrained by ablation measurements conducted during one season only. Second, it was assumed that the meteorological data collected in 2003 are representative for weather conditions in the future, although temperature and precipitation vary considerably from year to year, causing pronounced variability of meltwater production. Third, our assumptions imply that the transfer of water from the glacier surface to the mine always occurs in the same way. The actual value of the storage constant will not apply anymore if the considered system undergoes significant changes. This might be the case, as the mine will be enlarged into an area where the bedrock cover between the glacier bed and the coal layer is significantly thinner (<100m in contrast to >300 m presently). To address these concerns and to improve the data on which our model is based, we intend to continue the monitoring work and update the model as necessary.
The existence of an efficient hydraulic connection between the glacier surface and the mine demonstrates that the glacier body above the mine must be highly permeable. This agrees with the finding that many glaciers in Svalbard are temperate in their accumulation zone (Reference LiestølLiestøl, 1976; Reference BjörnssonBjörnsson and others, 1996). In addition, the firn cover that efficiently retards meltwater runoff (e.g. Reference Fountain and WalderFountain and Walder, 1998; Reference Jansson, Hock and SchneiderJansson and others, 2003) has completely disappeared from Gruvefonna during recent years. Field visits revealed that the uppermost part of Gruvefonna is heavily crevassed and meltwater enters the glacier interior at many places.
Another interesting outcome concerns the technique by which we determined the area that drains towards the mine. To this end, we mapped the catchment area on the hydraulic potential surface at the glacier bed. This approach is based on considerations made by Reference ShreveShreve (1972) and is commonly used to map drainage basins on ice caps (e.g. Reference BjörnssonBjörnsson, 1982; Reference Kennett, Rolstad, Elvehøy and RuudKennett and others, 1997) and to investigate the possible structure of the subglacial drainage system (e.g. Reference Hagen, Etzelmüller and NuttallHagen and others, 2000; Reference Melvold, Schuler and LappegardMelvold and others, 2003). Previously, this procedure has been evaluated by comparing the runoff volume from this basin with its meltwater production (Reference Thomsen, Thorning and OlesenThomsen and others, 1989; Reference Kennett, Rolstad, Elvehøy and RuudKennett and others, 1997). However, it was found that this was not a strong constraint since the hydraulic potential was mainly used to detect the drainage divides in the upper parts of the glacier, while most runoff stems from the lower ablation region, the borders of which are usually given by the glacier margins. In our study, however, we delineated a catchment area that is completely covered by the glacier and the borders of which are not obvious from the surface topography. The good agreement between observed and calculated runoff from this area strongly suggests that the hydraulic potential approach is an appropriate technique to determine drainage divides.
Acknowledgements
The authors wish to thank Y. Gjessing, C. Jaedicke and M. Grønnevet for providing the radar data collected during the University Centre in Svalbard (UNIS) course AGF-212 (Processes in ice and snow). Special thanks go to T. Abrahamsen for her help with all the maps, to R.A. Hanssen for the pumping data from the mine, and to J.M. Stenvold. S. Vaagland provided energetic help during the fieldwork and prepared the snow distribution map. We further appreciate the thorough reviews by J. Corripio and I. Willis which helped to improve the manuscript.



