

“A story once went the rounds of Israel to the effect that [David] Ben-Gurion described me as ‘the only man’ in his cabinet. What amused me about it is that he (or whoever invented the story) thought that this was the greatest compliment that could be paid to a woman. I very much doubt that any man would have been flattered if I had said about him that he was the only woman in the government!”
— Golda Meir, quoted in Jamieson (Reference Jamieson1995, 128)Do messages that evoke a gendered leadership style, whether masculine or feminine, affect attitudes toward well-known candidates? Some scholars find that both male and female candidates are able to successfully appeal to female (but not male) voters by priming considerations of gender (Holman, Schneider, and Pondel Reference Holman, Schneider and Pondel2015). Others find contradictory effects: for instance, Bauer (Reference Bauer2015a) finds that messages confirming gender stereotypes diminish support for female candidates but not for male candidates, while Rudman and Phelan (Reference Rudman and Phelan2008) find that countering gender stereotypes diminishes support for female candidates, often referred to as “backlash effects.” Still other accounts suggest that voters’ stereotypes of female politicians are “nebulous” (Schneider and Bos Reference Schneider and Bos2014, 262), and some question whether gender stereotypes matter at all relative to party stereotypes (Dolan Reference Dolan2014; Hayes Reference Hayes2011).
Yet observers of modern elections might be forgiven for thinking that gendered leadership styles do make a difference to voters. Indeed, many female politicians in the United States and the consultants who work with them express deep conviction that they are being judged on their femininity and masculinity, as Dittmar (Reference Dittmar2015) documents through extensive interviews. Coverage of candidates around the world suggests much the same thing. Female politicians who adopt stern, masculine styles of leadership, such as Prime Ministers Golda Meir and Margaret Thatcher, earn the sobriquet “Iron Lady.” Male executives such as President Vladimir Putin and Governor Arnold Schwarzenegger (“The Governator”) promote their hypermasculine profiles. Voters labeled Chancellor Angela Merkel, with her demure, collaborative style, “Mutti,” and President Ellen Johnson Sirleaf, mother of four, “Ma Ellen.” Examples of an overtly feminine male leader are harder to come by; perhaps Prime Minister Justin Trudeau, with his emphasis on listening and inclusivity, comes closest. And Secretary Hillary Clinton reminds us that these epithets need not arise from some ground truth about one's personality: while in her 2008 presidential campaign, she struck a masculine style (Jones Reference Jones2016), she changed her appeals in 2016 to emphasize nurturing and families (Reiheld Reference Reiheld2017). Was this wasted effort? If not, might other candidates benefit from being perceived as more stereotypically feminine or masculine? If so, who, and among what sorts of constituencies?
Early scholarship on gender stereotypes in politics examined how the traits that voters project onto candidates vary based on the candidate's sex (for reviews, see Dolan Reference Dolan2010; Schneider Reference Schneider2014). The current literature typically focuses either on the different assumptions voters make about male versus female candidates’ characteristics, issue positions, and qualifications (Atkinson and Windett Reference Atkinson and Windett2019; Bauer Reference Bauer2015a; Ditonto, Hamilton, and Redlawsk Reference Ditonto, Hamilton and Redlawsk2014; Mo Reference Mo2015; Schneider and Bos Reference Schneider and Bos2014) or on the different language the media uses to describe male versus female candidates (Aaldering and Van Der Pas Reference Aaldering and Van Der Pas2020; Hayes and Lawless Reference Hayes and Lawless2016; Kahn Reference Kahn1994). Only recently has this field begun using experiments to assess whether voters might be swayed by evoking or making salient different aspects of a candidate's gender, whether through traits, issue positions, and even campaign contexts (Bauer Reference Bauer2016, Reference Bauer2019, Reference Bauer2020; Holman, Merolla, and Zeckmeister Reference Holman, Merolla and Zechmeister2016; Schneider Reference Schneider2014). Those that do almost exclusively examine fictional candidates, leaving it unclear whether and when studies of hypothetical candidates generalize to real-world elections (Andersen and Ditonto Reference Andersen and Ditonto2018; Dolan and Lynch Reference Dolan and Lynch2015).Footnote 1
Building on this literature, I ran two experiments during the lead-up to the 2016 U.S. presidential election, one in September and one in October, with a total of 3,600 registered U.S. voters in California. Through these experiments, I explore whether gendered styles of leadership influence voter evaluations of candidates and, if so, whether there is variation in the candidates who benefit from, or voters who respond to, messages about a particular gendered leadership style. I develop hypotheses from the literature on candidate gender and campaign messaging (Bauer Reference Bauer2016, Reference Bauer2018; Schneider Reference Schneider2014) and test them on several national candidates at the peak of an important election season. This article thus offers two contributions to the existing research. First, it adds to theory by disentangling multiple gender stereotype-based mechanisms through which voters might evaluate candidates. Second, by assessing real politicians during a critical election (e.g., Cassese and Holman Reference Cassese and Holman2019), it adds to work on hypothetical candidate tests of the role of gender stereotypes in real candidate evaluations.
I find that in the context of the 2016 election, these voters evaluated candidates more positively when messages presented candidates as stereotypically feminine leaders than stereotypically masculine leaders. These results held across candidates of both sexes and parties and influenced voters’ perceptions of candidates’ problem-solving strategies in a later question. However, the effects were strongly heterogeneous across respondents. Female, Democratic, and liberal voters favored the same candidate more when he or she was presented as feminine, as did undecided voters and those planning to vote for Hillary Clinton in the general election. In contrast, those planning to vote for Donald Trump favored candidates less when they were presented as feminine. Moreover, I find that women voters have more consistent leadership style preferences for femininity across party lines—a “gender style”—while men follow their “party style”: masculine for Republicans, feminine for Democrats, and independents somewhere in the middle. Finally, my study offers new evidence that candidates’ gendered leadership styles appear to signal something beyond party or issue positions: they signal a distinct way of achieving policy goals. The findings raise new questions about the complex links between gender, partisanship, and ideology, especially for scholars of national elections.
GENDER AND LEADERSHIP STYLES
Early studies of leadership styles attempted to establish which traits voters cared most about when evaluating candidates but did not explore whether the traits voters preferred varied by the sex or gender of the candidates. Such studies often found that traits such as competence, integrity, strength, and empathy mattered to voters (Kinder et al. Reference Kinder, Peters, Abelson and Fiske1980; Miller, Wattenburg, and Malanchuk Reference Miller, Wattenberg and Malanchuk1986). Subsequent work using “candidate evaluation” questions on surveys attempted to assess how great a boost a given trait (or a trait advantage over another candidate) might generate at the polls (Funk Reference Funk1999; Hayes Reference Hayes2005), and active debate continues about which and to what extent traits matter to candidate evaluations (Aaldering and Van Der Pas Reference Aaldering and Van Der Pas2020).
Concurrently, psychological research found that people characterize men as possessing “agentic” traits—such as assertiveness, independence, and competence—and women as possessing “communal” traits—such as empathy, desire to nurture, and warmth (Bem Reference Bem1981; Fiske et al. Reference Fiske, Cuddy, Glick and Xu2002). Extensive scholarship has documented the overlap between masculine traits and leadership traits: in a comprehensive meta-analysis, Koenig et al. (Reference Koenig, Eagly, Mitchell and Ristikari2011) found that when people “think manager,” they “think male.” Implicit attitude tests developed to measure the linkages between gender and leadership have found the same association (Mo Reference Mo2015, 372).
Scholars of gender in politics took notice, and a profusion of research on the linkages between voters’ trait preferences and gender stereotyping of candidates began to emerge (Alexander and Andersen Reference Alexander and Andersen1993; Burrell Reference Burrell2008; Hayes Reference Hayes2011; Jamieson Reference Jamieson1995; Rosenwasser and Dean Reference Rosenwasser and Dean1989). Role congruity theory suggested that women would have to adopt masculine traits to be viewed as competent leaders but then would be penalized for deviating from their prescribed feminine role (Eagly and Karau Reference Eagly and Karau2002; Eagly and Mladinic Reference Eagly and Mladinic1994; Koenig et al. Reference Koenig, Eagly, Mitchell and Ristikari2011). Men, in contrast, would face no such “double bind” (Jamieson Reference Jamieson1995, 14). While it has been difficult to prove conclusively that this double bind exists (Costa Reference Costa2020; Teele, Kalla, and Rosenbluth Reference Teele, Kalla and Rosenbluth2018), recent work shows that female politicians do not benefit from stereotypes of women as being better communicators or having more integrity, while male politicians do benefit from stereotypes of men as strong and politically capable (Aaldering and Van Der Pas Reference Aaldering and Van Der Pas2020; Schneider and Bos Reference Schneider and Bos2014). Synthesizing these literatures, I began with a simple hypothesis:
H1: Leadership is masculine: both male and female leaders benefit from appearing to possess masculine traits, but men benefit more than women.
However, growing polarization in the United States raised new questions about whether gender would matter to candidate evaluations relative to partisanship. While earlier surveys suggested that gender stereotypes matter little relative to party stereotypes (Dolan Reference Dolan2010; Hayes Reference Hayes2011), newer work investigates the interactive relationship between gender stereotyping and partisanship using experiments, and finds that gendered traits do matter, even in partisan contexts (Bauer Reference Bauer2018; Schneider and Bos Reference Schneider and Bos2016). As in the classic “double bind” literature, scholars find that male candidates who engage in partisan “trespassing” strategies (a Republican billing himself as compassionate, for instance, or a Democrat billing himself as tough) attract support from out-partisan voters, whereas female candidates who engage in trespassing do not (Bauer Reference Bauer2019). Similarly, female candidates who work to sell themselves as possessing typically masculine traits such as strength fare better with their co-partisans—but are penalized by out-partisans for being less likeable (Bauer Reference Bauer2016). A related literature on party trait ownership finds that Democrats are assumed to possess more stereotypically feminine traits, such as compassion, and Republicans more stereotypically masculine traits, such as toughness (Bauer Reference Bauer2019; Hayes Reference Hayes2011; Lakoff Reference Lakoff2010; Winter Reference Winter2010). Conjoining the trespassing and trait ownership literatures, I predict that voters will favor candidates more when they match the voter's “party style”:
H2: Holding candidate sex constant, Democratic voters will prefer feminine leaders, and Republican voters will prefer masculine leaders.
Given this sort of heterogeneity among respondents, it seems reasonable to ask whether all Democrats or all Republicans are alike in their preferences for femininity. One possibility is raised by the literature on “gender affinity”: some scholarship finds that women have a stronger preference for same-sex representation—that is, female candidates (Sanbonmatsu Reference Sanbonmatsu2002). Others find heterogeneity of women's preferences: one study finds that this preference exists only among women Democrats, while women Republicans exhibit no such affinity for female candidates (Dolan Reference Dolan2008), and another finds that liberal and Democratic women voters prefer female candidates, but conservative and Republican women voters do not (McDermott Reference McDermott1997). While this literature focuses on candidate sex, not gender typicality, we might imagine a similar “gender style” affinity, or gender trait ownership to use the language of Winter (Reference Winter2010), might exist for candidates’ leadership styles. That is,
H3: Within each party and holding candidate sex constant, women voters will more strongly prefer feminine leaders, and male voters will prefer masculine leaders.
A final possibility is raised by the literature on “beliefs” stereotyping (Sanbonmatsu Reference Sanbonmatsu2002, 21), which finds that voters assume female candidates are more liberal than their male colleagues, even when their voting records demonstrate otherwise (Koch Reference Koch2000, Reference Koch2002); this suggests that liberal voters prefer women because they assume female candidates are more liberal (McDermott Reference McDermott1998). Yet it remains unclear whether liberals “like” women only because they guess women are more liberal (i.e., a beliefs stereotype),Footnote 2 or because voters want their politicians to behave and solve problems—lead—the way they believe women behave (a traits stereotype). Candidates’ traits may matter for politics even after accounting for their issue positions: male politicians have a more “combative” style and interrupt more during deliberations (Karpowitz, Mendelberg, and Mattioli Reference Karpowitz, Mendelberg and Mattioli2015; Karpowitz, Mendelberg, and Shaker Reference Karpowitz, Mendelberg and Shaker2012; Kathlene Reference Kathlene1994), which can result in very different policy outcomes (Karpowitz and Mendelberg Reference Karpowitz and Mendelberg2014).Footnote 3 Nevertheless, no research has sought to distinguish whether liberals might want more collaborative and communal—that is, feminine—leaders while holding leaders’ sex and policy preferences constant. I therefore propose to disentangle the beliefs and traits stereotypes using a final test that incorporates both the importance of voter ideology (not just partisanship) and traits:
H4: Within each party and holding candidate sex constant, liberal voters will more strongly prefer leaders with feminine traits, and conservative voters will prefer masculine traits.
If only beliefs stereotypes are at work, I should see that more liberal voters of all parties prefer female candidates to male candidates but no correlation between liberalism and preference for feminine candidates over masculine candidates. If instead voter ideology also dictates trait preferences—“how” candidates seem to get things done rather than “what” candidates get done—I should see a correlation between gendered leadership style and voter ideology, even holding all else about the candidate (e.g., sex) constant.
EMPIRICAL STRATEGY
I build on the large survey experimental literature using unnamed or hypothetical candidates to study gender stereotyping (Bauer Reference Bauer2015a, Reference Bauer2018; Brooks Reference Brooks2011, Reference Brooks2013; Ditonto Reference Ditonto2016; Holman, Merolla, and Zeckmeister Reference Holman, Merolla and Zechmeister2016; Krupnikov and Bauer Reference Krupnikov and Bauer2014) by focusing the present study on nine nationally known politicians during the height of the 2016 U.S. presidential election campaign.
I take this new approach for two reasons. First, political psychologists studying gender have already amassed extensive experimental evidence that gender shapes evaluation of unknown candidates. These studies employ fictional or unnamed candidates since stereotyping theory suggests that stereotypes are most likely to be activated when respondents know little about the people they are evaluating (Bauer Reference Bauer2014, 25–26). However, this means we know little about how these treatment effects might generalize to real candidates (Andersen and Ditonto Reference Andersen and Ditonto2018; Banwart Reference Banwart2010; Barabas and Jerit Reference Barabas and Jerit2010; Dolan and Lynch Reference Dolan and Lynch2015; Gaines, Kuklinski, and Quirk Reference Gaines, Kuklinski and Quirk2007). To my knowledge, three studies evaluate reactions to real, national-level politicians using survey experiments, and they seem to suggest that stereotypes applied to hypothetical candidates also apply to real candidates (Burns, Eberhardt, and Merolla Reference Burns, Eberhardt and Merolla2013; Cassese and Holman Reference Cassese and Holman2019; Holman, Merolla, and Zeckmeister Reference Holman, Merolla and Zechmeister2011).Footnote 4 However, between them, these studies examine reactions to only four candidates: Sarah Palin (Burns, Eberhardt, and Merolla Reference Burns, Eberhardt and Merolla2013), Hillary Clinton and Condoleezza Rice (Holman, Merolla, and Zeckmeister Reference Holman, Merolla and Zechmeister2011), and Hillary Clinton and Donald Trump (Cassese and Holman Reference Cassese and Holman2019). Studies of more candidates at a time can thus offer some insights into how candidate-specific such effects may be.Footnote 5 Experimentally, there are also benefits to using multiple realizations of an independent variable (e.g., multiple women candidates, rather than a single woman candidate), as it enables us to observe how much effects might vary even among members of the same group.Footnote 6
Second, and perhaps more obvious, the 2016 presidential election offered an unprecedented opportunity to study voter reactions to real variation in candidate sex and gendered messaging during a heavily scrutinized race. In conducting these studies during 2016—an election that included an unprecedented emphasis on the symbolism of “breaking the glass ceiling”—I necessarily make the trade-off that what I find may not translate to other campaigns and contexts. For instance, campaigns that feature two male candidates may emphasize very different messages about gender than ones between a man and a woman, or between two women. That said, careful case studies of elections, such as Cassese and Holman's (Reference Cassese and Holman2019) study of voter backlash against Hillary Clinton, help us better understand when and how stereotyping might play a role in real campaigns (Dolan Reference Dolan2014).
Sample
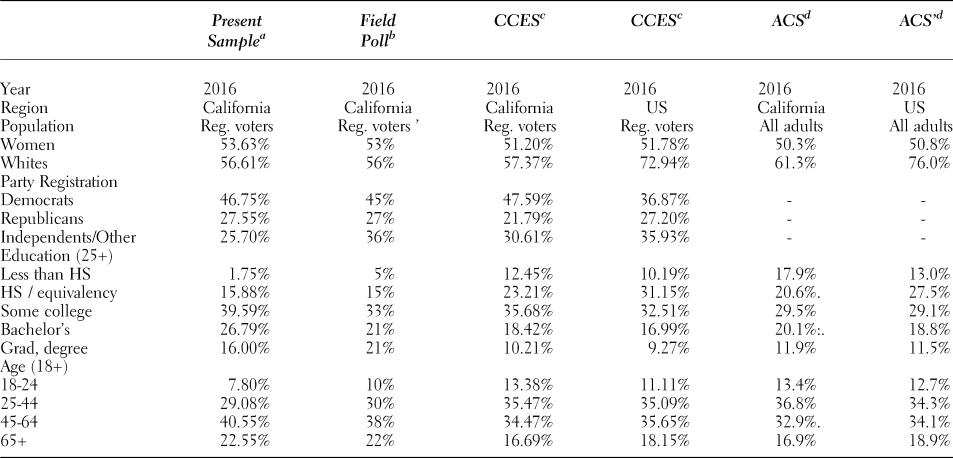
I test these hypotheses in two survey experiments conducted in September and October 2016. Samples for both studies were recruited through YouGov to be a sample of 1,800 registered California voters (3,600 total) as part of a series of collaborative Field Poll–Institute for Governmental Studies surveys leading up to the November election.Footnote 7 The studies were heavily focused on California politics and issue attitudes, including referenda. Respondents were recruited to be representative of the overall California population of registered voters on partisanship, gender, age, and education. (The sample recruitment team also attempted to oversample Latinx and Asian American voters, who have historically been underrepresented in the survey literature.) Table 1 presents demographic breakdowns for the overall sample, and compares them to other representative and national samples. The California sample is broadly comparable to national samples in terms of gender, age, and education, but it is more liberal and less white (though not disproportionately so for California).
Sample Characteristics

a Unweighted, both samples combined.
b Weighted, all data obtained via Field Poll (2016), cxcept for party registration, obtained from the California Secretary of State's website. These and following data sources listed in references.
c Weighted, authors’ calculations, data obtained from the 2016 CCES (Harvard Dataverse).
d All ACS data obtained from the Census FactFindcr database.
California represents an interesting and perhaps challenging test for a study on gender stereotyping. On the one hand, one may well be concerned that California is an unusual state in terms of its demographics (less white) and politics (more liberal and Democratic). That could mean that any study conducted on such a sample, even if large and representative of California's population, may not generalize well. I offer three responses to this concern. First, to the extent that self-identifying Republicans or conservatives in the California context may be more socially liberal or less religious than they would be in other states, I might expect them to have weaker preferences for masculinity than other literature might suggest—biasing us toward a null or even pro-feminine estimate. While the main results throughout the paper use unweighted data, analyses weighted to look like U.S. registered voters as a whole can also be found in Appendix I and show substantively similar results.
Second, California is the most populous state in the nation: its nearly 40 million inhabitants represent over 12% of the U.S. population.Footnote 8 Moreover, the national population is becoming more ethnically diverse, more liberal, and more Democratic—in other words, more like the California of today (Pew Research Center 2018). I believe it is useful to understand attitudes as they exist in such a large chunk of the electorate, and anticipate that the results will continue to be relevant in years to come.
Third, a growing literature suggests that many findings first documented in convenience samples—let alone large samples of registered voters—replicate well with nationally representative samples (Mullinix et al. Reference Mullinix, Leeper, Druckman and Freese2015), including when heterogeneous treatment effects are anticipated (Coppock, Leeper, and Mullinix Reference Coppock, Leeper and Mullinix2018).
Design and Methods
Respondents took an approximately 15-minute online survey that focused heavily on California politics and policy, particularly related to the November ballot initiatives. Voters were also asked about their expected vote in the forthcoming presidential election. The questions for each study were interspersed with approximately 45 other questions throughout.Footnote 9
In both studies, respondents see a message describing a single candidate as possessing a particular leadership style; both the candidate and style are randomly assigned.Footnote 10 The feminine treatment is designed to evoke a communal leadership style; the masculine treatment, an agentic leadership style. Treatments were designed using the list of adjectives in the Bem Sex Role Inventory (BSRI) (Bem Reference Bem1981), but, given the constraints of using real politicians, had to plausibly describe every candidate (e.g., both Hillary Clinton and Donald Trump). The treatment conditions and differences between the two studies are described in detail later.
After the politician's leadership style is described to them, respondents are immediately asked “Do you think that sort of leadership style is what America needs right now?” and asked to indicate on a 5-point Likert scale how strongly they agree or disagree. The question emphasizes evaluations of the gendered leadership style for two reasons. First, using real, nationally known candidates means that voters arrive with preexisting opinions of and attitudes toward candidates. I thought it was likely that I would encounter ceiling effects (e.g., Republicans’ evaluations of Clinton would be extremely negative, no matter the gendered leadership style condition) if I simply asked for a holistic evaluation of the candidate. Second, by running these studies in the last few weeks before the election, voters’ opinions of the candidates should be especially hard to shift: certainly compared to hypothetical candidates, but even compared to evaluations of the same candidates several months earlier. Taken together, I thought a more holistic candidate evaluation measure might cause existing attitudes to overwhelm a subtle manipulation. In short, although the dependent variable measure asks respondents to evaluate gendered leadership styles, in studying real candidates, and especially in the context of the height of the 2016 election season, I expect it contains preexisting opinions and attitudes toward the candidates, too.
I calculate differences in means (e.g., between conditions, or between parties) using Welch's t-tests, and all p-values reported are two-tailed.Footnote 11 I calculate relationships between two continuous variables (e.g., for the manipulation check) using simple ordinary least squares (OLS) regressions; all p-values reported are again two-tailed.
Study 1
In the September experiment, Hillary Clinton was the only candidate respondents saw. Respondents in the feminine condition saw a message reading, “Hillary Clinton is said to have a distinctive leadership style. She believes that [listening to and working with others] is more important than [taking a stand and sticking with it].” In the masculine condition, the descriptions were swapped, such that “She believes that [taking a stand and sticking with it] is more important than [listening to and working with others].”
A separate set of respondents were asked a “content check” question—whether they thought the masculine leadership style was more common among men, or whether the feminine style was more common among women, using a 5-point scale—to establish that the treatment did indeed evoke perceptions of gender-typical leadership styles. This “content check” might be considered a pre-test—do voters perceive these treatments to be consistent with common gender stereotypes?—were it not for the fact that it was conducted during the study on a separate sample of respondents, rather than in an earlier study. In all, 600 respondents saw the feminine condition, 600 saw the masculine condition, and 600 received the content check.
Study 2
In the October experiment, one of nine national-level politicians—Hillary Clinton, Elizabeth Warren, Jill Stein, Barack Obama, Joe Biden, Bernie Sanders, Tim Kaine, Mike Pence, and Donald Trump—was randomly presented to respondents. I chose these candidates either because they currently held a national office (Biden and Obama), because they were running for a national office (Clinton, Kaine, Pence, Sanders, Stein, Trump), or, in the case of Elizabeth Warren, because she was a sufficiently well-known senator and a woman expected to be a presidential contender in 2020. Studying more politicians than Study 1 thus enabled us to dig more deeply into the relationship between candidate heterogeneity (by sex, partisanship, and ideology) and respondent heterogeneity (by the same factors).
I also varied the wording of the treatment by using different adjectives from the BSRI to demonstrate conceptual replication, not just technical replication. A respondent assigned to see Elizabeth Warren in the feminine condition, for instance, would have seen the following: “[Democratic Senator Elizabeth Warren] is said to have a distinctive leadership style. She believes that [being compassionate and working with others] is more important than [being assertive and aggressively pursuing goals]. Do you think that sort of leadership style is what America needs right now?” The masculine condition, like in Study 1, swapped the positioning of the masculine and feminine leadership descriptions. The dependent variable again measured respondents’ agreement or disagreement that America needs this sort of leadership using a 5-point Likert scale.
Study 2 also added a direct manipulation check several questions later, which asked the respondent whether they thought the candidate had an agentic style or a communal style. In the Elizabeth Warren example, respondents would have seen the question, “When faced with a tough decision, do you think that Elizabeth Warren is more likely to listen to others’ advice, or to make the decision on her own?,” with a 5-point response scale. Approximately 200 people evaluated each candidate (about 100 in each condition) and answered the manipulation check a few questions later about the same candidate. Several questions after the manipulation check, Study 2 also asked all 1,800 respondents the same content check question (“is [the treatment style previously seen] more common among men or women?”) to ensure that the new question wording conceptually replicated the first study's manipulation of gender-typical leadership styles. Finally, respondents were also asked a question about their political ideology on a 5-point scale, very liberal to very conservative.
RESULTS
Do messages that describe candidates as stereotypically masculine or feminine leaders influence voter attitudes? If so, among what sorts of voters? I first present evidence that the treatment manipulated perceptions of gender typicality. I then present results for each hypothesis. In the text, I present results aggregated across groups of candidates (e.g., comparing male candidates to female candidates), as my focus is the broader implications for candidate gender rather than supplying nine case studies. I provide table versions of all t-test results in the supplementary materials, which also provide analyses disaggregated by candidate (see Appendix B).
Manipulation Check: Did Voters Believe Feminine Candidates Behave Differently?
The manipulation check in Study 2 found that for eight of the nine candidates, respondents who saw a feminine condition were more likely to believe that the candidate would make tough decisions by listening to others, confirming that they saw the feminine candidates as more communal than agentic (b = .330, two-tailed p-value < .001; details in Table S3). However, the manipulation check failed for one candidate, Donald Trump. Given the timing of Study 2, this may be unsurprising: Trump was in the news for an audiotape in which he made lewd comments about women, and several news outlets had recently featured articles suggesting that he was not prone to taking advice from his staff. It thus seems plausible to imagine that many voters resisted the feminine condition Trump treatment. The overall findings hold whether respondents who viewed the feminine style Trump condition are included or excluded, and whether all respondents who failed the manipulation check are included or not. Therefore, I include data from all respondents in the results.
The content check (akin to a pre-test) also suggests that the treatment conditions corresponded with voters’ perceptions of leadership styles generally common among men (or women). In Study 1, 600 respondents who received only the content check reported that they believed the masculine leadership style to be more common among men and by extension, the feminine style among women (b = 0.825, p < .001; details in Table S4). In Study 2, all respondents were asked about the typicality of the leadership style they saw (feminine or masculine) among men and women. Respondents again felt that the masculine style was more common among men (b = 0.961, p < .001; details in Table S5). Table S6 shows that this is true even among respondents assigned to see counter-stereotypical candidates. The size of the effects (about 1 point on the 5-point scale) suggests that the treatment successfully manipulates gendered leadership styles.
Does Adopting a Masculine Style Benefit Politicians?
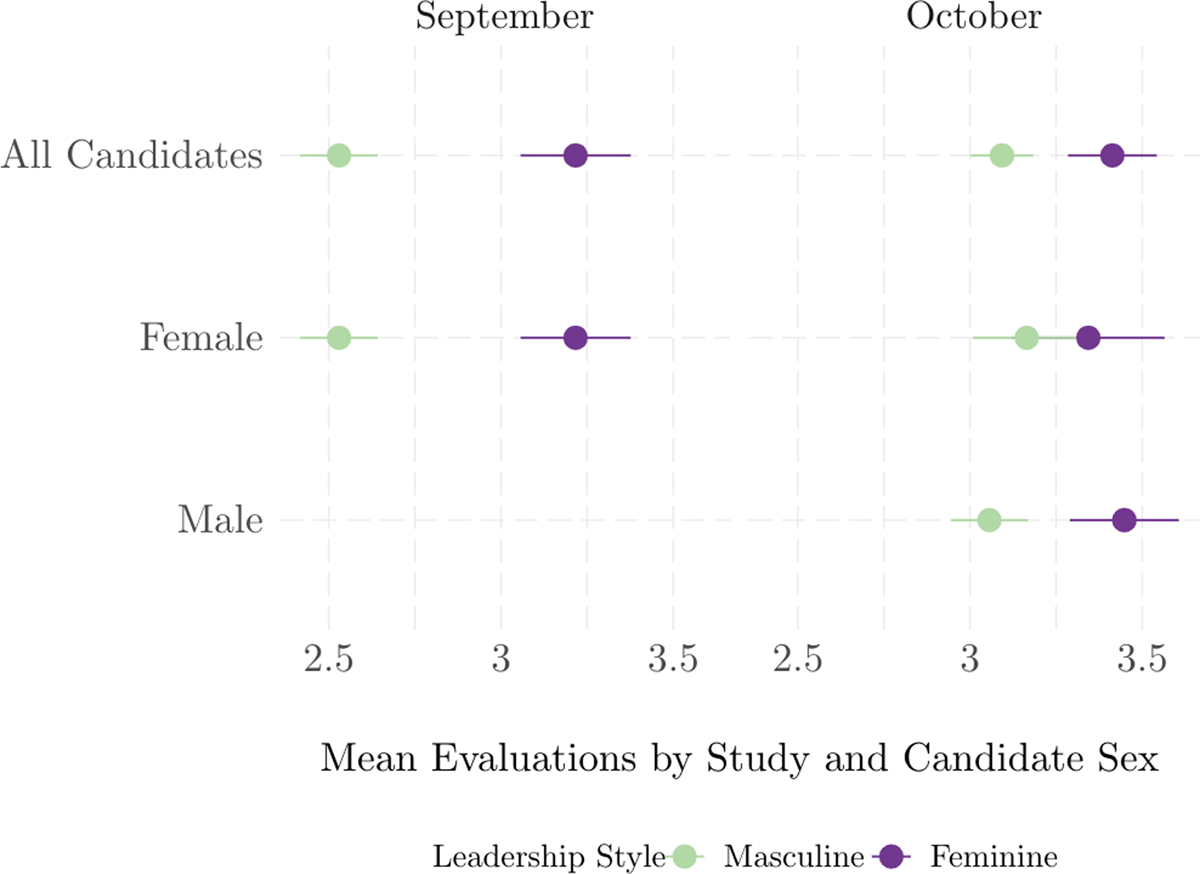
I do not find support for either part of H1, which predicted that voters would evaluate masculine candidates more positively, albeit less positively for female candidates than for male candidates. Rather than significantly preferring masculine leaders, in both Study 1 and Study 2, I see an aggregate preference for a feminine leadership style, depicted in Figure 1 (details in Table S7). The absolute difference of means (given as M-F) is bigger in September (M-F = –0.69, two-tailed p-value < .001) than in October (M-F = –0.39, p < .001 for male candidates, M-F = –0.18, p = .115 for female candidates).
Voters Prefer Feminine Leadership Styles.
Figure shows mean agreement that the country needs this sort of leadership style, with 95% confidence intervals. Table S7 displays the t-test results depicted above.

Moreover, there is no real evidence of a bigger benefit (or penalty) for masculine men relative to masculine women. First, in Study 2, the estimated ratings of masculine men are not significantly different from those for masculine women; the same is true for feminine men and women. Second, comparing female candidates in both conditions, there is no consistent evidence that voters penalize women more harshly for being feminine than they do men. While in September, Hillary Clinton is hurt when voters believe she has a masculine leadership style—her absolute ratings drop below “neither agree nor disagree” into disagreement that her leadership style is a good fit for the country—the same is not true in October.Footnote 12 Feminine female candidates in Study 2 were viewed marginally more favorably than masculine female candidates, but the difference is not statistically significant (p = .114). For all other conditions, a feminine leadership style is always significantly preferred (all ps < .001), contrary to the predictions of existing literature.
Why might this be? Some scholarship suggests that voters favor male or masculine candidates during times of crisis, such as war (Lawless Reference Lawless2004) or when the threat of terrorism is high (Holman, Merolla, and Zeckmeister Reference Holman, Merolla and Zechmeister2016); one might imagine, then, that there could be a “peace dividend” that favors female or stereotypically feminine candidates (though this is not what Holman, Merolla, and Zeckmeister find). Yet in 2016, the United States was at war, and many commentators at the time felt that the perceived risk of terrorist threat might give Donald Trump the election (Prokop Reference Prokop2016). These contextual characteristics would not predispose my study to find an aggregate preference for femininity. On the other hand, I cannot rule out that the symbolism of breaking the “glass ceiling” might have shifted voters toward feminine leadership styles; even accounting for these external threats, my estimates might thus represent a “high-water mark” for pro-feminine attitudes. Looking beyond the unique context, the literature predisposes us to think that one critical explanation lies in the characteristics of the respondents—particularly, the Democratic- and liberal-leaning sample—so I examine this possibility in the subsequent sections. In the discussion, however, I return to the possibility that other factors are at play: the unique campaign context in 2016, and the possibility of over-time trends toward pro-femininity in the electorate.
Does Partisanship Dictate What Type of Leader Voters Prefer?
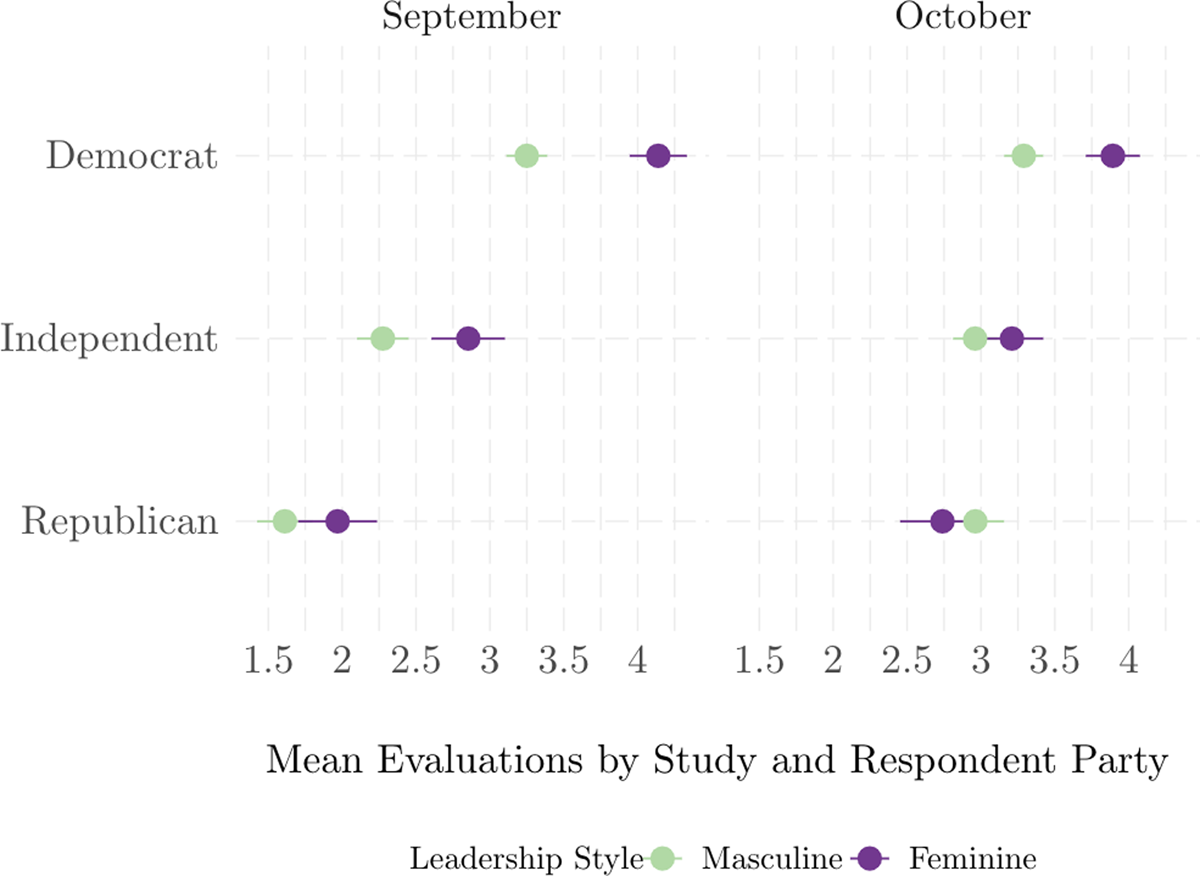
Drawing on the trait ownership and trespassing literatures, H2 suggested that Democrats would evaluate leaders with more feminine leadership styles more positively, while Republicans would assess masculine leaders more positively. As Figure 2 illustrates (regression in Table S8), I find strong support in both studies for the claim that Democrats prefer femininity. In September, the difference of means (denoted as M-F) is –0.89; in October, it is –0.60 (both two-tailed ps < .001). In both studies, independents significantly prefer feminine leadership (September: M-F = –0.58, p < .001; October: M-F = –0.25, p = .021), but the relationship is weaker than it is for Democrats, particularly in October. However, Republicans do not prefer the masculine leadership style as strongly as prior literature might have predicted. While Republicans favor masculine styles over feminine ones in the October study (M-F = 0.22), the difference is not significant at or below the 0.05 level in either study. This is consistent with the argument presented in the Sample section that California Republicans might be more liberal in their gender attitudes. Overall, with the possible exception of Republicans, we see evidence that respondents do evaluate the same candidates more positively when they exhibit traits “owned” by the party (Winter Reference Winter2010)—that is, in the “party style.”
Democrats Strongly Favor Femininity; Independents and Republicans, Less So.
Figure shows mean agreement that the country needs this sort of leadership style, with 95% confidence intervals. Table S8 displays the t-test results depicted above.

I also find little evidence that voters evaluate these gendered styles differently for co-partisans than for out-partisans (see Table S9 for details). For Democratic voters (n = 1,261), there is no evidence that a feminine leadership style is more (or less) attractive when evaluating Democratic or Republican candidates. In Study 2, independent voters (n = 1,117) exhibit a substantively small interaction effect: they find masculine Democratic candidates more appealing than masculine Republican candidates (M-F = –0.09, p = .038), but when they evaluate feminine candidates, they exhibit no preference between the two parties. Only a few Republican voters evaluated Republican candidates (77 out of the 656 total Republicans), so my confidence in the differences between evaluations of co-partisans and out-partisans must be appropriately low, but no significant relationship between femininity (or masculinity) and candidate co-partisanship is visible.
Do Respondents Exhibit a “Gender Affinity” for Leadership Styles?
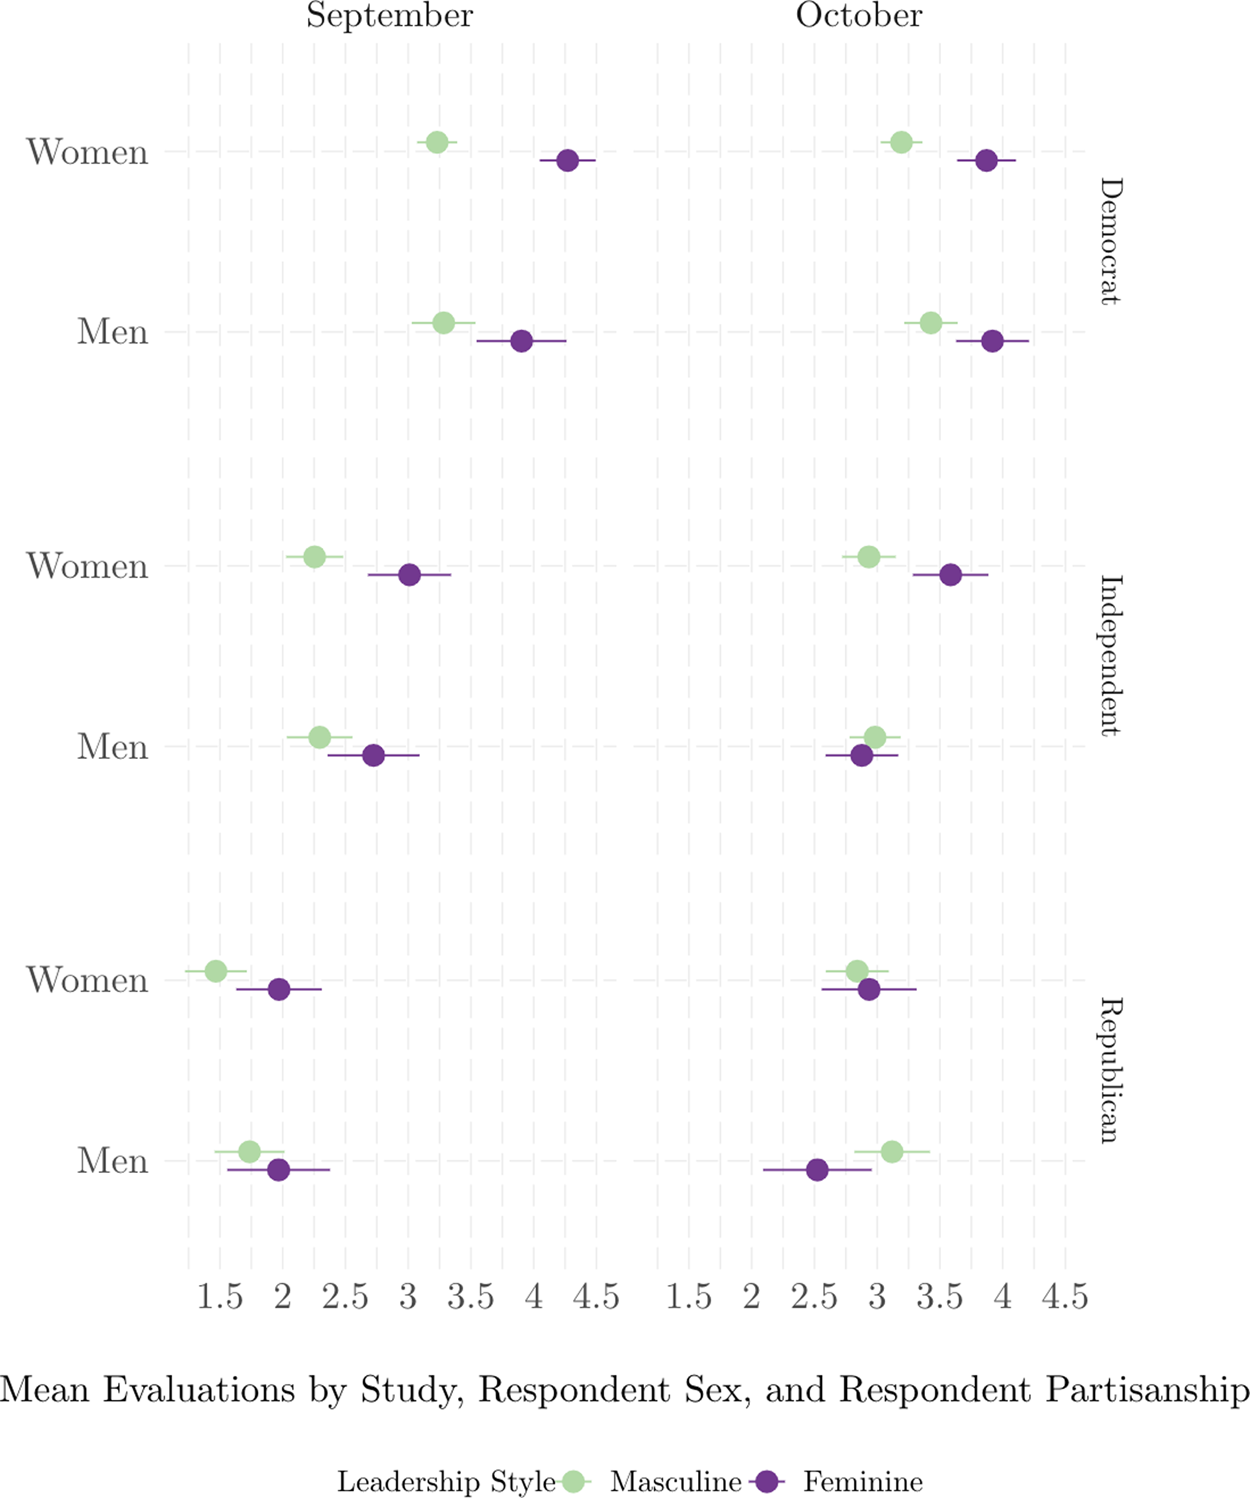
H3 predicted—conditional on respondent partisanship, given H2—that women voters would prefer a feminine leadership style and men, a masculine style. Figure 3 displays strong evidence of the former but mixed evidence for the latter (details available in Table S10).
Women Consistently Favor Femininity Regardless of Partisanship.
Figure shows mean agreement that the country needs this sort of leadership style, with 95% confidence intervals. Table SlO displays the t-test results depicted above.

Women voters consistently and strongly prefer feminine styles: in September, estimates of the difference in means (M-F) range from –1.04 (Democrats) to –0.50 (Republicans), and in October, they range from –0.68 for Democrats to –0.09 for Republicans (all two-tailed p-values < .001, except for Republican women in Study 2, who had no significant preference). We can thus see that women have a distinctive affinity for a stereotypically feminine “gender style.”
However, men voters had more complicated preferences. Democratic men preferred feminine styles in both studies (M-F = –0.62 in September and –0.49 in October, both ps = .001). Male independents preferred feminine styles in Study 1 (M-F = –0.43, p = .022) but exhibited no preference in Study 2. In contrast, Republican men displayed no preference between feminine and masculine styles in Study 1—but did show a strong preference for masculinity in Study 2 (M-F = 0.60, p = .008). Taken altogether, men do not exhibit the same “gender affinity” in terms of leadership style that women do, but instead appear to have preferences more consistent with the stereotypes of their party than their gender.
In sum, for women, “gender (style) affinity” overrides “party style.” Women feel much more strongly positive toward candidates who display traits typical of women than those who display traits typical of men regardless of party. For men, party style overrides gender style: partisanship predicts which traits men preferred. Note however that there is no evidence of a direct gender affinity effect for women (i.e., “women supporting women”); men, on the other hand, do prefer male candidates to female candidates (see Table S11 for details).
Does Ideology Dictate Trait Preferences?
H4 questioned the account of the literature on beliefs stereotypes, which argues that liberals only prefer female candidates because they assume such candidates hold more ideologically liberal beliefs; I suggested instead that as voters became more liberal, they would prefer candidates already known to be liberal or conservative with feminine traits more (and masculine traits less). I tested this proposition by studying real candidates—which fixes their sex, partisanship, and most critically, beliefs—but varying their leadership traits. If beliefs stereotypes are all that motivate liberal (or conservative) voters to prefer women (or men), then I should not see a correlation between respondent ideology and gendered trait manipulations for each candidate after accounting for partisanship; instead, I should see more liberal voters expressing more positive assessments of all female candidates than of all male candidates.Footnote 13 In fact, after accounting for the party identification of the candidates, differences in average support for female candidates versus male candidates by respondent ideology are slight (see Appendix B).
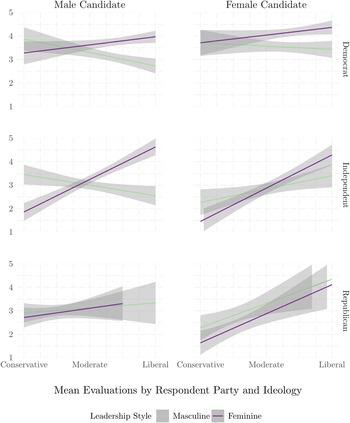
Using a simple OLS regression of evaluation on respondent ideology (details in Table S13), I show in Figure 4 that as Democrats identify as more liberal, they favor candidates with feminine traits more (b = 0.69, two-tailed p-value = .041 for male candidates; b = 0.65, p = .089 for female candidates), and masculine traits less (b = –1.14, p = .002 for male candidates; b = –0.28, p = .496 for female candidates). Independents follow the same pattern when assessing male candidates (b = –0.90, p = .018 for masculine candidates; b = 2.77, p < .001 for feminine candidates), but when they assess female candidates, independents feel more favorable as they identify as more liberal regardless of the leadership style of the candidate (b = 1.14 for masculine women and b = 2.84 for feminine women, both ps < .001). Finally, even as Republican voters identify as more liberal, they exhibit no difference in preferences between masculine and feminine traits, for either male or female candidates. An aggregate analysis can be seen in Table S12.
As Voters Get More Liberal, They Favor Femininity More and Masculinity Less—But The Effects Are Moderated by Partisanship.
Figure shows predicted agreement that the country needs this sort of leadership style using an OLS regression and LOESS smoothing. Data on ideology was only collected in Study 2. Table S13 displays the t-test results depicted above.

Why do independents seem to have trait preferences for male candidates but not for female candidates? One possibility is that there are simply fewer realizations of female candidates (three) than male candidates (six) in the data, reducing my ability to see an effect. Another is that liberal independents may feel more pressured to evaluate female candidates positively regardless of their style—a form of social desirability bias. Such social pressure might have been unusually strong in the context of California, which in 2016 had a number of women running for state-level offices (e.g., the senate race between Kamala Harris and Loretta Sanchez), or in the context of 2016 nationally, where there was such an emphasis on the symbolism of breaking the glass ceiling.
Republican voters also follow this pattern, albeit with bigger confidence intervals since there are fewer of them (n = 656) in the data set.Footnote 14 Like independents, as Republicans identify as more liberal, they may also feel more intense social pressure to sound approving of female candidates, though I can speak only about the overall association since there are too few liberal Republicans in the data set to speak about them as a unique subgroup. Another possible explanation is that there may be a ceiling on conservative Republicans’ willingness to express approval of a group of liberal candidates (e.g., Elizabeth Warren and Jill Stein) regardless of their leadership style; this would imply that the observed relationship is driven by steady out-group derogation rather than context-sensitive social pressure. However, ceiling effects do not seem to be an equally likely explanation for independents, who exhibit the same pattern of preferences when evaluating female candidates.
In sum, for Democrats, respondent ideology is tightly intertwined with preferences for candidates with particular leadership traits. For independents, ideology is less intertwined with trait preferences when evaluating female candidates (or more, if one thinks of social desirability bias as reflecting adherence to a political ideology). For Republicans, ideology and leadership trait preferences do not appear to be intertwined with candidate sex at all. Although my attempt to distinguish trait and belief stereotypes as a source of voter preferences is necessarily exploratory, it holds some important lessons for those interested in understanding how voters evaluate candidates. In particular, it suggests that “how” candidates conduct themselves, not just “what” they support, could shape the bases of different candidates of the same party, even among those who hold very similar issue positions. I return to this possibility, and its implications for primaries in particular, in the conclusion.
Gendered Leadership Styles and the 2016 Presidential Election
The reality of collecting data before the 2016 presidential election rather than after is that I have no good measures of respondents’ actual votes. However, I do have a pre-treatment measure of their planned vote in November. I can thus explore whether the effects of the treatment are greatest among decided or undecided voters, and within decided voters, whether those planning to vote for certain candidates (e.g., Hillary Clinton) were more responsive to the treatment. In this section, I explore descriptively whether an individual who plans to vote for a woman is more likely to think that a feminine leadership style is what the country needs. Earlier, I assessed whether one's planned November vote correlates with one's response to treatment, with an eye to providing context for what future studies—particularly field experiments and campaign efforts focused on persuasion—might expect in terms of real-world responses.
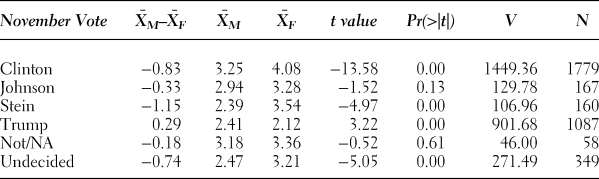
Table 2 suggests that candidates’ bases vary strongly in the strength of their preferences over leadership styles. I see that Clinton voters (n = 1,779) felt much more favorable toward candidates when they were depicted as typically feminine (M-F = –0.83, two-tailed p-value < .001). Trump voters (n = 1,087), in contrast, preferred masculine candidates (M-F = 0.29, p < .001). Stein voters (n = 160) felt less positive about masculine candidates than Clinton voters did, but they did not demonstrate a strong preference for feminine candidates by comparison. Johnson voters (n = 167) favored candidates somewhat less when they were feminine. Undecided voters (n = 349) also displayed a strong preference for feminine leaders (M-F = –0.74, p < .001). Nonvoters (n = 58) evinced no preference.
Preference for Masculinity by Planned November Vote

These descriptive findings are consistent with previous sections, save for the strength of preference Trump voters evince for masculine candidates. Previously, I found weaker evidence of a Republican preference for masculinity when testing H2, though I did find that as Republican voters became more conservative they favored masculinity more when testing H4. Suggestively, when I look within Trump voters by respondent partisanship, I find that independent voters who said they would vote for Trump strongly preferred the masculine versions of the candidates (M-F = 0.29, p = .008; details in Table S14), as do Republicans.
CONCLUSIONS
This article has explored the relationship between candidates’ leadership traits and gender, partisanship, and ideology during one of the most dramatically gendered campaigns in modern history—the 2016 U.S. presidential election. Relying on the relevant literatures, I crafted two closely related survey experiments, run during the final weeks of the campaign, that attempted to manipulate evaluations of a national candidate through messages evoking stereotypically masculine or feminine traits. Checks of the treatments confirmed that respondents perceived these styles of leadership as more common among men and women, respectively, and that the effects of the treatment could be seen in their answers to a later question about how they expected candidates to behave when faced with a tough decision. Based on the literature, I anticipated masculine leadership styles being more popular with voters, particularly for male candidates (H1). However, I anticipated that certain subgroups, such as Democrats (H2), women (H3), and liberals (H4) would favor the same candidate more when they were described with a stereotypically feminine leadership style.
I find strong evidence that messages about candidates’ gendered leadership styles shape voters’ attitudes, even when evaluating well-known national candidates late in an election season. However, voters exhibit a marked preference for feminine leadership styles that seems to contradict H1 and one variant of the notorious “double bind:” the notion that women have to adopt masculine behaviors to be taken seriously as leaders. As predicted, I find strong heterogeneity in the sorts of voters who find feminine styles appealing, supporting H2, H3, and H4. I find that Democrats, women, and liberals favor feminine styles, and that these effects generally hold even when I further subset the analyses. Moreover, women Republicans and independents’ attitudes toward femininity looked much more like women Democrats’ attitudes—a “gender style”—than the attitudes of co-partisan men voters, who tend to favor their “party's style.” Finally, I found that voters planning to support female candidates in November 2016 (Hillary Clinton and Jill Stein) were more enthused about a candidate when he or she was depicted as feminine, while those planning to support male candidates (especially Donald Trump) often preferred masculine candidates.
By looking at assessments of the candidates within these subgroups, I add new evidence that voters’ preferences are not driven solely by their assumptions that female candidates will be more liberal (“beliefs stereotypes”). Rather, as voters become more liberal, even conditional on their partisanship and holding constant candidate sex, they evince stronger preferences for a collaborative and communal style of politics. We can therefore see that multiple mechanisms underlie voters’ reactions to candidates’ gendered leadership styles: partisans also care about how politics is conducted, not just substantive policy differences between the candidates. This has potential implications for the support of candidates within the same party, even among those who hold similar beliefs. As primary voters tend to select more ideologically extreme candidates (Brady, Han, and Pope Reference Brady, Han and Pope2007), so, too, might they select candidates with more masculine (if a conservative electorate) or feminine (if a liberal electorate) leadership styles. Over time, primary selection of stereotypically masculine or feminine candidates could lead to the homogenous “party images” of masculine Republicans and feminine Democrats that Winter (Reference Winter2010) finds—not because all Republicans are masculine or Democrats feminine, but because the candidates who appeal (consciously or unconsciously) to ideologically extreme voters’ preferences for masculine or feminine types might be the most likely to make it to the general elections. Future research should seek to disentangle beliefs and traits stereotypes further, perhaps by manipulating both types of stereotype rather than just one set alone, and especially in the context of primary elections. Indeed, I argue preferences for gendered traits and voters’ ideological leanings were often confounded in prior studies, perhaps explaining why some studies find trait stereotypes important (Kahn Reference Kahn1996; Sanbonmatsu Reference Sanbonmatsu2002), and others have not (Dolan Reference Dolan2010; Lawless Reference Lawless2004).
As with any project, this particular set of studies comes with caveats about generalizability. Generalizing to female Republican candidates is one such challenge. Since no Republican women were running for national office in the United States at the time, I cannot speak to which leadership style would be most advantageous for Republican women. However, the findings about conservative Republicans’ and independents' preferences for masculinity are suggestive in light of the fact that female Republican candidates have struggled to make electoral inroads the way female Democratic candidates have. New scholarship has begun to break ground on this front, and suggests that Republican women do feel “cross-pressured” to present with a masculine leadership style (Bauer Reference Bauer2018; Gimenez et al. Reference Gimenez, Karpowitz, Quin Monson and Preece2016; Och and Shames Reference Och and Shames2018). Likewise, a broad literature on women's political ambition suggests that many women feel they are not a good fit for politics, discouraging them from running (e.g., Bernhard et al. Reference Bernhard, Shames, Silberman, Teele, Shames, Bernhard, Holman and Teele2020). Importantly, a recent experiment finds that some women's ambitions are influenced by their perception of the gender gap as stemming from demand-side (e.g., voter) discrimination rather than supply-side constraints (Holman and Schneider Reference Holman and Schneider2016). Sharing information about positive evaluations of candidates with a feminine leadership style could increase these women's ambitions, and it merits further exploration.
While studying real candidates in real elections makes an important contribution to a literature characterized by studies of hypothetical candidates, I necessarily make the trade-off that my estimates reflect specific individuals in a particular context. I have made efforts to study attitudes toward multiple female and male candidates, in multiple parties and roles, and of varying ideologies, in order to attain multiple realizations of my key variables, but these effects are still conditional on this particular set of politicians and moment in history. As the candidate analyses in the appendices show, there is substantial variation in preferences for gendered leadership style even within candidate groups (women, Democrats, etc.). I imagine that the groups I was unable to study in the 2016 presidential election—Republican women, for instance—might exhibit even more fascinating variation. Moreover, work by Bauer (Reference Bauer2013, Reference Bauer2015b) finds that voters are not all equally likely to stereotype, and not all campaigns contain the kind of cues needed to activate gender stereotyping. And though my representative sample of registered California voters offers insight into a large and growing portion of the U.S. electorate, the overrepresentation of liberal ideologies compared to the U.S. population as a whole means that the nation's “median voter,” whoever she may be, is likely to have weaker preferences for femininity and/or stronger preferences for masculinity than the average voter in my sample. Future scholarship on other cases—in other states as well as outside the United States—might offer better insight into the geographic and cultural variation of these preferences.
In keeping with considerations of context, I see two possible explanations for the aggregate preference for feminine leadership beyond sample composition. First, this election represents a historically interesting case as the first general election in the United States featuring both men and women as presidential candidates, and perhaps especially as a campaign which featured a panoply of efforts by both main candidates to make gender a salient consideration (Cassese and Holman Reference Cassese and Holman2019). The potential for a woman to “break the glass ceiling” in 2016 may have moved many voters in a pro-femininity direction compared to previous presidential elections. If true, I might anticipate that the exact same sample of voters would exhibit less pro-feminine attitudes in elections where the glass ceiling is not an important consideration. A second possibility is that American voters’ attitudes have shifted over time in a pro-feminine direction. There is some suggestion of this in Koenig et al.'s (Reference Koenig, Eagly, Mitchell and Ristikari2011) meta-analysis, though the studies included do not examine politics but managers and leaders generally. If true, voters’ attitudes might continue to shift in a pro-feminine direction. Testing either of these possibilities requires over-time data that is beyond the scope of an article on the 2016 election, but would enrich our understanding of how context-sensitive the voter preferences captured here are.
These findings strengthen and build upon previous work in gender and politics (Bauer Reference Bauer2018; Bos, Schneider, and Utz Reference Bos, Schneider, Utz, Travis and White2018) that has questioned the narrative in American politics that growing partisan identification among the public makes candidate sex and gender nearly irrelevant to voters’ decision-making (Hayes Reference Hayes2011). Even if this were true—and I find no evidence that it is—the large effects of the treatments even within co-partisans suggest that such messages could be important during primaries, not just in general elections. And looking beyond election type, it is worth exploring whether these effects are stronger or weaker if it is the candidate, a surrogate (e.g., one's running mate), or a third party (e.g., the media) who makes these claims.
In closing, I argue that partisanship and ideology embeds rather than erases gender from the decision-making process. When Republicans praise President Donald Trump's “broad-shouldered leadership” (Ross Reference Ross2016), or when Governor Arnold Schwarzenegger calls his opponents “girlie-men” (Winter Reference Winter2010, 611), they are drawing upon and reinforcing important linkages between gender, partisanship, and ideology.
SUPPLEMENTARY MATERIAL
To view supplementary material for this article, please visit https://doi.org/10.1017/S1743923X20000276