Introduction
The first observation of superconductivity in oxides was reported by Schooley et al.[Reference Schooley, Hosler and Cohen1] in oxygen-deficient (i.e., reduced) semiconducting SrTiO3−δ. Since then, it is well known that deliberate deviation from stoichiometric compositions in many materials can lead to intriguing physical properties. In this regard, oxides have an additional advantage since their stoichiometry can also be tailored during synthesis, for example, by tuning their oxygen stoichiometry. Among oxides, SrTiO3 is regarded as the workhorse of oxide electronics and optoelectronics, which are most sensitive to oxygen stoichiometry, and have been the subject of theoretical[Reference Mitra, Lin, Robertson and Demkov2] and experimental investigations for the past 50 years. Room temperature photoluminescence,[Reference Kan, Terashima, Kanda, Masuno, Tanaka, Chu, Kan, Ishizumi, Kanemitsu, Shimakawa and Takano3] bistable electrical switching,[Reference Szot, Speier, Bihlmayer and Waser4, Reference Janousch, Meijer, Staub, Delley, Karg and Andreasson5] and optically induced magnetization[Reference Rice, Ambwani, Thompson, Leighton and Crooker6] are few examples of physical properties that have resulted from oxygen non-stoichiometry in SrTiO3−δ. However, the influence of oxygen non-stoichiometry on thermal properties has been overlooked in these oxides. To the best of our knowledge, only a handful of reports on the thermal transport properties of pristine bulk SrTiO3 has been reported.[Reference Yoshida7–Reference Wang, Fujinami, Zhang, Wan, Wang, Ba and Koumoto10] Recently, several groups have investigated the thermal conductivity of SrTiO3 thin films as a function of deposition parameters and temperature (100 < T < 300 K).[Reference Breckenfeld, Wilson, Karthik, Damodaran, Cahill and Martin11–Reference Oh, Ravichandran, Liang, Siemons, Jalan, Brooks, Huijben, Schlom, Stemmer, Martin, Majumdar, Ramesh and Cahill13] Understanding the thermal transport and realizing the means to tune thermal conductivity could significantly improve the thermoelectric (TE) performance of SrTiO3, which is attractive for high-temperature TE applications. The potential of any material for TE applications is gauged by its figure-of-merit, ZT, which is inversely proportional to the total thermal conductivity, κ, and directly proportional to the power factor (α 2σT) where, σ is the electrical conductivity, α is the Seebeck coefficient, and T the absolute temperature. ZT, in essence, is a measure of the competition between electronic transport (i.e., power factor) and thermal transport (i.e., κ) in TE materials. To enhance ZT, several experimental investigations of SrTiO3 have focused on the reduction of κ mainly through lattice distortion, and mass fluctuation scattering mechanisms arising from the single- or double-doping of the Sr2+ and/or Ti4+ sites.[Reference Popuri, Scott, Downie, Hall, Suard, Decourt, Pollet and Bos14–Reference Srivastava, Norman, Azough, Schäfer, Guilmeau and Freer16] Recently we have investigated the role of phonon scattering mechanisms, particularly strain field scattering and mass fluctuation scattering, on the thermal transport in polycrystalline Y-and Yb-doped SrTiO3 ceramics using a modified Callaway's model.[Reference Bhattacharya, Mehdizadeh Dehkordi, Tennakoon, Adebisi, Gladden, Darroudi, Alshareef and Tritt17, Reference Bhattacharya, Dehkordi, Alshareef and Tritt18] We found that the elastic strain field scattering is the dominant mechanism compared to mass fluctuation scattering that led to the lowest possible κ (~4 W/m/K at 300 K) in Y-doped SrTiO3.[Reference Bhattacharya, Mehdizadeh Dehkordi, Tennakoon, Adebisi, Gladden, Darroudi, Alshareef and Tritt17] This study aims to explore whether oxygen non-stoichiometry can lead to additional phonon scattering sites resulting in a lower κ. In addition, it is well known that in polycrystalline materials, grain boundaries strongly impact the electronic and thermal transport properties. For example, spark-plasma sintering (SPS) of powdered TE materials led to robust bulk materials with enhanced TE properties through the formation of interfaces or grain boundaries. Previously, we reported simultaneous enhancement of electronic transport and a reduction of κ in: (i) Pr-doped SrTiO3 where a substantial enhancement of carrier mobility and ZT originated from SPS generated Pr-rich grain-boundaries,[Reference Mehdizadeh Dehkordi, Bhattacharya, Darroudi, Graff, Schwingenschlögl, Alshareef and Tritt19, Reference Dehkordi, Bhattacharya, He, Alshareef and Tritt20] (ii) n-type Bi2Te3 using a novel chemical-exfoliation SPS (CE-SPS) process that led to charged grain boundaries, which increased σ despite the presence of numerous grain boundaries,[Reference Puneet, Podila, Karakaya, Zhu, He, Tritt, Dresselhaus and Rao21, Reference Liu, Hu, Karakaya, Puneet, Rao, Podila, Bhattacharya and Rao22] and (iii) SPS-processed pristine PbTe nanocubes that exhibited a high α due to potential barrier scattering at grain boundaries.[Reference Khasimsaheb, Neeleshwar, Srikanth, Bathula, Gahtori, Srivsatava, Dhar, Sankarakumar, Panigrahi, Bhattacharya, Polida and Rao23] In this study, we utilized SPS to generate interfaces in pristine and non-stoichiometric SrTiO3−δ, and found that oxygen vacancies reduce κ. Thus, this work provides an alternate approach for tuning the thermal properties and ultimately improving the performance of SrTiO3-based TEs.
Experimental
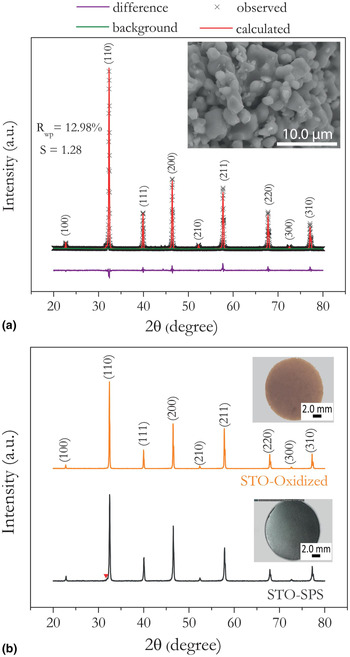
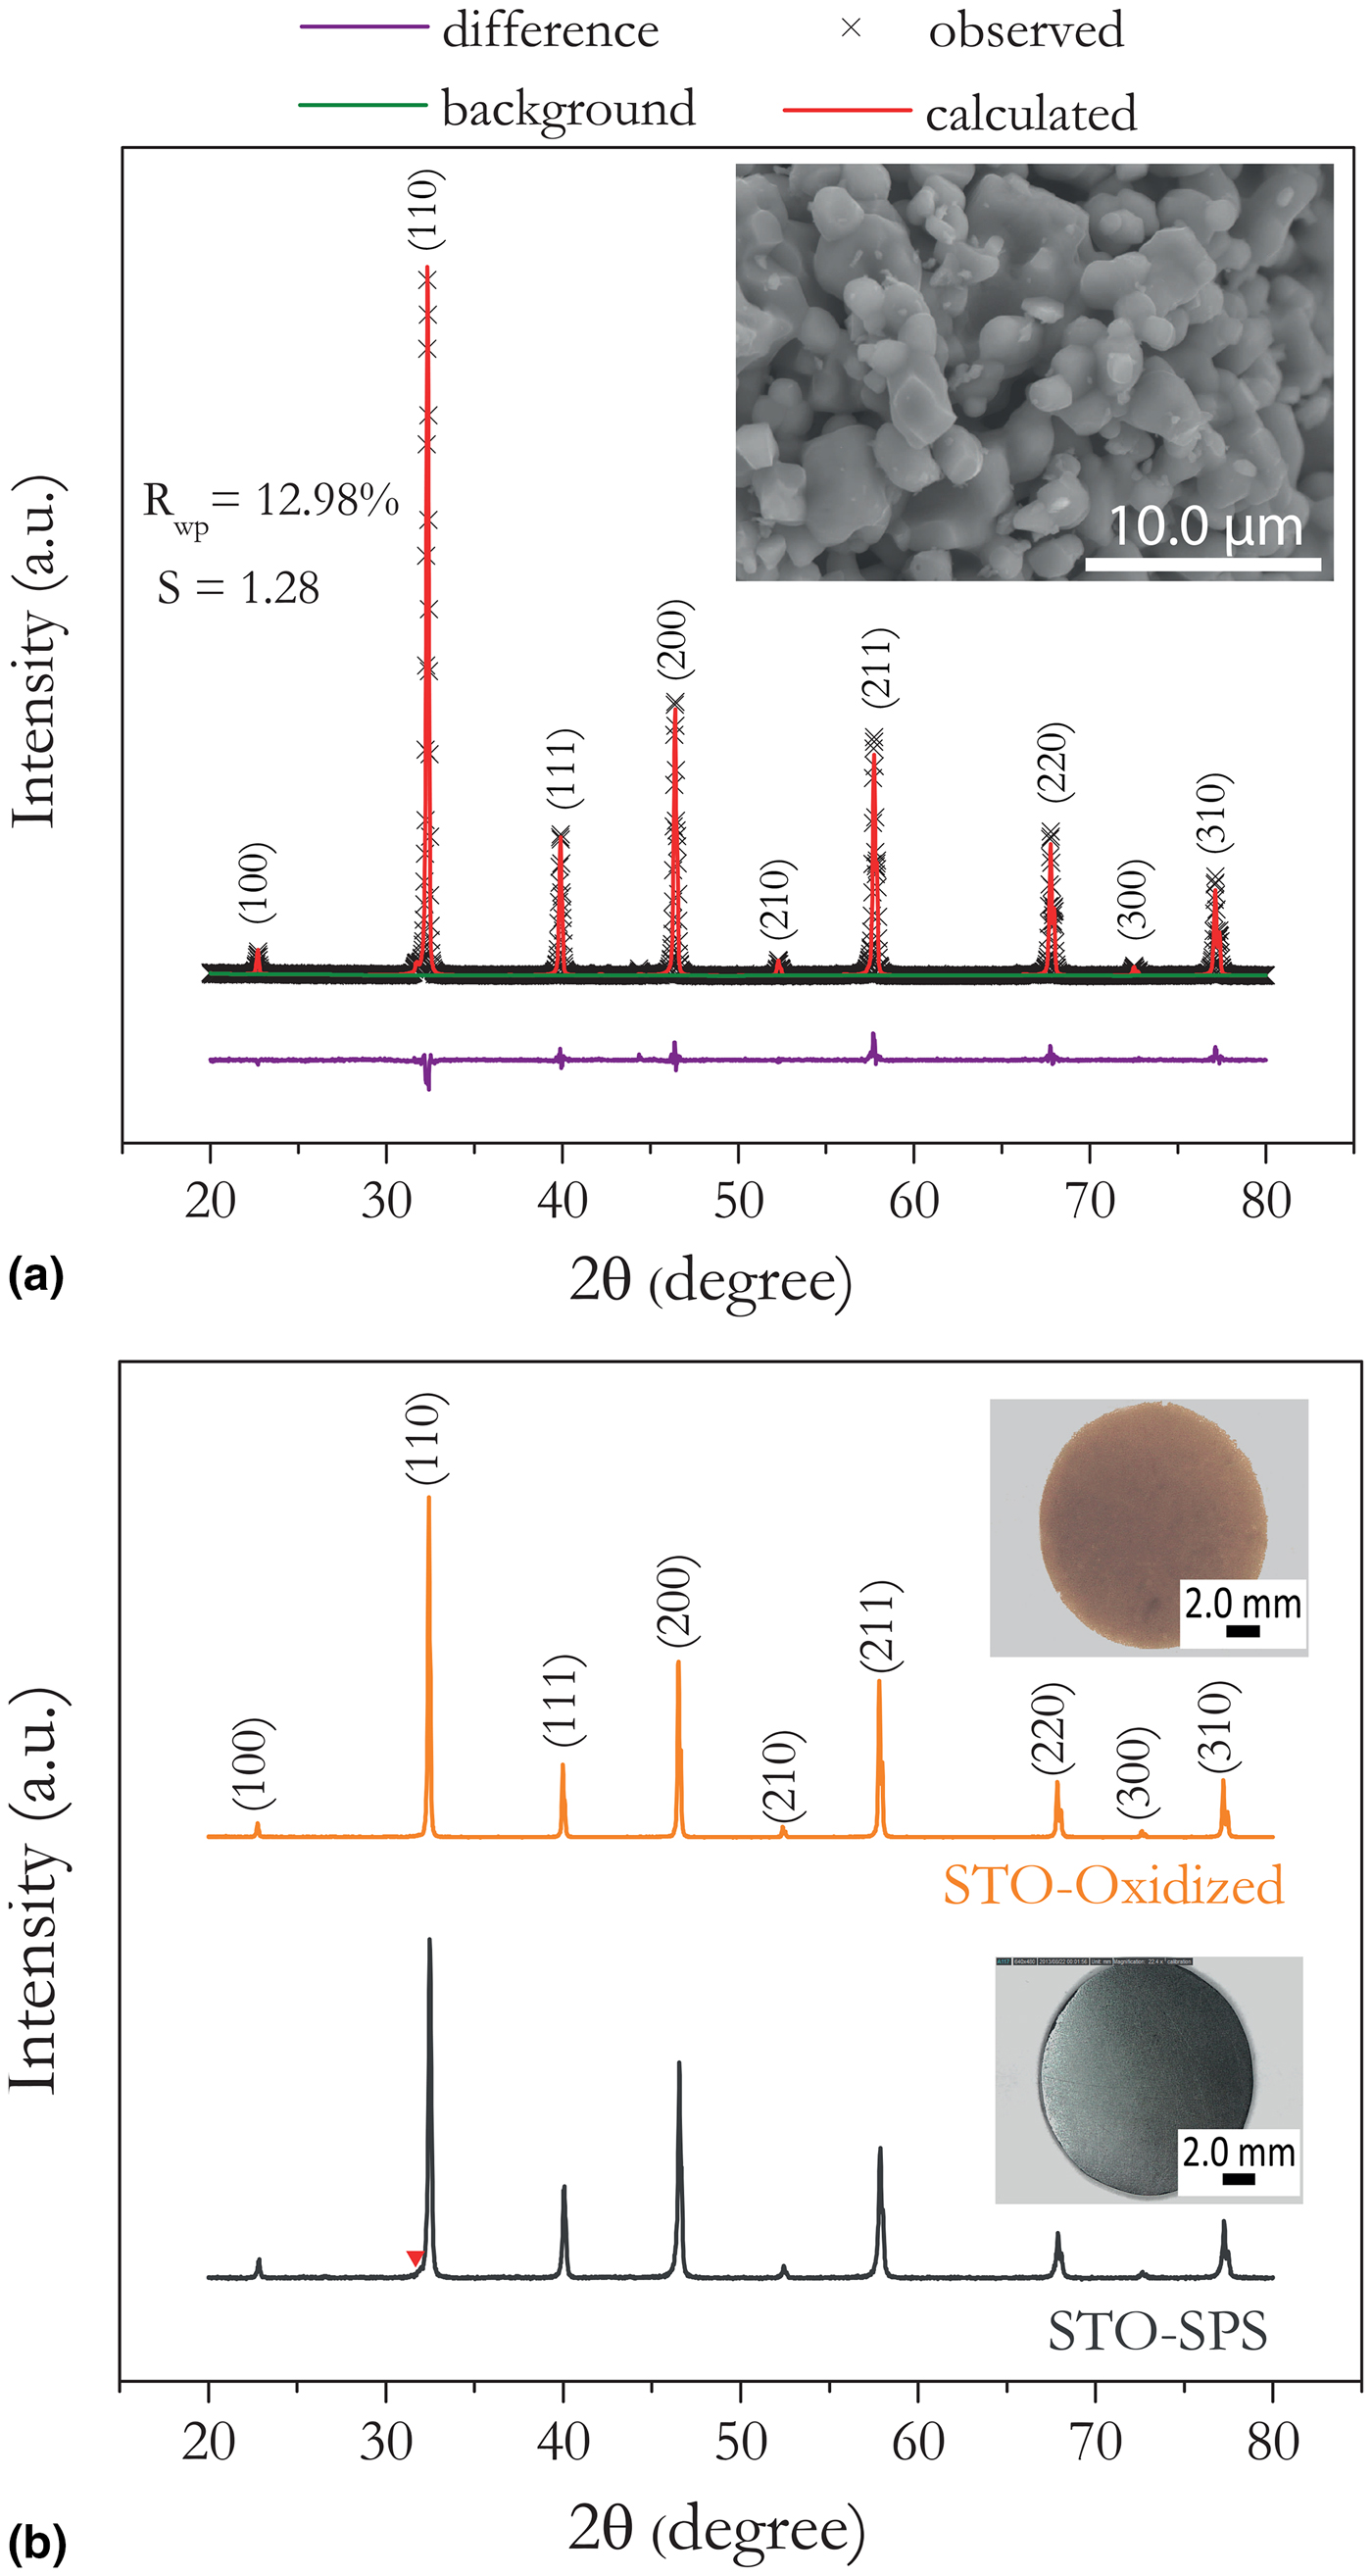
Powdered SrTiO3 was prepared using a solid-state reaction wherein stoichiometric amounts of SrCO3 powder (99.9%; Aldrich) and TiO2 nanopowder (99.5%; Aldrich) were mixed, cold pressed into pellets and calcined in air at ~1300–1400 °C with intermediate grinding and mixing for decarbonation. The calcined pellet was subsequently pulverized into fine powder using a mortar and pestle. About 6 g of resulting powder was then wrapped in graphite foil and loaded into graphite dies. The powder was solidified into a disk (≈12.7 mm diameter and 3 mm thick) using the SPS technique (Dr. Sinter Lab, SPS-515S) under dynamic vacuum at 1400–1500 °C for 5 min (holding time) with DC pulsed current ON/OFF ratio of 12:1. Samples densified using SPS at a high heating rate ~400 °C/min are henceforth referred to as STO-SPS. Unlike synthesis procedures reported in the literature where forming gas (5% H2 in Ar) was used to reduce the calcined powder, we took advantage of the highly reducing atmosphere in the SPS chamber to tune the oxygen stoichiometry. Both sides of the STO-SPS pellets were polished down by 0.25–0.5 mm to ensure complete removal of the residual carbon from the graphite foil. Density (ρ) of the STO-SPS samples were determined by the Archimedes’ method and were found to be >95% of their theoretical values. In order to systematically investigate the effect of non-stoichiometry on the thermal properties, STO-SPS samples were oxidized in air for 70 h at 900 °C. These oxidized samples are hereafter referred to as STO-oxidized. As shown in the inset figures of Fig. 1(b) the STO-SPS sample is opaque and dark gray in color, whereas the STO-oxidized is translucent and orange in color. In addition, (100)-oriented transparent single crystal substrates (hereafter referred to as STO-SC) were purchased (MTI Corp., USA) to serve as a reference. The STO-SC was transparent and with an orange hue, similar to the STO-oxidized. The structure of the calcined powders before SPS, and the STO-SPS and STO-oxidized were characterized using a Rigaku Ultima IV high resolution x-ray diffraction (XRD) with Cu Kα radiation, a Hitachi SU-6600 field emission scanning electron microscope (FESEM). Energy dispersive x-ray spectroscopy (EDS, Oxford Instruments) and electron back-scattered diffraction (EBSD) were also performed to investigate the chemical composition and structure. The analysis of the crystal structure and the corresponding x-ray diffraction were performed using the VESTA,[Reference Momma and Izumi24] PowderCell,[Reference Kraus and Nolze25] DICVOL[Reference Boultif and Louër26] software packages. Rietveld refinement analysis was performed using the collected XRD patterns with the PDXL software package (Rigaku, Version 1.8.1.0). The quantitative phase analysis to estimate the molar fraction of the secondary phase was also performed using the PDXL software package. The goodness of fit obtained for all the compositions range from S ~ 1.3 to 2.0 with R wp values ranging from ~13% to 15% (Fig. 1).
XRD profiles of (a) the as-prepared SrTiO3 powder, before SPS and (b) STO-SPS and STO-oxidized bulk ceramics after SPS indexed to cubic (space group Pm  $\bar{3}$m) and pseudo-cubic tetragonal (space group P4/mmm), respectively. The inset figure shows: (a) the SEM micrograph of the calcined powder and (b) the opaque and dark gray color of the STO-SPS sample, and the translucent and orange color of the STO-oxidized. The red down-pointing triangle in panel (b) indicates a shoulder arising from non-equivalent peak positions of the (110) and (101) hkl values in the tetragonal phase.
Thermal conductivity was measured over a broad temperature range from 30 to 800 K using two different measurement systems. Above room temperature (300–773 K), thermal conductivity, κ = ρC pD, was calculated from the measured thermal diffusivity, D, specific heat, C p, and density, ρ using Archimedes’ principle. Thermal diffusivity, D, was measured on the pellets using a Netzsch LFA 457 MicroFlash system (300–773 K). To prevent the laser beam from penetrating into the sample and overestimating D, the STO-SC and STO-oxidized were sputter-coated on both sides with a ~0.2 µm thick gold film. The specific heat, C p was measured on 4 × 4 × 1.5 mm3 samples cut from the pellets using a Netzsch differential scanning calorimeter (DSC) 404C Pegasus system.
Below room temperature (30–300 K), κ was measured on rectangular bars (10 × 2 × 2 mm3) cut from the pellets on a custom-designed measurement system using a steady state technique.[Reference Pope, Zawilski and Tritt27] κ is corrected for radiation losses above 200 K using the Stefan–Boltzmann law.[Reference Pope, Zawilski and Tritt27] The uncertainty in measured κ is ±(5–7)% arising from the uncertainty in sample dimensions as well as conductive and convective losses. High- and low-temperature measurements of electrical conductivity and Seebeck coefficient were performed on the same rectangular samples. Carrier concentration of the STO-SPS sample was determined with a Quantum Design Hall system using five-probe configuration under low (5000 Oe) and high (3 T) magnetic fields (30–300 K). Both STO-oxidized and the STO-SC samples were insulating in nature and their carrier concentrations could not be measured.
The velocity of sound (v s) was estimated from the measured elastic moduli using resonant ultrasound spectroscopy (RUS) from 300 to 800 K.[Reference Li and Gladden28] Thermogravimetric analysis (TGA) was also performed to estimate the oxygen content of the samples using a TA Hi-Res TGA 2950 thermogravimetric analyzer in flowing air at 300–1273 K with a constant heating rate of 2 K/min. Lastly, Raman spectra were obtained using a Dilor XY triple grating monochromator equipped with a liquid-nitrogen-cooled CCD detector and a 514.5 nm excitation from an Ar-ion laser coupled with an Olympus 50× microscope.
Results and discussion
Structure and composition
Figure 1(a) shows the XRD pattern of calcined SrTiO3 powder. The main reflections in the pattern can be readily indexed to the SrTiO3 cubic perovskite lattice (space group Pm  $\bar{3}$m) with a lattice parameter a = 3.906 Å. Phase analysis shows the presence of 1–2 mol% secondary phase at the interface of the SrCO3 and TiO2 powders, formed during the solid state reaction. The inset shows the SEM micrograph of the calcined powder with an average particle size of ~3–5 µm, which was then densified by SPS to form the STO-SPS sample. As shown in Fig. 1(a), low values of the least square refinement parameter for the whole pattern (R wp ~ 13%) and goodness of fit (S ~ 1.3) were obtained. Figure 1(b) shows the diffraction patterns of the STO-SPS and STO-oxidized. The diffraction pattern of the STO-SPS pellet is indexed to pseudo-cubic tetragonal (space group P4/mmm) lattices with lattice parameters, a = b = 3.9177 Å, and c = 3.887 Å.[Reference Gong, Yun, Ning, Greedan, Datars and Stager29] Upon oxidizing in air to form STO-oxidized pellet, the diffraction pattern reverts to that expected for SrTiO3 cubic perovskite lattice (space group Pm
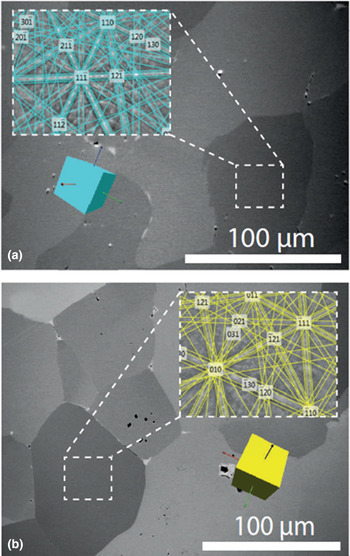
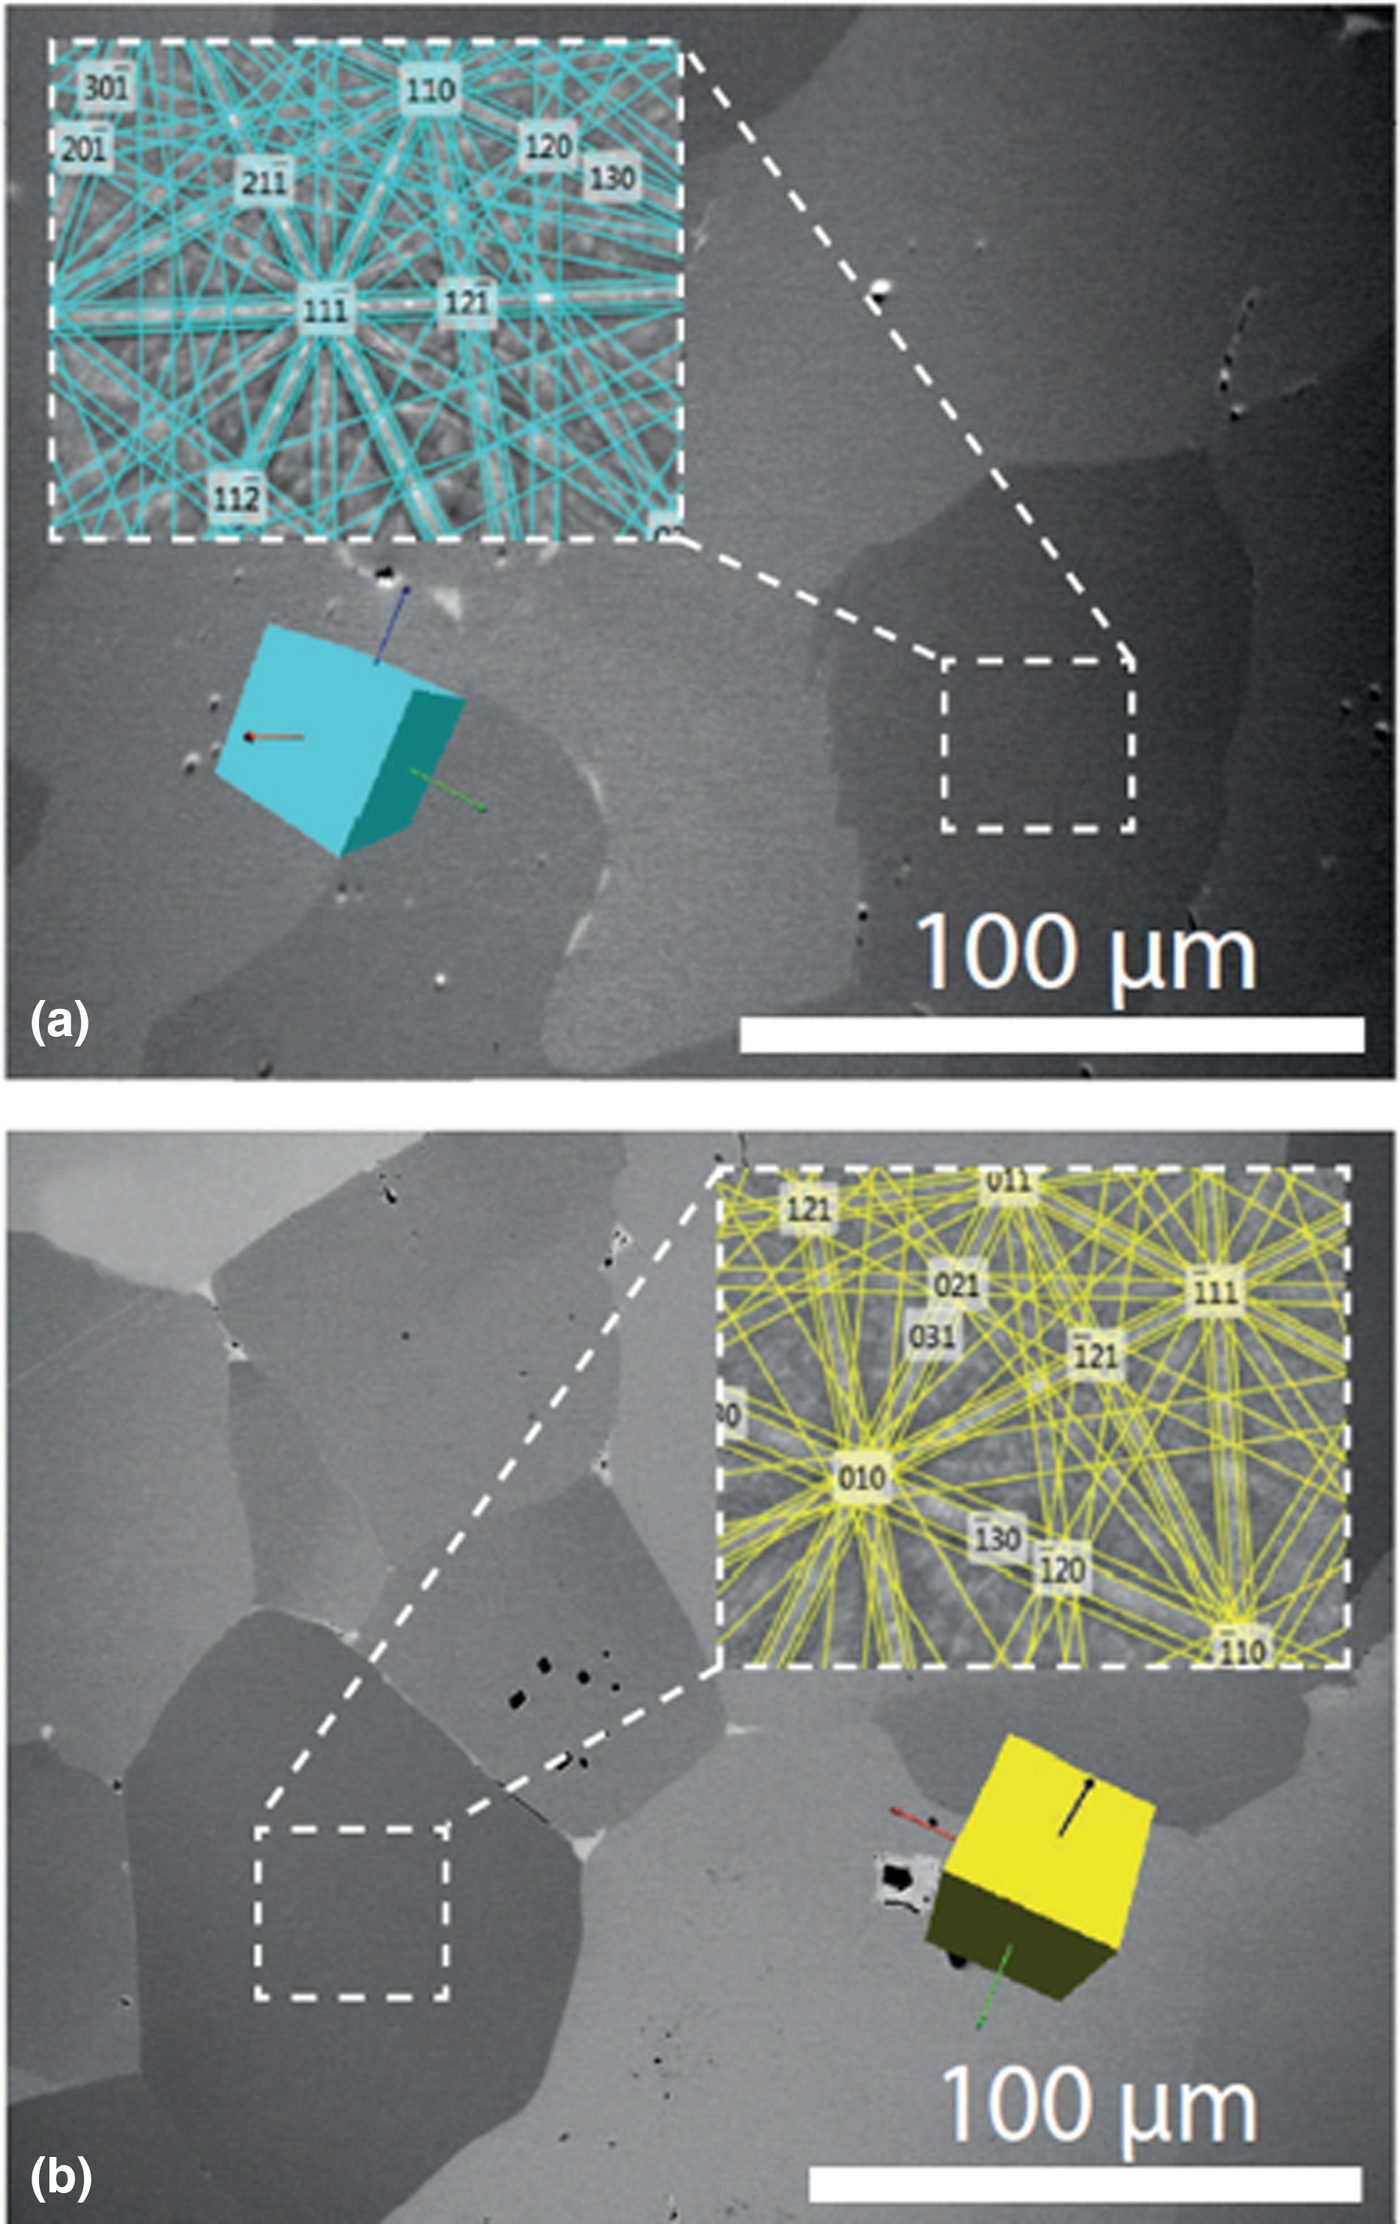
 $\bar{3}$m, lattice parameter a = 3.906 Å) in which oxygen vacancies are absent. The crystal structure of STO-SPS and STO-oxidized were further verified using EBSD and the analysis of the unique “kikuchi bands” revealed that the average electron-diffraction pattern of the grains can be indexed to pseudo-cubic tetragonal [Fig. 2(a)] and cubic lattices [Fig. 2(b)] in the STO-SPS and STO-oxidized respectively, consistent with the x-ray diffraction analysis. In general, EBSD results cannot conclusively differentiate between two crystal structures unless there is significant difference between unit cell dimensions. Nonetheless, the SEM micrographs suggest that both samples possess similar average grain size of ~50–100 µm (Fig. 2), which is due to grain growth that occurred during SPS. It should be noted that oxidation did not affect the average grain size.
EBSD analysis of (a) the STO-SPS and (b) STO-oxidized bulk ceramics. The inset figures exhibit the unique kikuchi patterns of the (a) the pseudo-cubic tetragonal (space group P4/mmm) and (b) and cubic (space group Pm  $\bar{3}$m) lattices. Similar grain sizes are observed in both the STO-SPS and STO-oxidized bulk ceramics.
Oxygen non-stoichiometry and thermal transport
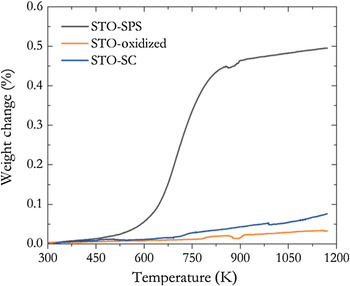
The oxygen uptake by each sample was estimated from their weight change using TGA (Fig. 3) using STO-SC as a reference. As expected, STO-oxidized exhibited similar weight change as the STO-SC, however the STO-SPS sample gained 0.5% in weight due to the uptake of oxygen which corresponds to an oxygen deficiency per formula unit (δ) of 0.06 (i.e., SrTiO2.94 assuming a stoichiometric cation ratio).
Weight change as a function of temperature for polycrystalline STO-SPS and STO-oxidized samples and single-crystalline STO-SC substrate heated in air with 2 K/min heating rate.
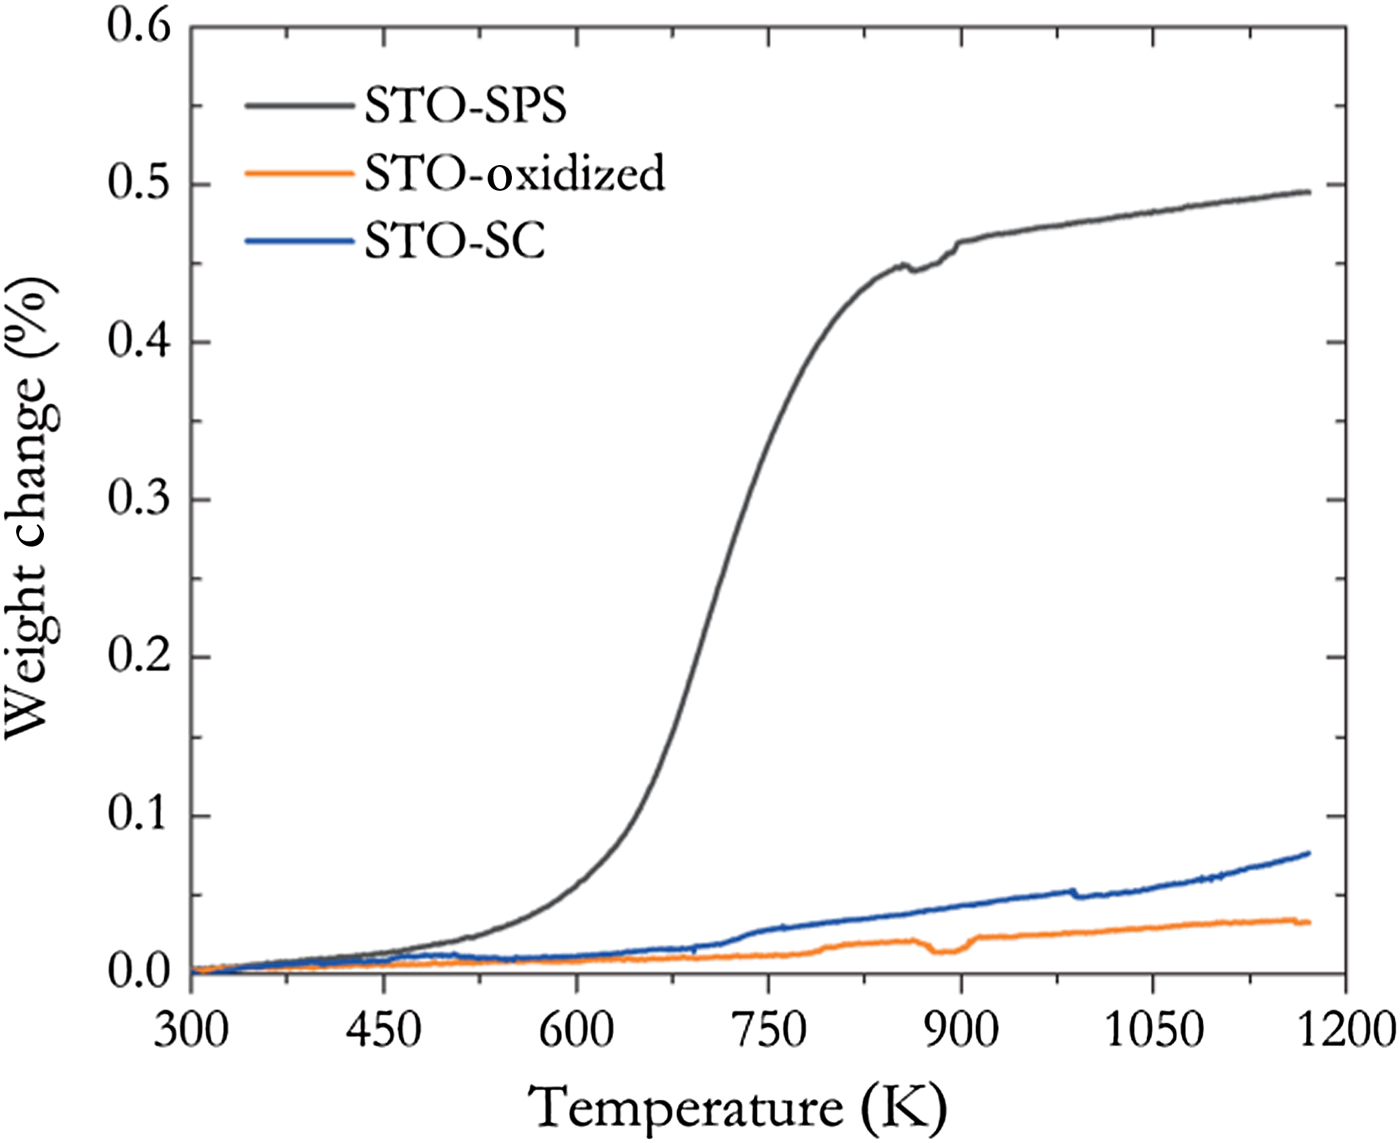
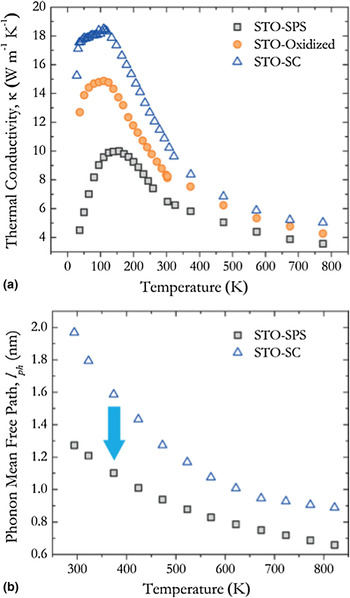
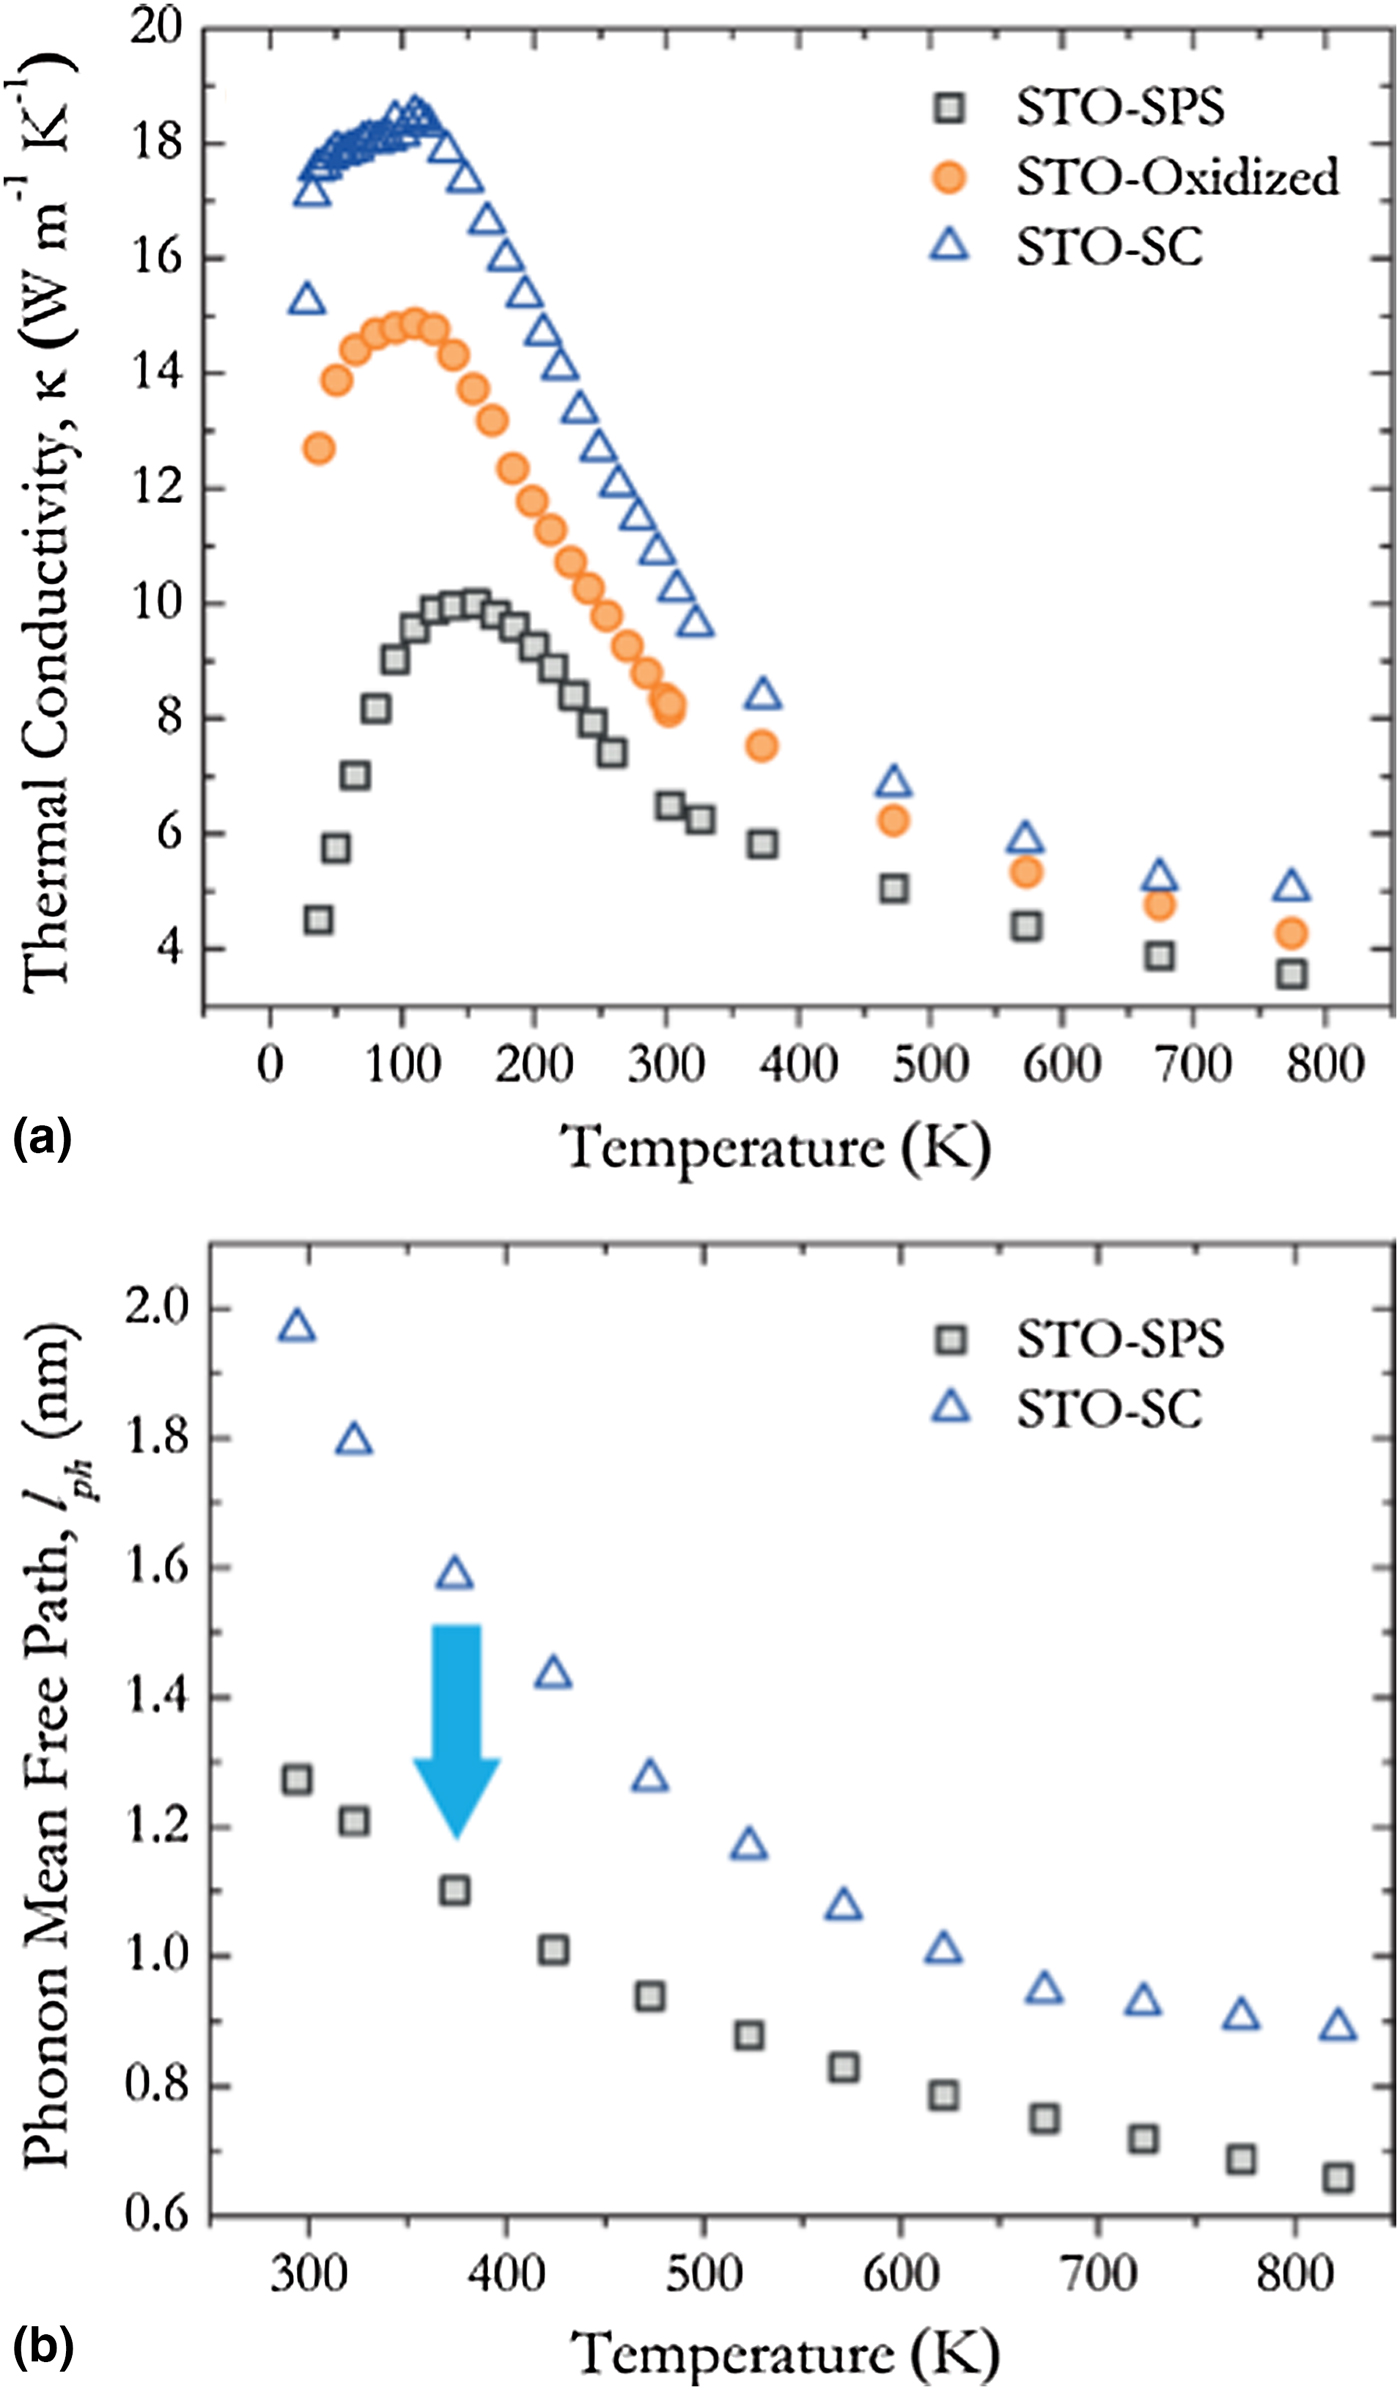
Figure 4(a) shows the total κ of STO-SPS and STO-oxidized samples relative to that of STO-SC. To the best of our knowledge, this is the first report of κ for SrTiO3 (either poly- or single-crystalline) over a broad temperature range of 30–800 K. The low-temperature κ of STO-SC is in agreement with the reported κ in the range 50–225 K by Steigmeier[Reference Steigmeier9] and Suemune[Reference Suemune8], above which it deviated due to radiation losses. A significant reduction in κ, 50% at 100 K and 40% at 300 K, was observed for the STO-SPS sample in comparison with that of STO-SC. Upon oxidation, κ increased by 30% at 300 K toward the corresponding value for STO-SC. Henceforth, we focus our discussion on the properties of STO-SPS since it exhibited the lowest κ [Fig. 4(a)]. To understand the underlying mechanism for reduction in κ for STO-SPS sample the phonon mean free path was estimated as a function of temperature [Fig. 4(b)]. From kinetic theory, the average phonon mean free path (l ph) is related to κ L as κ L = (1/3)C pv sl ph, where κ L is the lattice thermal conductivity, C p the specific heat, and v s the phonon velocity. The high-temperature C p is measured for both samples and is within 10% of each other over the whole temperature range. κ L in STO-SPS sample was determined from the Wiedemann–Franz relationship, κ L = κ − σLT, where, κ E = σLT is the electronic contribution to κ and L the Lorenz number for a degenerate semiconductor (L = 2.0 × 10⁻⁸ V2/K2).[Reference Tritt30] Owing to the insulating nature of the STO-SC samples in the temperature range studied, it is evident that κ ≈ κ L. For the STO-SPS sample, v s (~5172 at 300 K) was estimated from its measured elastic moduli using RUS and density,[Reference Bhattacharya, Mehdizadeh Dehkordi, Tennakoon, Adebisi, Gladden, Darroudi, Alshareef and Tritt17] which is close to the reported value of v s for the STO-SC sample at this temperature.[Reference Migliori, Sarrao, Visscher, Bell, Lei, Fisk and Leisure31] This suggests that the reduction in l ph does not originate from a reduction in either C p or v s but from an inherently different κ L. As expected, both STO-oxidized and STO-SPS samples exhibit a lower κ (≈ κ L) [Fig. 4(a)] than that of the STO-SC sample due to the presence of grain boundaries. However, the STO-SPS sample exhibits a further reduction of κ due to phonon scattering by oxygen vacancies.
(a) Total thermal conductivity of STO-SPS, STO-oxidized, and STO-SC samples. (b) Phonon mean free path estimated from measured and reported mean velocity of sound for STO-SPS and STO-SC samples.
In the Debye model using relaxation time approximation the Callaway's phenomenological model for κ L is given by[Reference Callaway32]:
 $$\kappa_{\rm L}(x) = \displaystyle{{k_{\rm B}} \over {2\pi ^2v_{\rm s}}}\left( {\displaystyle{{k_{\rm B}T} \over \hbar}} \right)^3\int_0^{\Theta _{\rm D}/T} {\displaystyle{{x^4{\rm e}^x} \over {\tau _{{\rm ph}}^{-1} {({\rm e}^x-1)}^2}}{\rm d}x} $$
where  $x = \hbar\! \omega /k_{\rm B}T$ is the reduced phonon frequency, ω the phonon frequency,
 $\hbar $ the reduced Planck's constant, k B the Boltzmann constant, and T the absolute temperature. The total relaxation time (τ ph) is given by the Matthiessen's rule,
 $\tau _{{\rm ph}}^{-1} = \tau _{{\rm PD}}^{-1} + {\rm }\tau _{\rm U}^{-1} + \tau _{\rm B}^{-1} $, consisting of phonon scattering by point defects (τ PD), the anharmonic phonon–phonon or Umklapp scattering (τ U), and the phonon-boundary scattering (τ B), respectively. The relaxation time for point defect scattering estimated by Klemens[Reference Klemens33] is given by
 $\tau _{{\rm PD}}^{-1} = A\omega ^4 = (V/4\pi v_{\rm s}^3 )\omega ^4\Gamma $ which represents a combination of impurity and isotope scattering where
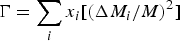 $\Gamma = \mathop \sum \limits_i x_i[({\rm \Delta} M_i/M)^2]$ is the mass fluctuation scattering parameter and V is the volume per atom. As proposed by Klemens,[Reference Klemens34] oxygen vacancies act as point defect scattering centers for phonons, and the effective mass of vacancies is given by ΔM/M = –(M a/M) − 2, where M is the average mass per atom, M a is the mass of the missing atom, and the term −2 accounts for the potential energy of the missing atom. Assuming there are no additional defects present in the STO-oxidized sample, the ΔM/M term arising from oxygen vacancies dominates the point defect scattering term in the STO-SPS sample. Thus, it may be concluded that mass fluctuation scattering due to oxygen vacancies is a dominant phonon scattering mechanism in the STO-SPS sample leading to the significant reduction in κ [Fig. 4(a)].
Raman spectroscopy
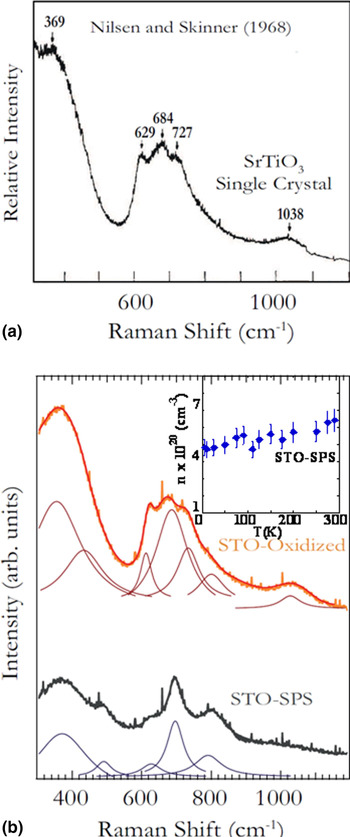
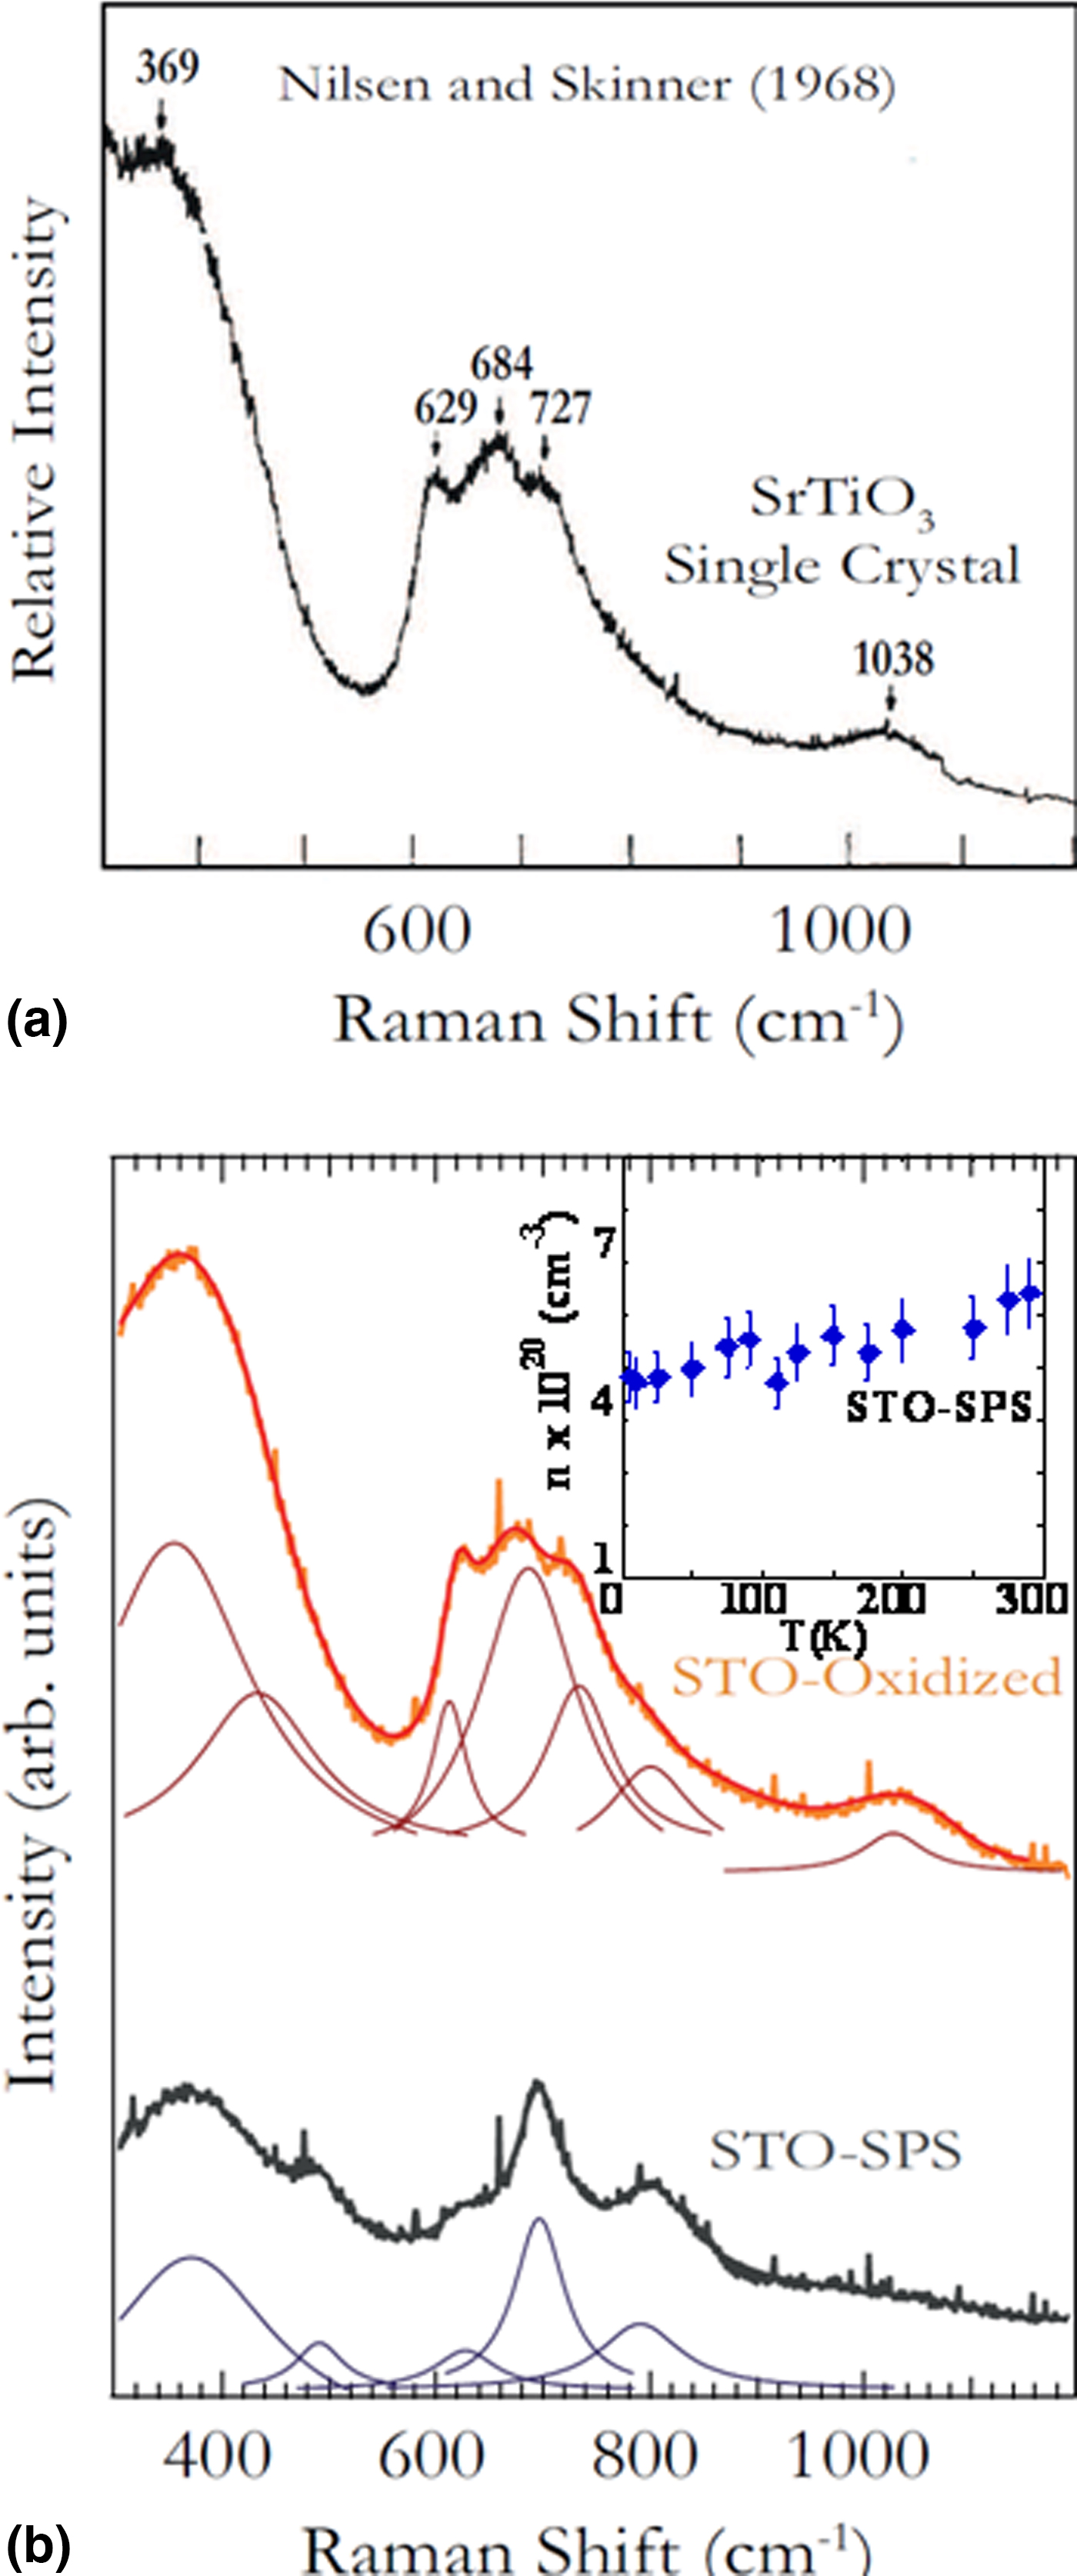
In order to further confirm the presence of oxygen vacancies, we compared the room temperature Raman spectra of STO-SPS and STO-oxidized samples with that of the standard STO-SC[Reference Nilsen and Skinner35] (Fig. 5). Previously, Tenne et al.[Reference Tenne, Gonenli, Soukiassian, Schlom, Nakhmanson, Rabe and Xi36] observed the emergence of otherwise forbidden first order Raman peaks in reduced and re-oxidized SrTiO3 single crystals. In other words, a peak at 700/cm emerges when the STO is reduced, and the measured carrier concentration reported by Tenne et al. was on the order of 1019/cm3. Inferring from the conclusions drawn by Tenne et al. in their combined Raman and electrical transport study,[Reference Tenne, Gonenli, Soukiassian, Schlom, Nakhmanson, Rabe and Xi36] the Raman peak at ~700/cm in STO-SPS suggests a carrier concentration n > 1019/cm3 arising from oxygen vacancies. This value of n is also consistent with the value measured in our electrical transport properties of the STO-SPS sample [inset in Fig. 5(b)]. Not surprisingly, the Raman peak at ~700/cm disappears in the STO-oxidized due to a reduction in oxygen vacancies. Indeed, the Raman spectrum of STO-oxidized showed four peaks (three peaks between 600 and 750/cm and one peak at 1040/cm that are expected for the stoichiometric SrTiO3) distinct from the Raman peaks in the STO-SPS sample. These new second order features (~600–750/cm) in the Raman spectrum of STO-oxidized showed an excellent match to the Raman peaks of SrTiO3 single crystals studied by Nilsen and Skinner.[Reference Nilsen and Skinner35] These three peaks at 629, 684, and 727/cm in single crystalline SrTiO3 were attributed to combination or overtones of transverse modes, and the band at 1038/cm to a superposition of longitudinal and transverse optical phonon overtones. Juxtaposing the disappearance of 700/cm peak and the appearance of four new peaks in the STO-oxidized samples, we conclude that the oxygen vacancies are significantly reduced upon oxidation.
Raman spectra of (a) pristine SrTiO3 single crystal at 300 K using a 488 nm laser line, reported by Nilsen and Skinner (reproduced from Ref. Reference Nilsen and Skinner35, with permission from AIP Publishing). (b) STO-SPS and STO-oxidized samples using a 514.5 nm Ar-ion laser excitation at 300 K. The inset in (b) shows the carrier concentration (n) of STO-SPS sample as a function of temperature from 10 to 300 K.
Conclusions
In summary, we studied the role of oxygen non-stoichiometry on κ, and report a significant reduction in κ in the spark-plasma sintered SrTiO2.94 (STO-SPS) compared with its pristine single crystalline counterpart SrTiO3 (STO-SC). Upon oxidation of the STO-SPS sample, a higher κ (~25% at 300 K) is measured in the STO-oxidized compared with that of the STO-SPS sample. This confirms the role of oxygen vacancies that act as dominant phonon scattering centers in the STO-SPS sample. Interestingly, the STO-SPS sample also exhibits a carrier concentration n ~ 1020/cm3, in contrast to the electrically insulating behavior observed in both STO-oxidized and STO-SC samples. The presence of oxygen non-stoichiometry in STO-SPS sample is independently confirmed by thermogravimetric measurements and Raman spectroscopy.
Acknowledgments
The research was supported by KAUST-Clemson Faculty Initiated collaboration grant. The authors would like to thank W.G. Nilsen and J.G. Skinner[Reference Nilsen and Skinner35] for the reprint their Raman spectra to directly compare with our Raman spectra. The authors would like to acknowledge useful discussions with Dr. Colin McMillen (Clemson University) on the XRD analysis of these samples and Mr. Herbert Behlow on stoichiometric analysis.