The development of Internet technology has profoundly changed many organizational psychological tasks, such as recruitment (Bartram, Reference Bartram2000; Lievens & Harris, Reference Lievens, Harris, Cooper and Robertson2003), personnel selection (Lievens & Chapman, Reference Lievens, Chapman, Wilkinson, Redman, Snell and Bacon2009; Lievens & Harris, Reference Lievens, Harris, Cooper and Robertson2003; Ployhart, Reference Ployhart2006; Sackett & Lievens, Reference Sackett and Lievens2008) and assessment practices (Naglieri et al., Reference Naglieri, Drasgow, Schmit, Handler, Prifitera, Margolis and Velasquez2004; Tippins, Reference Tippins2009; Tippins et al., Reference Tippins, Beaty, Drasgow, Gibson, Pearlman, Segall and Shepherd2006). The unproctored Internet testing (UIT) administration mode, where Internet testing is not monitored by proctors, is being used more and more. In a recent global survey Ryan et al. (Reference Ryan, Inceoglu, Bartram, Golubovich, Grand, Reeder, Yao, Nikolaou and Oostrom2015) found that of those companies who used computerized testing, 40% indicated that they only used unproctored testing, and only 20% of the tests were supervised.
There are many advantages associated with the use of UIT in terms of a reduction in costs such as those related to administrators, equipment, and travel, as well as increasing accessibility enabling organisations to reach geographically diverse job applicants and global talent, in addition to improving the applicant’s perception of the organization by showing a high-tech image (Guo & Drasgow, Reference Guo and Drasgow2010; Lievens & Burke, Reference Lievens and Burke2011). However, despite these advantages, UIT has always been considered to be controversial due to questions concerning its validity. These issues arise from uncontrolled administration that makes it easier for security breaches such as test theft or cheating (i.e., the use of forbidden test materials, the use of another person to help answer the test, and even the subrogation of the applicant by someone else with a higher level of ability).
Because there are concerns as well as advantages from both academics and professionals, the question is not “Should we use UIT?”, but “What is the best way to use UIT?” (Lievens & Burke, Reference Lievens and Burke2011). Proctored and unproctored applications are not incompatible, and a sensible strategy could be to combine both administration modes. In order to reduce costs in large scale programs, unproctored testing could be applied at the first stage for the efficient screening of the candidates and proctored testing could be applied at the final stage, to validate the scores obtained in the first stage. The International Test Commission (2006, 2016) recommends that test-takers under UIT administration be tested with a verification test and be given warning of this procedure. Advising the candidates about this two-step administration mode may be an effective way of discouraging or even eliminating some dishonest behavior (Sanderson, Viswesvaran, & Pace, Reference Sanderson, Viswesvaran and Pace2011).
Discrepancies between unproctored and proctored scores can be used for detecting cheating. Tippins et al. (Reference Tippins, Beaty, Drasgow, Gibson, Pearlman, Segall and Shepherd2006) suggest three possibilities when unproctored and proctored administrations are combined. The one most often used to validate UIT scores (Tendeiro, Meijer, Schakel, & Maij-deMeij, Reference Tendeiro, Meijer, Schakel and Maij-deMeij2013) applies a short proctored confirmation or verification test, after the initial unproctored test to check the consistency between both scores. Additionally, if an inconsistent response pattern is found, the applicant is required to take a third proctored exam or an extended version of the verification test.
One critical point of this consistency-check strategy for increasing selection fairness is that it requires a valid procedure for detecting cheating. Several methods have been proposed to detect a significant inconsistency between the unproctored and the proctored response patterns in order to infer cheating. Methods based both on person-fit approaches (for a review, see Karabatsos, Reference Karabatsos2003; Meijer & Sijtsma, Reference Meijer and Sijtsma2001) and on comparing the scores obtained in both applications (Guo & Drasgow, Reference Guo and Drasgow2010; Segall, Reference Segall2001) have been published. Recently, other methods have been proposed that sequentially analyze the compatibility between the UIT ability estimates and the item responses on a linear (Armstrong & Shi, Reference Armstrong and Shi2009; Tendeiro & Meijer, Reference Tendeiro and Meijer2012) or adaptive proctored test (Makransky & Glas, Reference Makransky and Glas2011).
A well-known procedure when both the UIT and the verification test are computerized adaptive tests (CAT) is the Z-test proposed by Guo and Drasgow (Reference Guo and Drasgow2010). This test compares the ability estimates from the unproctored and the proctored forms, to check whether or not their difference is statistically significant, taking into account the measurement precision of both forms. Guo and Drasgow (Reference Guo and Drasgow2010) recommend its use for practical applications because the Z-test statistic has higher power to detect dishonest job applicants at low Type I error rates than the likelihood ratio test.
Information about the operational UIT programs that have implemented the consistency-check with the Z-test approach is scarce. Kantrowitz and Dainis (Reference Kantrowitz and Dainis2014) have applied this procedure to a cognitive test and found that the percentage of inconsistent scores indicative of possible cheating was 6.4% and 1.8%, not far from the respective nominal alpha levels of 5% and 1%.
Little is known either about how many people cheat during UIT scenarios, or the effect of cheating on the test scores. In an extensive review of the selection assessment literature, Ryan and Ployhart (2014; p. 704) wrote: “Our surveyed practice leaders clearly felt there was not enough research: They said they want to see more data on the validities of UITs and the pros and cons of verification testing […] and we have to agree”. Most of the research has been conducted using simulated data (i.e., Guo & Drasgow, Reference Guo and Drasgow2010; Makransky & Glas, Reference Makransky and Glas2011) and some studies have shown that the differences between unproctored and proctored test scores using a speeded cognitive test can be small (Arthur, Glaze, Villado, & Taylor, Reference Arthur, Glaze, Villado and Taylor2009; Nye, Do, Drasgow, & Fine, Reference Nye, Do, Drasgow and Fine2008; Wright, Meade, & Gutierrez, Reference Wright, Meade and Gutierrez2014). Similar small differences have been found using cognitive unspeeded tests (Kantrowitz, & Dainis, Reference Kantrowitz and Dainis2014; Lievens & Burke, Reference Lievens and Burke2011). Moreover, for non-simulation studies, the percentage of cheaters detected can also depend on the performance of the statistic used for detecting cheating.
Therefore, some additional evidence to validate the honest vs. cheaters classification is welcome. Wright et al. (Reference Wright, Meade and Gutierrez2014) observed differences in the behavior of cheaters with respect to the honest participants using various performance indicators, such as the average time per item, the number of answered items or the number of omissions. But, as the authors point out, these differences are not systematic throughout the two samples of participants used in the study. However, this could be a way of obtaining additional data to perform an indirect validation of the classification procedures applied. Specifically, it is well-known that the more difficult the item and the lower the ability of the participant, the longer the response time needed to answer a cognitive item (Swygert, Reference Swygert2003; Verbic & Tomic, Reference Verbic and Tomic2009). Therefore, by considering the UIT scores, the item response time in the proctored verification test is expected to be greater than for the cheaters, because they will have received items fitted in difficulty to the faked and higher ability level they employed in the unproctored test. In this sense, this manuscript conducts an analysis of item response times that provides complementary evidence about whether the decision reached with the Z-test is correct or not.
The current study describes the performance of an operational UIT CAT system for English grammar assessment that incorporates a two-step verification procedure using the Z-test for the detection of cheating. The paper consists of two studies. In the first, we analyzed the performance of the Z-test statistic on the operational adaptive testing program by means of a simulation study. Information regarding Type I error and power rates are provided. This study yielded some guarantee of the honest vs. cheater classification in the specific selection settings because the Guo and Drasgow simulation conditions neatly differ from our operational test conditions (i.e. it has shorter bank, different item parameters, etc.). The simulation study was also aimed at exploring the efficiency of the Modified Z-test we proposed to use. In the second study, after the viability of the Z-test had been established, real data on an empirical selection setting were gathered. This study provided evidence regarding the validity of the honest vs. cheater classification by using the response time as an external criteria. Finally, it also provided information about the percentage of suspected cheaters, as well as how the two testing conditions are related to the trait estimates obtained in a real selection context.
Study 1
Method
Item pool. We used the item bank (197 items calibrated with the 3PL model) of the updated eCAT-Grammar, a computerized adaptive test for assessing English grammar (Abad, Olea, Aguado, Ponsoda, & Barrada, Reference Abad, Olea, Aguado, Ponsoda and Barrada2010; Olea, Abad, Ponsoda, & Ximénez, Reference Olea, Abad, Ponsoda and Ximénez2004) that is currently applied in personnel selection processes for the quick screening of a candidate’s English reading ability. The test items assess two English language competences: Discourse and grammar. Each multiple choice item is comprised of a sentence, with some consecutive words removed, and four alternatives for the omitted part. Despite the short bank length, Olea et al. (Reference Olea, Abad, Ponsoda and Ximénez2004) show that the precision of the ability estimates is adequate (SE < 0.3) for test lengths of more than 20 items.
Simulated applicants. Two types of simulees were generated: Honest and cheaters. For the honest examinees, true ability was considered to be the same in the UIT and in the verification stages ( ${{\rm{\theta }}_{\rm{u}}} = {{\rm{\theta }}_{\rm{v}}}$), whereas for the cheaters, true ability in the UIT was considered greater than the ability in the proctored verification stage (
 ${{\rm{\theta }}_{\rm{u}}} = {{\rm{\theta }}_{\rm{v}}} + {\rm{\Delta \theta }}$, where
 ${\rm{\Delta \theta }}$ is the increase in the true ability due to cheating). Five fixed ability levels (θv = –2, –1, 0, 1, 2) were considered. In the honest condition, the simulees’ responses in both conditions were generated with the same five previous ability levels. In the cheating condition, when the ability level in the verification condition was –2, the ability levels for the unproctored conditions were –1, 0, 1 or 2; when the ability in the verification stage was –1, they were 0, 1 or 2 etc. A total of 1,000 applicants were simulated for each of the 15 (θu, θv) pairs: (–2, –2), (–1, –2) … (2, 2).
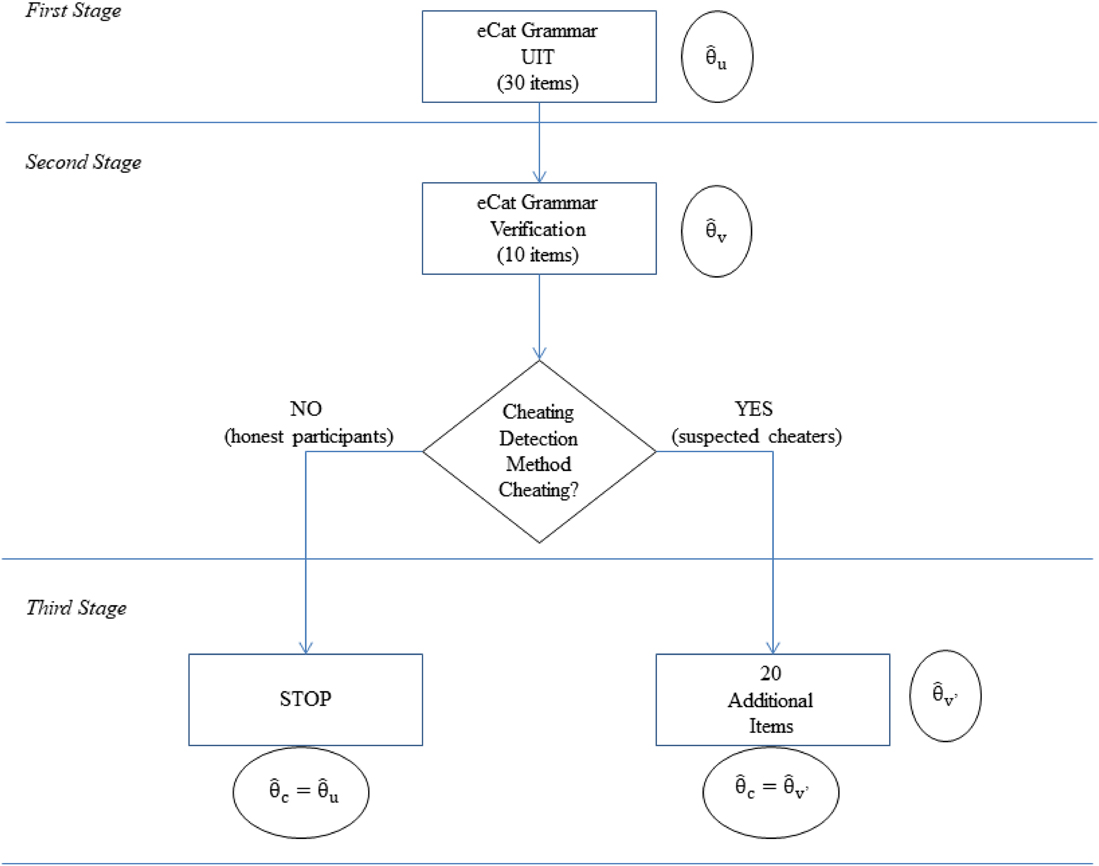
The simulation procedure used replicates of the operational eCAT’s main features. Basically, eCAT employs a maximum information procedure for item selection, and the restricted method (Revuelta & Ponsoda, Reference Revuelta and Ponsoda1998) for item exposure control. Further details of the adaptive algorithm can be found in Olea et al. (Reference Olea, Abad, Ponsoda and Ximénez2004). The flow chart included in Figure 1 summarizes the application procedure.
Application Procedure Flow Chart.

UIT first stage. The test length in the UIT stage was fixed at 30 items. A final ability estimate ( ${{\rm{\hat{\theta }}}_{\rm{u}}}$) was obtained for each examinee.
VPT (Verification Proctored Testing) second stage. A total of 10 additional items were applied to simulate the second (proctored) stage, and an ability estimate ( ${{\rm{\hat{\theta }}}_{\rm{v}}}$) was obtained from the responses to these 10 items. For each examinee, the items applied in the first stage were excluded from the bank. The initial ability estimate was the value obtained in the UIT stage (
 ${{\rm{\hat{\theta }}}_{\rm{u}}}$). The maximum likelihood procedure was applied for ability estimation, keeping the estimates constrained in the [–4, 4] interval. The Fisher information and the restricted method were used for item selection and exposure control, respectively.
Cheating detection. After the application of 10 items, two methods for detecting cheating were applied:
a) The unilateral Z-test (Guo & Drasgow, Reference Guo and Drasgow2010):
 $$Z = {{{{{\rm{\hat{\theta }}}}_{\rm{u}}} - {{{\rm{\hat{\theta }}}}_{\rm{v}}}} \over {\sqrt {SE_u^2 + SE_v^2} }}$$
Where  ${{\rm{\hat{\theta }}}_{\rm{u}}}$ and
 $SE_u^{}$ were the ability estimate and standard error in the UIT stage;
 ${{\rm{\hat{\theta }}}_{\rm{v}}}$ and
 $SE_v^{}$ were the ability estimate and the standard error obtained from the responses to the 10 items in the verification stage.
b) Comparing our conditions with those of Guo and Drasgow (Reference Guo and Drasgow2010), higher standard errors of the ability estimates were expected because our item bank was smaller, the verification test was short, and our estimation method was the maximum likelihood (Guo and Drasgow used instead Bayesian estimates). For these reasons, we also checked a Modified Z-test, in which Se values exceeding 1were truncated to 1, in order to avoid the overestimated large standard errors corresponding to extreme
 $\hat{\theta }$ values.

Third stage. If the examinee was classified as a suspected cheater (i.e., if Z-test was above 2.32), 20 additional items were applied. For the examinees classified as non-cheaters,  ${{\rm{\hat{\theta }}}_{\rm{u}}}$ was considered to be the final ability estimate (
 ${{\rm{\hat{\theta }}}_{\rm{c}}}$ =
 ${\rm{\hat \theta }}_{\rm{u}} $). For the examinees classified as suspected cheaters, the final ability estimate was
 ${{\rm{\hat{\theta }}}_{{\rm{v'}}}}$ (
 ${{\rm{\hat{\theta }}}_{\rm{c}}} = {{\rm{\hat{\theta }}}_{{\rm{v'}}}}$), obtained from the responses to the final 30 items (10 verification plus 20 additional items).
Evaluation criteria of the cheating detection method. Firstly, the descriptive statistics of the UIT and VPT ability estimates and standard errors were computed. Secondly, the Type I error rate was calculated as the percentage of honest simulees that were classified as suspected cheaters, which indicated the rate of false positives. Thirdly, for each dishonest condition, power rates were obtained as the percentage of correctly detected cheaters ( $\alpha = 0.01$). All algorithms and data analysis were programmed and executed in R (R Core Team, 2015). The R libraries used are catR (Magis & Raiche, 2012; Magis & Barrada, Reference Magis and Barrada2017) and lme4 (Bates et al., Reference Bates, Maechler, Bolker, Walker, Christensen, Singmann and Green2017).
Results
Table 1 includes the averages of  ${{\rm{\hat{\theta }}}_{}}$ and
 $SE_{}^{}$ (truncated and non truncated) for the honest simulees at the end of the UIT (30 items) and VPT (10 items) stages.
Means of Estimated Thetas and Standard Errors in the UIT(u) and Verification(v) Conditions when the Standard Errors Are Truncated (T) or not (nonT), for each True Theta, and Honest Examinees

Firstly, comparing column 1 with columns 2 and 5, we observed a slight bias outwards typical of a maximum likelihood estimation. Secondly, as expected, the standard errors were lower in the UIT (longer test) than in the VPT condition. Thirdly, the standard errors show more precision for the medium or high ability levels, as a consequence of the particular item bank in use (see Olea et al., Reference Olea, Abad, Ponsoda and Ximénez2004). Fourthly, the VPT standard errors were very high, and the difference between the two last columns was particularly outstanding.
Table 2 shows the Type I error rates ( $\alpha = .01$) for each ability level. The Z-test was conservative with nominal rates lower than 1%, which is consistent with previous studies (Guo & Drasgow, Reference Guo and Drasgow2010). Type I error rates were lower for lower ability levels. The Modified Z-test showed a similar performance, but was liberal for the lower ability levels (the highest percentage of false positives was 2.9%). However, it was not very likely that the low ability test-takers, even if they had cheated, would have got a trait estimate above the cut off in a demanding real selection context.
Type I Error Rate for the Z-test and the Modified Z-test Statistics for each Ability Level ( ${{\rm{\theta }}_{\rm{v}}}$)

Note: Nominal Type I Error Rate is .01.
Table 3 shows the power for each ability level, using the Z-test and Modified Z-test. In general, the lower the ability and the lower the effect size, the lower the power rates. The power of Z-test was low (smaller than 0.5) for almost all the conditions. On the other hand, the Modified Z-test showed a higher power for all the conditions. For the smaller effect size ( ${\rm{\Delta \theta }} = 1$) the detection rates were low at 13–19%, for the ability levels between –2 and –1, and moderate at 54–60%, for the higher ability levels. For almost all the other conditions, the power was acceptable (larger than 65%), but far from perfect.
Power Rate for Z-test and Modified Z-test Statistics for each Ability Level ( ${{\rm{\theta }}_{\rm{v}}}$)

Note: Nominal Type I Error Rate is .01.
Study 2
As mentioned in the introduction, very few methods have been proposed for detecting cheating when applying UIT. Guo and Drasgow (Reference Guo and Drasgow2010) studied two procedures and found that the Z-test outperformed the LR-test. In Study 1 we have shown that the Modified Z-test improved the performance of the Z-test in both Type I errors and power indicators, for our particular bank and item parameters. Therefore, in the second study the Modified Z-test was applied to a real personnel selection process and, in addition, we analysed the relation between response time in the UIT and the verification test for both honest candidates and suspected cheaters.
Method
Participants. Data were provided by a Spanish company who had used eCAT for an initial assessment of a candidate’s English level. The total sample size consisted of the 3,486 candidates for the openings available during the years 2012 and 2013. The proctored version of the test was applied to a reduced sample (N = 954) of aspirants succeeding at the initial step of the selection process. Because the decision to apply the verification test was taken after the first phase of the selection process had begun, the participants did not know when taking the unproctored test, that they may be required to take a proctored verification test later.
Procedure. The two-stage eCAT procedure described in Study 1 was applied. Item response times were recorded in both the unproctored and verification tests. The Modified Z-test was computed twice for the examinees detected as suspected cheaters, firstly at the control point for comparing  ${{\rm{\hat{\theta }}}_{\rm{u}}}$ and
 ${{\rm{\hat{\theta }}}_{\rm{v}}}$, and secondly at the end of the third stage to compare
 ${{\rm{\hat{\theta }}}_{\rm{u}}}$ and
 ${{\rm{\hat{\theta }}}_{\rm{c}}}$. The Modified Z-test comparing
 ${{\rm{\hat{\theta }}}_{\rm{u}}}$ and
 ${{\rm{\hat{\theta }}}_{\rm{c}}}$, which is larger and more reliable, enabled confirmation of the initial classification as suspected cheater or honest participant remained true.
Analysis. Firstly, the rate of false positives was obtained. This rate was defined as the percentage of examinees classified as suspected cheaters on the first occasion (the 10 items verification stage), but not at the end of the 30 items verification stage. Secondly, a random intercept multilevel regression model for predicting response time to the items in the verification stage was applied. The multilevel model deals properly with the expected dependence of the observations (Hox, Reference Hox2002). In our study, there was a dependence of item responses because they were obtained from the same examinee. Two levels, Level–1 (items) and Level–2 (examinees), and three fixed predictor variables were considered: Item difficulty (b) was the single Level–1 predictor, and the classification as cheater according to the Modified Z-test and ability estimate, were the two Level–2 predictors. Two alternative models were tested varying the ability estimate ( ${{\rm{\hat{\theta }}}_{\rm{u}}}$ or
 ${{\rm{\hat{\theta }}}_{\rm{c}}}$). It was expected that when
 ${\rm{\hat \theta }}_{\rm{u}} $ was used, the suspected cheaters response time in the verification test would be higher than expected (thus, being a cheater would be predictive). By contrast, when the corrected ability
 ${\hat{\theta }_c}$ was used, the performance in the verification stage would be more consistent with ability and being flagged as a suspected cheater or not would not be predictive in this case.
Results
Estimated trait levels. Of the 954 examinees who were assessed in the proctored CAT, 132 (13.84%) were detected as suspected cheaters. Table 4 shows the means and standard deviations, for each group  ${\rm{in \hat \theta }}_{\rm{u}} ,{\rm{\hat \theta }}_{\rm{v}} ,{\rm{and \hat \theta }}_{\rm{c}} $ Because access to the second stage requires a high level of ability, the mean trait levels in the UIT stage were clearly over 0. In fact, for the whole sample the trait estimate mean was 0.98, and was even higher for the honest and suspected cheater selected subsamples at 1.21 and 1.81, respectively.
Means and Standard Deviations at each Stage of the eCAT Verification Procedure for the whole UIT Sample and those Flagged as Honest or Suspected Cheaters with the Verification Test

For the examinees flagged as honest, small differences were found between the estimated trait levels from the UIT and the verification phase, F(1, 821) = 3.996, p = .046, squared partial eta = 0.005. For the examinees flagged as suspected cheaters, the differences between the  ${{\rm{\hat{\theta }}}_{}}$ estimates were statistically significant and the effect size was considerable, F(2, 130)= 412.934; p < .001, squared partial eta = 0.864. Post-hoc analyses revealed that the three possible comparisons were all statistically significant (p < .001). The ability estimate obtained in the verification stage (–0.24) was lower than that obtained in the unproctored stage (1.81). In fact, the large difference, and its corresponding standard error, was the indicator of being considered a suspected cheater. After prolonging the second stage and considering the final corrected estimates (
 ${{\rm{\hat{\theta }}}_{\rm{c}}}$), the mean trait level of suspected cheaters increased (0.56) with respect to
 ${{\rm{\hat{\theta }}}_{\rm{v}}}$; i.e. those flagged as suspected cheaters partly consisted of those examinees whose initial performance was below their final performance. Also, when considering
 $({\rm{\hat \theta }}_{\rm{c}} )$, the suspected cheaters were found to have lower ability traits (0.32) than the honest examinees (1.21). The standard deviations of the verification stage exceeded those found in the other stages, due to the presence of extreme theta estimates in this short verification test.
For the group of suspected cheaters, the Modified Z-test was reapplied at the end of the verification stage and the ability estimates ( ${{\rm{\hat{\theta }}}_{\rm{u}}}$ and
 ${{\rm{\hat{\theta }}}_{\rm{c}}}$) were compared again. The rate of false positives was 3.79%. Thus, 96.21% of examinees remained classified as suspected cheaters, further increasing the confidence in the classification.
Analysis of reaction times. The random intercepts and residual variances were 20.54 and 60.93 (predictor  ${{\rm{\hat{\theta }}}_{\rm{U}}}$) and 20.28 and 60.94 (predictor
 ${{\rm{\hat{\theta }}}_{\rm{c}}}$). The intraclass correlations were 0.252 and 0.25, respectively. Table 5 shows the regression coefficients for the fixed predictors of both tested models. When an unbiased ‘corrected’ ability estimate was used as a predictor, the classification as a suspected cheater was irrelevant (p = .23). The remaining effects were significant (p < .001). The lower the ability, or the higher item difficulty, the higher the average time response: The expected response time increased by 3.51 and 2.21 seconds when
 ${\hat{\theta }_c}$ decreased, and b increased, by one point. On the other hand, when a biased ability estimate was used as a predictor, all the coefficients were significant (p < .001). Thus, a suspected cheater, according to the classification obtained using the Modified Z-test, was predictive of item reaction time in the verification stage: Suspected cheaters spent 5.78 seconds more than expected considering the item difficulty, and the assumed ability, than in the UIT stage.
Results of the Two Alternative Multilevel Regression Models, where the Dependent Variable is Item Response Time in Seconds

Note: EST, Regression Weight Estimates; S.E., Standard Errors; T, contrast statistic (EST/S.E.); df, freedom degrees.
Discussion
The detection of cheaters in UIT has provided a solution to the threats regarding the validity of scores that arise in non-controlled applications. Our simulation study provides evidence of the usefulness of the Z-test in the detection of cheating in a specific setting, in which a computerized adaptive test is used to assess English grammar knowledge in the context of personnel selection.
In our simulation study, acceptable Type I error rates were found for the Modified Z-test when applied to the higher ability examinees, but were inadequate for the lower ability examinees (e.g. Type I error rate for  ${\rm{\theta }} = - 1$ was .029). We do not consider these rates to be problematic. Firstly, the cost to both the organization and the individual of hiring a non-appropriate candidate is much larger than the cost of applying 20 additional items to a candidate incorrectly classified as cheater. Secondly, for most expected scenarios, the cut-point for entering the proctored phase will be much higher than –1.
Regarding the power for detecting cheaters, this increased as the cheating effect size ( ${\rm{\Delta \theta }}$) increased. The Modified Z-test exhibited the best performance, indicating that large standard errors for the maximum-likelihood estimate reduced the performance of the Z-test statistic. For the Modified Z-test, the power rates ranged from 65% to 90% in most cases. For the smaller effect sizes and lower ability levels, the power rates were smaller, ranging from 13 to 19%. All these results suggest that some cheating behavior might remain undetected in the current application. There are at least two potential ways of increasing the detection rate: (a) Decreasing the cut off (e.g., using α =.05); and (b) obtaining the distribution of the Z-test statistic by bootstrap (Tendeiro et al., Reference Tendeiro, Meijer, Schakel and Maij-deMeij2013). The Study 1 simulation was repeated setting α =.05. As expected, the power rates increased and were between 75 and 100% in almost all the simulated conditions, with only two exceptions (when detecting the lower cheating size effect in the two lower ability groups). Furthermore, for α =.05, adequate Type I error rates were also found, except for the lower ability examinees where the Type I error rate was 16%.
The study with real data provided additional information on the presence of cheating in unproctored applications and the feasibility of using item response times in order to corroborate whether a decision on suspected cheating is correct or not. The item response times in the verification stage were consistent with the proposed honest vs. cheater classification. Candidates classified as suspected cheaters spent an average of 5.81 seconds longer per item than expected according to their UIT estimated ability. On the other hand, their item response times were consistent with their final corrected estimated ability ( ${{\rm{\hat{\theta }}}_{\rm{c}}}$). So, an overestimated trait level resulting from cheating led to a decrease in the estimated trait level in the verification phase and to aberrant response time patterns (van der Linden & Guo, Reference van der Linden and Guo2008). Additionally, we found that the percentage of suspected cheaters in the empirical study could be estimated at 13.84%. This can be considered a lower limit as the power rate could be low for some conditions. This rate is higher than that obtained in previous studies (Lievens & Burke, Reference Lievens and Burke2011; Tippins, Reference Tippins2015). Furthermore, those candidates classified as suspected cheaters showed a significant decrease in the ability estimate from the UIT to the proctored application. Thus, the use of a validation stage in this process proved to be crucial.
We have also provided some additional evidence for the consistency in our honest vs. cheater classification. Firstly, we showed that there was a high concordance for the Modified Z-test when comparing  ${{\rm{\hat{\theta }}}_{\rm{u}}}$ and
 ${{\rm{\hat{\theta }}}_{\rm{v}}}$ (the ability estimate in the short 10 items verification test) and
 ${{\rm{\hat{\theta }}}_{\rm{u}}}$ and
 ${{\rm{\hat{\theta }}}_{{\rm{v'}}}}$ (the ability estimate in the longer 30 items verification test): Where approximately 96% of suspected cheaters retained their classification. The mean estimated ability in the longer 30 items verification test is higher than the mean obtained in the short 10 items verification test, due in part to the lack of precision and bias of a short computerized adaptive test that administers a first item too difficult for the suspected cheater candidates. The longer verification test corrects both the lack of precision and bias by administering 20 more additional items.
The two-stage procedure tested has additional advantages (Tippins et al., Reference Tippins, Beaty, Drasgow, Gibson, Pearlman, Segall and Shepherd2006). The use of a short verification test reduces item exposure rates. For example, in our study the long verification test was only applied to 132 ‘suspect’ candidates (13.84%). This reduces item overexposure, and saves costs related to item bank renewal.
Despite the advantages of a two-stage procedure, we should bear in mind that the applied Z-test may not provide strong enough evidence of cheating to discard a candidate from the selection process. The use of a short verification test limits the power of the test statistic. When the larger verification test was used, 3.79% of the suspected cheaters were reclassified as non-cheaters. Part the difference found between the unproctored and proctored ability estimates may be due to other factors, such as regression to the mean, because higher scores were selected at the UIT stage (Lievens & Burke, Reference Lievens and Burke2011), changes in anxiety levels, higher motivation or fewer distractions in the proctored setting, practice or test-retest effects, etc. (Tippins, Reference Tippins2015).
As indicated in the introduction, Tippins et al. (Reference Tippins, Beaty, Drasgow, Gibson, Pearlman, Segall and Shepherd2006) considered a few possible combinations of unproctored and proctored administrations in CAT. In what they call concept 4’, a full proctored test is administered to the candidates passing the cut point set by the UIT administration. In ‘concept 5’, a short verification proctored test was administered instead. When the verification test failed, the participant was requested to respond to some more items, in order to obtain their responses to a full test under a proctored administration. In the current paper the ‘concept 5’ scenario has been studied, and we conclude that the tradeoff between the benefits and drawbacks makes this strategy advisable for most testing scenarios in personnel selection. However, when the hiring organization cannot tolerate the percentage of error involved in concept 5, the concept 4 scenario should be applied instead.
One limitation of Study 2 is that it was not possible to advise the candidates that a second proctored test would have to be taken by those passing the cut point, as established by The International Test Commission (2016) guidelines on the security of tests (guideline 11). This circumstance may well lie behind the high rate of flagged suspected cheaters, but it also shows that using UIT, without an ulterior verification testing phase, is a risky practice. In a global survey about testing practices, Ryan et al. (Reference Ryan, Inceoglu, Bartram, Golubovich, Grand, Reeder, Yao, Nikolaou and Oostrom2015) found that the most extended security measures used when administering unsupervised tests were the setting of ‘strict time limits’ and ‘warnings regarding cheating’, which were applied by 59.3% and 40% of the respondents. Verification testing was the fourth method and it was applied by 18.3% of the respondents. Whether cost or other reasons were responsible for this low percentage is something that requires further investigation.
Our study showed a substantial difference between the number of participants taking the UIT and those proceeding to the verification test, which is in agreement with studies conducted with large samples of participants (Lievens & Burke, Reference Lievens and Burke2011; Wright et al., Reference Wright, Meade and Gutierrez2014). This reduction is related to the cut-off point that determines which participants continue in the selection processes, who in reality are usually only those with higher scores in the initial test. However, experimental studies might explore how cheating occurs throughout the continuum of ability and address the strategic aspects of cheating.
Beyond the performance of the proposed Modified Z-tests, as stated earlier in our work, we have found that cheating rates in real selection contexts are higher than those found in previous studies (Kantrowitz & Dainis, Reference Kantrowitz and Dainis2014; Lievens & Burke, Reference Lievens and Burke2011; Tippins, Reference Tippins2015). In this sense, the cultural context in which the participants meet (in this study we used a Spanish sample), the content assessed (in this study an important language skill in selection processes in Spain) and the CAT administration strategies (no warning candidates about the consequences of cheating and no information about the verification test) play an important role in the cheating rates. Cheating found in a particular cultural context, such as the Anglo-Saxon, cannot be directly transferred to a different cultural context. Thus, further research is required to address the different cross-cultural aspects that may affect the development of cheating. Similarly, cheating rates and the ways in which they occur are likely to be different in a cognitive skills test than in a knowledge assessment test, or a personality test. Therefore, it is necessary to analyse the kind of evaluation content, and not only what type of tests, that are more likely to facilitate cheating, in order to advance the particularities that the cheaters adopt in different recruitment and selection contexts. Finally, in the current study, candidates received no information on the consequences of cheating. At the UIT stage they were not aware that they may have to respond to a posterior verification test. As this warning is an important element in cheating prevention (Pace & Borman, Reference Pace, Borman and Griffith2006), this may be one of the causes of the high cheating rate found.
Finally, our study provides important practical implications for recruitment and selection professionals. As mentioned above, the assessment of a candidate’s English skills is an aspect widely used in selection processes in Spain, although using the method of unproctored Internet testing requires for its security, a second stage of validation in a controlled environment. Culturally, job offers in Spain require a good level of English for a large percentage of candidates. However, it is also well known by the candidates that they will not need to use English at work. It becomes an absence of practical consequences once the selection process has been overcome, which can facilitate cheating in UIT contexts. However, the involvement of companies and their professionals in the control of cheating is necessary for the development of a framework to work with secure UITs.