I. INTRODUCTION
Scattered arrays of conductive nanoparticles have been shown to manifest a strong absorption of near-infrared (NIR) light and applied to solar control filters for automotive and architectural windows.Reference Kreibig, Vollmer and Toennies1–Reference Takeda, Kuno and Adachi5 Nanoparticles of transparent conductors such as tin-doped indium oxide (ITO) and antimony-doped tin oxide (ATO) are well-known examples of those conductive nanoparticles, while nontransparent deeply colored powders such as lanthanum hexaboride (LaB6), reduced tungsten oxide (rTO), and hexagonal tungsten bronze (HTB) have recently been reported as a new material.Reference Takeda and Adachi4, Reference Takeda, Kuno and Adachi5 Especially Cs-doped HTB nanoparticles are shown to have the highest visible light transmittance with the strongest NIR absorption among materials known so far.Reference Takeda and Adachi4 With a growing application of these NIR-active nanoparticles, the origin of the NIR absorption has been focused and investigated. Detailed studies of LaB6 by analyzing the optical properties with Mie scattering theoryReference Adachi, Miratsu and Asahi6 and by employing high-energy resolution electron energy-loss spectroscopy (EELS)Reference Sato, Terauchi, Mukai, Kaneyama and Adachi7 have clarified the absorption mechanism to be due to localized surface plasmon resonance (LSPR) of free electrons. For ITO and ATO nanoparticles, LSPR has been considered as responsible as well.Reference Kanehara, Koike, Yoshinaga and Teranishi2, Reference zum Felde, Haase and Weller8
For tungsten oxides, WO6 octahedron comprises a basic structural unit, where a strong electron–phonon interaction is known to activate polarons to absorb visible and infrared lights.Reference Shirmer, Wittwer, Baur and Brandt9–Reference Niklasson, Klasson and Olsson11 Niklasson et al.Reference Niklasson, Klasson and Olsson11 studied the optical absorption of evaporated films of aggregated WO2.7–2.8 nanoparticles and analyzed in terms of polaron absorptions, although a contribution of free electrons was not considered. For Cs-doped HTB, there have not been any reports treating the origin of NIR absorption of its nanoparticle assembly. Thus, this work has been conducted to consider the NIR absorption mechanism of Cs-doped HTB and rTO nanoparticles by measuring the optical constants and analyzing with Mie scattering theory.
II. EXPERIMENTAL
Let us express Cs-doped HTB as CsxWO3 since a Cs ion is incorporated in the regular vacant space in the hexagonal array of the WO6 octahedra by various amounts. In the preliminary study, CsxWO3 and WO2.72 were found to be produced together as mixed after heating in the reducing atmosphere. They are intimately related and thus the materials to examine in this article were chosen to be CsxWO3 (x = 0.05–0.50) and WO2.72 as representing HTB and rTO, respectively. For CsxWO3, x’s of 0.15, 0.25, and 0.33 were mainly investigated since these are about the compositions when the lattice parameter change most in the hexagonal structure as shown later. At x = 0.33, the vacant space in the hexagonal array of the WO6 octahedra is basically fully occupied by Cs ions.
Aqueous solutions of cesium carbonate and ammonium tungstate were mixed and stirred, dried in air, and heated at 800 °C for 1 h under 3%H2/N2 flowing gas in a tubular furnace. This procedure produced CsxWO3 powders of varying cesium content mixed with the Magneli phase WO2.72. For a pure WO2.72 powder, tungsten trioxide was heated at 700 °C for 1 h under 3%H2/N2 flowing gas in a tubular furnace. The powders have been analyzed by x-ray diffractometry (XRD) using Cu-Kα radiation with an apparatus X’Pert-PRO/MPD (Spectris Inc., Tokyo, Japan).
The produced powders have been processed in a bead mill with solvent toluene, small amount of dispersant, and 0.3 mm yttria-stabilized zirconia beads to obtain HTB and rTO nanoparticle dispersions in toluene. These dispersions have been optically monitored with a spectrophotometer (U-4000; Hitachi High-Technologies, Tokyo, Japan). Nanoparticles were observed by transmission electron microscopy (TEM) using model HF-2200 (Hitachi High-Technologies).
For ellipsometry measurements, the powders have been subjected to a hot isostatic press (HIP) at 950 °C for 1 h at compressive stress 250 kgf/cm2 in a vacuum 2.7 × 10⁻⁴ Torr. The compressed disks of 30 × 30 × 5 mm3 were polished on the surface to a mirror finish with no microvoids for fine optical measurements. Variable angle of incidence spectroscopic ellipsometry method has been used with M-2000 ellipsometer (J. A. Woollam, Tokyo, Japan) to obtain dielectric constants of the polished samples.
III. RESULTS AND DISCUSSION
A. NIR absorption in tungsten oxides
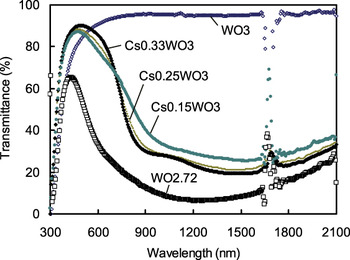
Figure 1 shows transmittance profiles of CsxWO3 (x = 0.15, 0.25, and 0.33), WO2.72, and WO3 nanoparticles dispersed by 0.01 wt% in toluene. WO3 gives a monotonous transmittance profile, showing no absorption in the NIR range. However, when Cs is doped in WO3 or WO3 is reduced to WO2.72, it comes to possess a strong capability of NIR absorption. The large absorption valley is not completely smooth and symmetric, i.e., the absorption origin may not be singular but doubled. These transmittance profiles were converted to molar extinction profiles, and the peak deconvolution program has been applied to obtain two separated peaks as shown later in Fig. 8. The separated extinction peaks are found at around 880 nm (1.4 eV) and 1550 nm (0.8 eV) for CsxWO3 and at around 770 nm (1.6 eV) and 1380 nm (0.9 eV) for WO2.72, respectively. The extinction involves both absorption and scattering, but the present extinction is nearly absorption since the level of measured haze is less than 1%.
Transmittance profiles of CsxWO3 (x = 0.15, 0.25, and 0.33) and WO2.72 nanoparticles dispersed by 0.01 wt% in toluene. Toluene absorption makes disturbance at wavelength between 1620 and 1790 nm. (color online)

The large absorptions shown in Fig. 1 have resulted from either a doping or a reduction applied to WO3. That is, WO3 becomes bluish colored from neutral by the operation of doping or reduction, since the absorption bands are broad to cover not only NIR, but part of red and green. Thus, the NIR absorption of HTB and rTO is intimately related with the bluish coloration of WO3.
A massive amount of reports have been made thus far on the bluish coloration of WO3.Reference Bange12, Reference Granqvist13 The coloration is introduced by operations such as an exposure to hydrogen, alloying with Na and other alkali and alkali earth elements, reduction by acidic electrolytes, application of direct current (electrochromism), irradiation with proton ion beam, ultraviolet irradiation, bombardment of electron beam, simple heating of powders embedded by resins, etc. These various procedures are all considered as the reduction treatment, i.e., the one to introduce electrons to the host lattice of WO3. Electrons are introduced either directly, via dissociation such as Na → Na+ + e−, or via radicals produced in the matrix resins. Then the question is how electrons introduced in WO3 could come to bring the large NIR absorption.
For Na-doped tungsten bronzes and electrochromic WO3 films, various mechanisms have been proposed to account for this question. The proposals may be categorized into the following three models. The NIR absorption is proposed to be caused by:
(i) A polaron to couple localized electrons and phonons.Reference Shirmer, Wittwer, Baur and Brandt9–Reference Deneuville and Gerard14 The introduced electrons reside W6+ ions to produce W5+ in effect and distort lattice by repelling the surrounding O2− ions. External NIR lights can be absorbed by an electronic transition of polarons in localized levels to the conduction band or by a hopping of polarons at W5+ to nearby W6+ sites.
(ii) An excitation of π* electrons in the conduction band to higher-lying conduction subbands of either σ* states or Na+ states (referred to as the Green–Travlos modelReference Green and Travlos15).
(iii) Free electron absorptionReference Shirmer, Wittwer, Baur and Brandt9, Reference Miyakawa, Hosono and Kawazoe16 or LSPR of free electrons in the conduction band for nanoparticles.
Both CsxWO3 and WO2.72 possess full of electrons and will be activated by either of the models (i), (ii), or (iii).
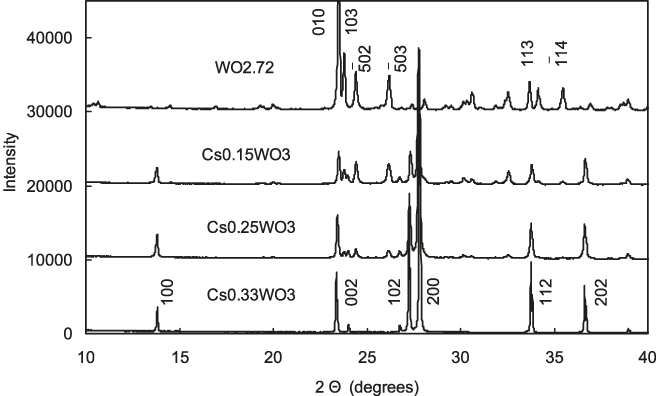
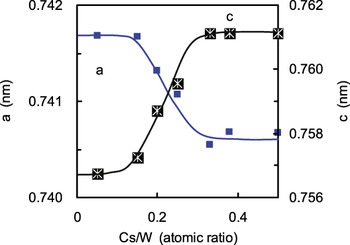
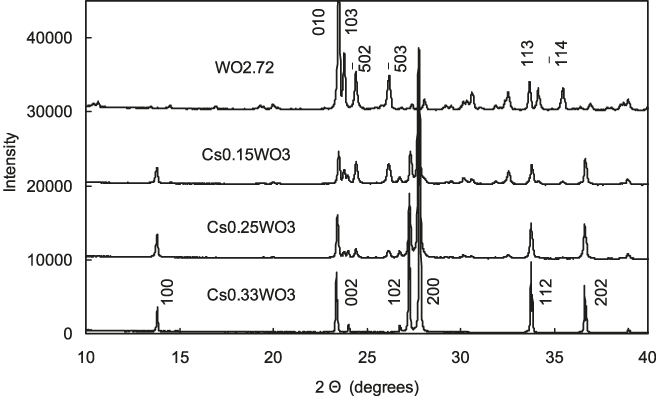
Figure 1 implies that decreasing amount of Cs in CsxWO3 modifies the transmittance profile as approaching to WO2.72. XRD measurements have shown that Cs0.33WO3 and WO2.72 are purely hexagonal and monoclinic structures, respectively, whereas Cs0.25WO3 and Cs0.15WO3 contain the both structures, HTB+WO2.72, as shown in Fig. 2. Microstructures of HTB added with K, Rb, and Cs were investigated by Hussain,Reference Hussain17 who provided a phase diagram at high temperatures 700–1000 °C. According to his phase diagram, Cs0.25WO3 is suggested to be single-phased HTB and Cs0.15WO3 should be either HTB+WO3 or HTB+ intergrowth tungsten bronze (ITB). The present result gives HTB+WO2.72 and disagrees with the Hussain’s phase diagram, which is considered to be due to a difference in the heating environment. In the present experiment, the reducing atmosphere has produced WO2.72 instead of WO3 or ITB. TEM and scanning electron microscopy observations were also used to confirm that the microstructures of HTB+WO2.72 in Cs0.25WO3 and Cs0.15WO3 are two-phased with globular HTB and plate-like WO2.72 phases, respectively, but are not ITB of fine lamellae HTB and WO2.72. Although Cs0.25WO3 and Cs0.15WO3 are two-phased, the partition of Cs goes mostly to globular HTB. This has been confirmed by energy-dispersive x-ray microanalysis as well as in the change in lattice parameters of HTB phase with the amount of Cs in CsxWO3, as shown in Fig. 3. An increasing amount of Cs incorporated in HTB leads to the expansion of c-axis and slight shrinkage of the basal plane. The variation of lattice parameters on increasing Cs ceases at around Cs/W = 0.33.
X-ray diffractometry profiles of hot isostatic pressed discs showing monoclinic Magneli phase of WO2.72, hexagonal bronze phase of Cs0.33WO3, and mixed patterns otherwise.
Change in lattice parameters of hexagonal CsxWO3 with gross content of cesium. (color online)

B. Dielectric functions of CsxWO3 and WO2.72
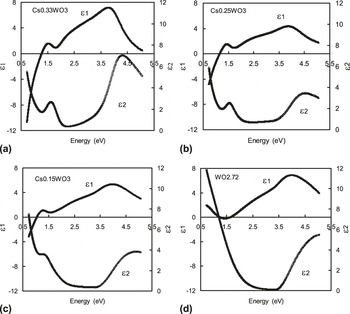
The dielectric functions of CsxWO3 and WO2.72 measured are shown in Fig. 4. For completely free electrons, ε1 will diverge to −∞ and ε2 to +∞ at E ≪ 1, and this tendency is observed for CsxWO3. For WO2.72, the same tendency is seen in ε2, but an apparent peak may have obscured the tendency in ε1. Thus, an abundance of free electrons is suggested both for CsxWO3 and WO2.72. For all the samples, relatively large peaks are observed in ε2 at around 4.5 eV, which should correspond to the interband transition from the valence to conduction band. The band gap energy has been determined more precisely by employing the Tauc plot to be 3.32, 3.09, 2.91, and 3.01 eV for WO2.72, Cs0.15WO3, Cs0.25WO3, and Cs0.33WO3, respectively.
Dielectric functions of CsxWO3 (x = 0.15, 0.25, and 0.33) and WO2.72 determined by means of spectroscopic ellipsometry.

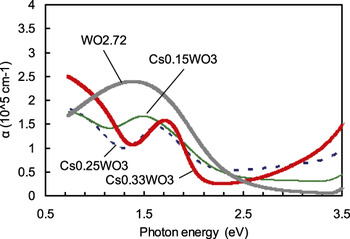
On the other hand, a small peak is noticed at around 1.5 eV in Figs. 4(a)–4(c), appearing below the band gap energy. In WO2.72, this peak is not apparent in the plot of ε2 but becomes evident when absorption coefficient α is derived from the dielectric functions as shown in Fig. 5. α is peaked at 1.4 eV for WO2.72, and its peak profile is asymmetrical. These features are in accordance with those reported as the polaron absorption. Antonaia et al.Reference Antonaia, Santoro, Fameli and Polichetti18 directly measured absorption coefficient of evaporated WO2.83 films to detect small polaron peak at 1.5 eV. Salje and GuttlerReference Salje and Guttler10 measured diffuse reflectivity of pressed pellets of WOx (2.72 ≤ x ≤ 3.0) and showed absorption peaks due to polarons at 1.1 eV for WO2.72. Deneuville and GerardReference Deneuville and Gerard14 reported polaron-type absorption at 1.38 eV in evaporated amorphous HxWO2.72 thin films annealed at 350 °C. The observed polaron energies in tungsten oxides are scattered depending on experiments at 0.6–1.5 eV. With those observations, we may attribute the peak at 1.4 eV for WO2.72 shown in Fig. 5 to polaron absorption. CsxWO3 have similar peaks around 1.5–1.7 eV in α as shown, and they can similarly be attributed to polaron absorption. The WO6 octahedron is a common structural unit comprising the crystal structures of WO3, WO2.72, and CsxWO3 that is considered to host polarons.
Absorption coefficients in the low-energy region of CsxWO3 (x = 0.15, 0.25, and 0.33) and WO2.72 showing peaks due to polaron absorption. (color online)

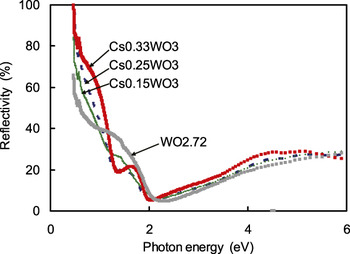
In contrast to the polaron peak at 1.4–1.7 eV in Fig. 5, the major NIR absorption valley in Fig. 1 (or peak in Fig. 8) is centered at smaller energy at around 0.8 eV (1550 nm) for CsxWO3 and 0.9 eV (1380 nm) for WO2.72. At 0.8 eV and 0.9 eV, ε2 does not show any absorption peaks for CsxWO3 and WO2.72, respectively, in Fig. 4. Therefore, the major NIR absorption in CsxWO3 and WO2.72 is not an intrinsic absorption but considered to be the absorption emerged by the interaction of free electrons in nanoparticles with an external electromagnetic wave, i.e., LSPR. The abundance of free electrons is suggested from the profiles of reflectivity, which has been measured for the polished disks and presented in Fig. 6. Reflectivity curves show apparent minima around 2 eV and steep increases at less energy than the minima, and this behavior is characteristic of a plasma of free electrons although they are modified by the presence of small polaron-related peaks around 1.5 eV.
Measured reflectivity of CsxWO3 (x = 0.15, 0.25, and 0.33) and WO2.72. (color online)

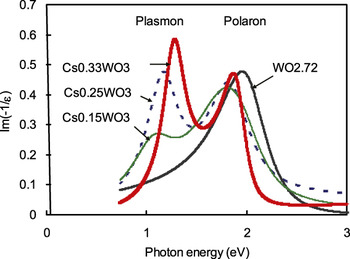
The electron-energy-loss function is given by Im(−1/ε) = ε2/(ε12 + ε22) and those of CsxWO3 and WO2.72 have been calculated from the measured ε to be plotted in Fig. 7. The loss function is proportional to the probability of fast electrons to lose energy in passing through a bulk crystal. Doubly peaked profiles of loss functions are shown for CsxWO3. The peaks at lower energy around 1.1–1.3 eV are attributed to bulk plasmons since ε1 goes through zero and the peak height of the loss function decreases with decreasing Cs/W, i.e., decreasing amount of free electrons. On the other hand, the peaks at higher energy around 1.8–2.0 eV may be assigned as polarons. The peak energies of the plasmon and polaron peaks are slightly higher than the actually observed values, 0.8 and 1.5 eV, respectively. This is ascribed to the fact that the expression of the loss function is for a bulk crystal while the observed values are for assemblies of nanoparticles. Thus, for CsxWO3, two kinds of absorption mechanisms are considered to exist; plasmons and polarons. Shirmer et al.Reference Shirmer, Wittwer, Baur and Brandt9 observed that evaporated amorphous WO3 layers show a small polaron absorption at 1.2–1.3 eV, while annealed and crystallized samples changed the absorption mode to the free electron absorption at less energies, 0.5–0.7 eV. Thus, a concurrent activation of both localized electrons of polarons and free electrons of plasmons at different energies could also be expected.
Energy loss functions derived for CsxWO3 (x = 0.15, 0.25, and 0.33) and WO2.72 showing bulk plasmon and polaron peaks, respectively. (color online)

While for WO2.72, only a polaron peak shows up and a plasmon peak is not seen in Fig. 7. This contradicts with the reports of abundant free electrons in WO2.72Reference Salje and Guttler10, Reference Viswanathan, Brandt and Salje19 as well as the presently measured reflectivity profiles. It is suspected that a surface oxidation of WO2.72 may have occurred in the ellipsometry specimen that modified the surface toward WO3 of scarce free electrons, leading to the apparent loss of plasmon peak.
C. Comparison with Mie scattering theory
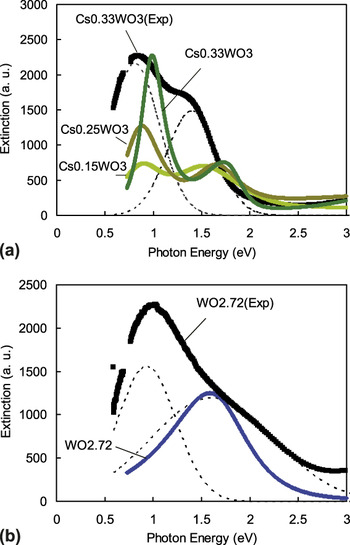
Using the Mie scattering theory and the determined dielectric functions, extinction cross sections have been calculated by the method of Boren and HuffmanReference Boren and Huffman20 for a single small particle of assumed size and directly compared with the observed extinction profiles of the dispersions. In Fig. 8, the result of a Mie calculation for a particle of typical size, 20 nm, is shown for (a) CsxWO3 and (b) WO2.72. They are accompanied by the experimental dispersion extinction profiles for Cs0.33WO3 and WO2.72 that are deconvoluted into two peaks corresponding to plasmons and polarons, respectively. The plasmon and polaron energies are read as 0.8 and 1.4 eV for Cs0.33WO3 and 0.9 and 1.6 eV for WO2.72, respectively. It is clear that the calculated set of double peaks for CsxWO3 agrees qualitatively with the experimental profile, although the peak positions show deviations toward high energy and peak widths are narrower than observed. On the other hand, only a single peak is calculated for WO2.72 despite the two peaks observed experimentally. The single peak matches well with the polaron peak. The reason for the absence of plasmon peak is unclear, although the surface oxidation of the ellipsometry specimen is speculated as the possible cause. If the surface thin layers were oxidized to have WO3 instead of WO2.72, the loss of free electrons will predict the loss of plasmon peak in the Mie calculation.
Experimental extinction profiles of nanodispersions with peak separation in dotted lines for CsxWO3 (x = 0.15, 0.25, and 0.33) and WO2.72 particles, as compared with extinctions calculated using Mie scattering theory for a single 20 nm particle. (color online)

The difference in peak energy and peak width between calculation and experiments for Cs0.33WO3 is noted in Fig. 8. There are several factors that could affect the peak energy and width, including particle size, particle shape, dipole–dipole interaction between particles, particle coagulation, numbers of effective particles, etc. In the case of LaB6, the particle shape and its enormous numbers concerned have been discussedReference Adachi, Miratsu and Asahi6 to be the decisive factor for the peak energy and width. For Cs0.33WO3, however, the particle shape has been observed as nearly spherical, and instead the most important factor is suspected to be the large number of effective particles. The number of particles concerned is roughly one order of magnitude larger for Cs0.33WO3 than LaB6, considering the molar absorption coefficient for LaB6 larger than that for Cs0.33WO3 by roughly one order of magnitude.Reference Takeda and Adachi4 The electronic state of individual particles should be slightly varied particle by particle as Cs might be devoid of near the particle surface and the reduction state would be different depending on particle. This effect could well lead to the shift of the peak energy as well as the expansion of the peak width experimentally.
The Green–Travlos model assumes free electrons are excited to higher states in the conduction band. However, it is considered unlikely in the case of CsxWO3 and WO2.72 since ε2 presents no extra absorption peak arising from this interband transition. Free electrons in the conduction band are supposed to cause the LSPR absorption, but no evidence of electronic transitions is observed.
Summarizing the above discussions, a rough sketch of plasmon- and polaron-related behaviors in Cs-doped HTB and rTO nanoparticles in terms of energy band can be made as follows. When WO3 is reduced, electrons are introduced to form localized levels below the conduction band. Electromagnetic wave of NIR wavelengths is absorbed by the polaron mechanism, which operates in a way the localized electrons at W5+ are either excited to conduction band and/or subjected to hopping to the adjoining W6+ site. In a further reduced WO2.72, the introduced electrons not only form the localized levels but are accommodated as free electrons in the conduction band. The experimental extinction profile of WO2.72 nanoparticle aggregate implies the occurrence of the LSPR excitation although the measured dielectric function provided only the indication of polaron absorption due probably to the surface oxidation. When Cs is incorporated to WO3, crystal structure changes from monoclinic to hexagonal and Cs dissociates, Cs → Cs+ + e-, providing electrons both to the localized levels as well as to the conduction band. At Cs/W = 0.33, the maximum number of electrons supposedly occupies in the conduction band and the LSPR absorption becomes the major absorption mode for nanoparticles, while the polaron absorption providing a smaller contribution. Naturally more work is required to further confirm the view described herein less ambiguously.
IV. CONCLUSIONS
For Cs-doped HTB and WO2.72, the absorption coefficients indicate the peaks originated from polarons at 1.4–1.7 eV, while reflectivity profiles, although modified by the polaron peaks, suggest a plasma of free electrons. For Cs-doped HTB, the energy loss function and the extinction cross section derived from the Mie analysis, both present the double peaks which are considered as arisen from plasmons and polarons. Therefore, the origin of the shouldered extinction peaks observed for Cs-doped HTB and WO2.72 nanoparticle assemblies is considered to be a concurrent activation of both plasmons and polarons.
ACKNOWLEDGMENTS
The authors appreciate the cooperation of Takeshi Chonan in preparing the HIP specimens. They also thank Profs. Masami Terauchi and Yohei Sato of Tohoku University for helpful discussions.