

Scholars have long analyzed the effect of inclement weather on presidential election turnout and on parties’ vote share. Ludlum (Reference Ludlum1984) documents several instances in which inclement weather has been claimed to be decisive in swinging election results. A notable case is the 1960 presidential elections, when a cold front in swing states appeared to be the critical factor enabling Kennedy to win by a razor-sharp margin over Nixon.
Most of the literature focuses on the effect of weather on voter turnout and on the impact of turnout on the Democratic versus Republican share of the vote (De Nardo, Reference DeNardo1980; Gomez et al., Reference Gomez, Hansford and Krause2007; Knack, Reference Knack1994). However, as found by Horiuchi and Kang (Reference Horiuchi and Kang2018), the effect of weather on parties’ vote share is greater than can be explained by differential turnout.Footnote 1 They suggest that the effect of weather on elections can be decomposed into two different components: the effect on turnout and the effect on vote choice. While the former has received attention in the literature, the latter has not yet been investigated. This article constitutes the first attempt to analyze the mechanism through which election day weather affects not the decision to vote, but the candidate the voter selects.
A growing body of research spanning several disciplines has documented that environmental factors can affect cognitive processes and individual behavior. The effect of weather on decision-making activity has been investigated by Hirshleifer and Shumway (Reference Hirshleifer and Shumway2003), who document that daily nominal returns on a nation’s stock index are negatively associated with the level of (above average) daily cloudiness in the city where the national stock market is located; Kamstra et al. (Reference Kamstra, Kramer and Levi2003), who document a seasonal affective disorder (SAD) effect in the seasonal cycle of stock returns; and Kramer and Weber (Reference Kramer and Weber2012), who find that people who suffer from SAD displayed significantly stronger preferences for safe choices during the winter than during the summer. Bassi et al. (Reference Bassi, Colacito and Fulghieri2013) propose and test a possible mechanism through which weather affects financial decisions and economic behavior: sunshine promotes risk-taking behavior, while overcast conditions enhance risk-aversion.
Risk attitudes and uncertainty play an important role in determining voting behavior (Morgenstern and Zechmeister, Reference Morgenstern and Zechmeister2001; Nadeau et al., Reference Nadeau, Martin and Blais1999; Shepsle, Reference Shepsle1972). Voters need to forecast both the set of feasible actions that candidates might take once elected, and the probability that those actions will be carried out. Candidates can be perceived to carry different degrees of risk. For example, voters might believe that an incumbent is less risky than a challenger because they have more information about the incumbent and feel they can better anticipate his/her future actions (Bernhardt and Ingerman, Reference Bernhardt and Ingerman1985; Shepsle, Reference Shepsle1972). Candidates with experience in executive offices might also be considered less risky because they are more likely to be competent. Candidates with ambiguous policy positions, instead, may be perceived to be risky, because voters are uncertain about their true policy stances (Palfrey and Poole, Reference Palfrey and Poole1987 and Tomz and Van Houweling, Reference Tomz and Van Houweling2009). Finally, candidates’ cohesion with the party establishment may signal a lower degree of riskiness if voters believe the party will support the candidate once in office. All of these factors contribute to the “perceived riskiness” of a candidate. Hence, environmental factors might affect vote choice by enhancing or haltering voters’ tolerance to risk. For example, we might think that inclement weather negatively affects the election prospects of risky candidates by making voters less tolerance to risk.
Voter behavior in risky environments is also affected by the state of the world: Kahneman and Tversky’s prospect theory (Reference Kahneman and Tversky1979) postulates that when agents believe themselves to be acting in a relatively good state (positive prospect), they are less likely to take risks that could result in the dissipation of gains; in contrast, when agents believe the state to be a relatively bad one (negative prospect), they are more likely to take risks that could result in the avoidance of losses. Quattrone and Tversky (Reference Quattrone and Tversky1988) and MacKuen et al. (Reference MacKuen, Erikson and Stimson1992) find evidence of this effect: when the economy is up or doing better than expected, voters lean toward the incumbent rather than toward riskier challengers.
To study the effect of weather conditions and prospects on vote choice, I conduct a series of experiments in which subjects are asked to vote in a set of elections between two candidates, one characterized as free of risk and one as risky. The results identify a sizeable and statistically significant effect of weather on individual vote choice. Inclement weather increases the likelihood that voters will choose the risk-free candidate by an average of 15% in both prospects.
This article contributes to the literature first by establishing the effect of weather on risk attitudes not only in positive, but also in negative prospects, in which agents are expected to be less averse to risk, or even risk seeking. Second, it sheds light on the mechanism that links weather and voting choice by providing evidence that weather affects voters’ mood and that, in turn, mood affects voters’ willingness to accept risks and to vote for candidates who are perceived as more risky. Last but not least, it contributes to the prospect theory literature by finding that the incidence of reflection behavior around the reference point is reduced when reference points only affect prospects’ perceptions but not objective prospects’ payoffs.
THE EXPERIMENTAL DESIGN
The experimental design of this study builds on the classic study of Quattrone and Tversky (Reference Quattrone and Tversky1988), in which two candidates with identical policy preferences but different degrees of riskiness are compared in a positive and a negative prospect. Subjects are tasked to vote in their country’s election for one of the two candidates. The design extends this baseline framework in two important ways. First, choices are consequential and affect subjects’ earnings. This increases the salience of the experiment and gives more internal validity to the results (Holt and Laury, Reference Holt and Laury2002). Second, subjects participate in multiple elections, allowing for a more accurate measurement of the extent to which weather affects vote choice.
To help subjects interpret the task as an actual voting decision rather than as an abstract choice, the risky candidate is labeled “challenger” while the risk-free candidate is labeled “incumbent.”Footnote 2 For each of the two candidates, subjects were provided with two experts’ forecasts of what their payoff would be should a candidate win the election.Footnote 3 While the payoffs forecasted by the experts for the incumbent are identical, they differ for the challenger, generating a positive variance and riskiness for the latter.
I operationalize positive and negative prospect treatments by providing information about the payoff yielded in other comparable countries, thereby creating a so-called “reference point.”
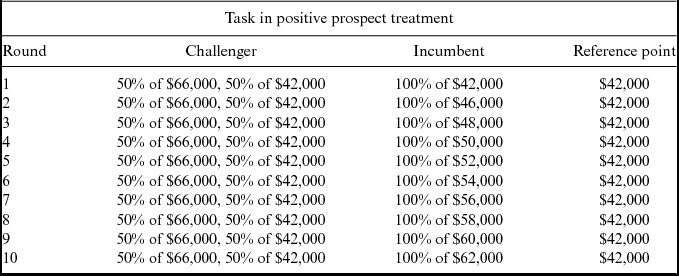
In Table 1, I describe the experimental task. Subjects are asked to choose 1 of the 2 candidates in 10 different election rounds. The matrix of payoffs is set up in such a way that a risk-neutral subject would choose the challenger as long as the expected utility is higher than the expected utility of choosing the incumbent (in the first five rounds), he/she be indifferent in the sixth round, and then he/she would switch to voting for the incumbent (in the last four rounds). The rightmost column reports the payoff generated in comparable countries used in the positive prospect treatment.Footnote 4 The simplicity of this task, in which subjects compare a sure option (incumbent) with an option that yields two potential payoffs with equal probability (challenger), reduces subjects’ cognitive effort and confusion to a minimum, yielding higher internal validity compared to designs that use more complex tasks (as in Bassi et al., Reference Bassi, Colacito and Fulghieri2013).
Payoff Tables—Risk Aversion Elicitation
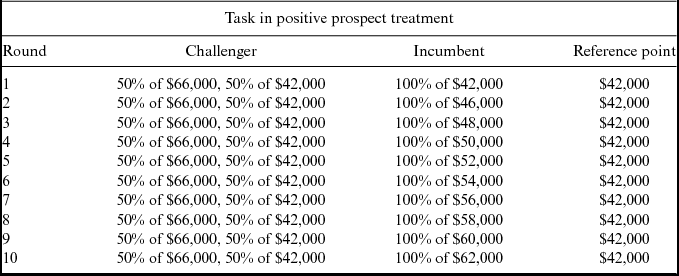
Note. This table reports the payoffs in each of the rounds. The “Challenger” column describes the payoffs that the challenger are predicted to yield and their likelihoods. The “Incumbent” column describes the payoff that the incumbent is predicted to yield. The rightmost column describe the payoff yielded by candidates in comparable countries that was provided to the subjects as reference point in the positive prospect treatment. In the negative prospect treatment, everything remain the same but for the reference point which is $66,000 for all ten rounds.
After all subjects completed the experimental task and before being paid, subjects were asked to complete a questionnaire about socioeconomic characteristics, political leaning, and weather assessment.Footnote 5 In addition, beginning in August 2012, subjects were also asked to complete a math quiz and a PANAS-X affect scale form to measure their mood. The Online appendix provides details about experimental procedures and instructions, and the specifics of the experimental sessions, including weather data.
A within-subject design, in which every subject participated in both prospect treatments sequentially, was used to analyze the prospect effects, while a between-subject design was used to analyze the weather effects.Footnote 6 To randomize the subjects between good and bad weather treatments, I scheduled twin pairs of experimental sessions per week on days with the largest spread of forecasted likelihood of precipitation or sunshine. Subjects were asked to register for both sessions but were told that they would be ultimately selected to participate in only one of the two sessions. Subjects were randomly allocated by the experimenter to one of the two sessions.
A total of 199 participants were recruited from December 2011 to January 2013, with 166 subjects actually participating in the experiment. The participation rate was very similar across weather sessions, with 85.2% and 81.7% of the registered subjects participating in the bad and good weather treatments, respectively. The null hypothesis of a balance test to investigate whether the characteristics of the subjects participating in the good versus bad weather sessions are identical cannot be rejected (p value of 0.84). In Online appendix Table A.2, I report the demographics of the respondents in the good and bad weather treatments, and in Table A.3, I report the details of the balance test.
THEORETICAL EXPECTATIONS AND EXPERIMENTAL RESULTS
Consistent with Quattrone and Tversky (Reference Quattrone and Tversky1988), I expect subjects to choose the candidate who carries the least risk in the positive prospect and the candidate who carries the most risk in the negative prospect.
Hypothesis 1 (Prospect effect). The vote share for the risk-free candidate is larger than the vote share for the risky candidate in a positive prospect, but smaller in a negative prospect.
Furthermore, consistent with the results of Bassi et al. (Reference Bassi, Colacito and Fulghieri2013), I expect bad weather conditions to positively affect the likelihood of choosing the less-risky option in a positive prospect. Although no previous research has established the effect of weather in a negative prospect, I expect that inclement weather will affect the probability of voting for the less-risky option in the same direction in both the positive and negative prospects.
Hypothesis 2 (Weather effect). The vote share for a risk-free candidate is larger in bad-weather days than in good-weather days in both positive and negative prospects.
Prospects can enhance the weather effect: a negative prospect is expected to boost the effect of good weather (in which subjects are expected to be most tolerant of risk), while a positive prospect is expected to intensify the effect of bad weather (in which subjects are expected to be most averse to risk). However, prospects can also hinder the weather effect: a positive (negative) prospect is expected to moderate the effect of good (bad) weather.
Prospect effects
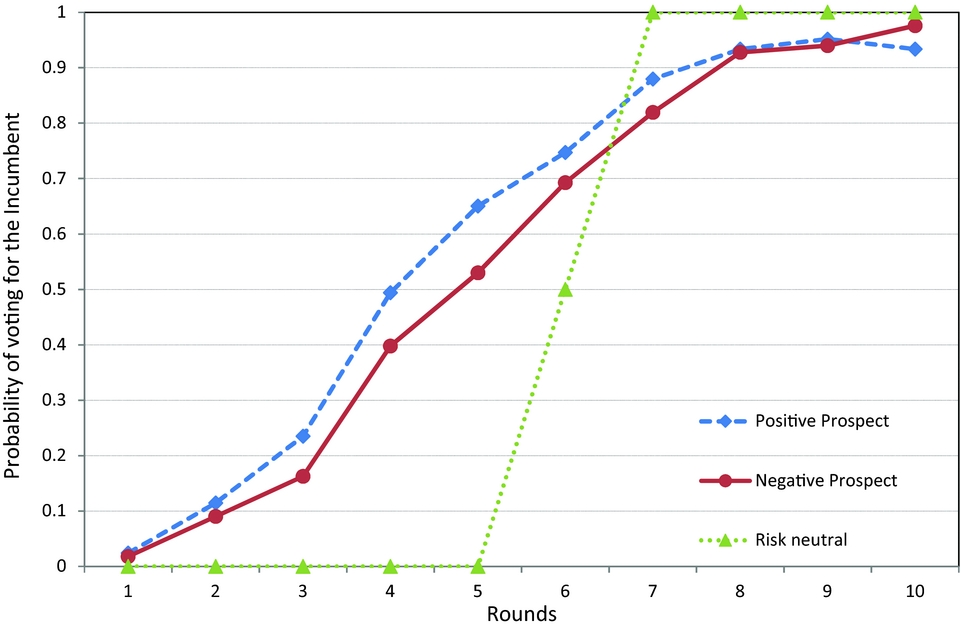
In Figure 1, I report the distribution of the votes for the risk-free candidate (incumbent) across 10 rounds for both prospects. Although subjects appear to be risk averse in both prospects, the likelihood of choosing the risk-free candidate is smaller in the negative than in the positive prospect (on average 5.55 and 5.96, respectively, across the 10 rounds). This difference is statistically significant according to a Welch test (p value of 0.018).
Probability of Voting for the Risk-Free (Incumbent) Candidate, by Round. The Vertical Axis Reports the Percentage of Votes for the Risk-Free (Incumbent) Candidate. The Horizontal Axis Reports the Number of the Round. The Blue Dashed Line Refers to Observations in the Positive Prospect; the Red Solid Line Refers to the Negative Prospect. The Dotted Green Line Depicts, as a Benchmark, the Votes that a Risk-Neutral Agent would Cast.
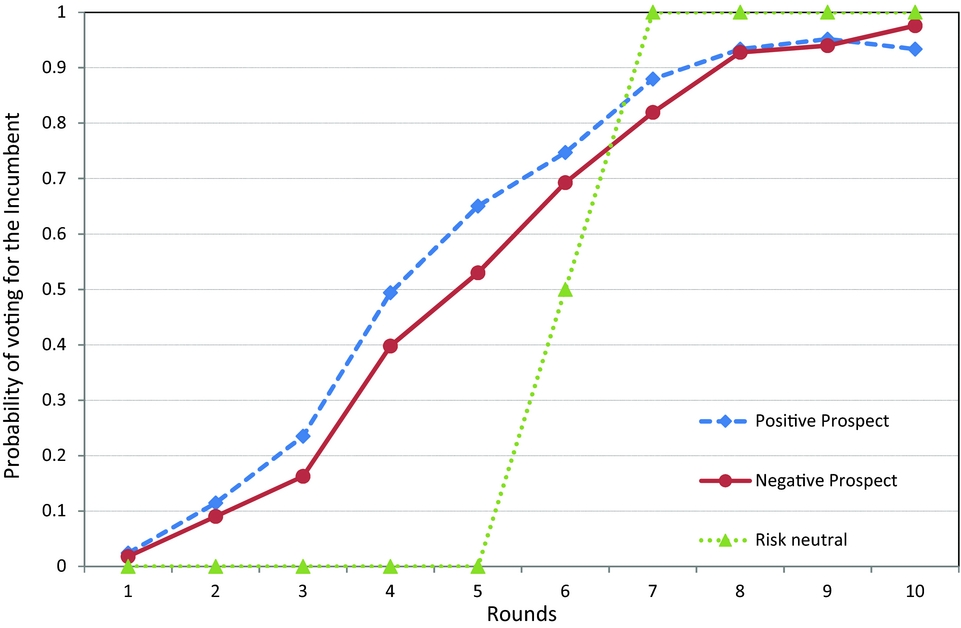
Although the prospect effect is significant, the results are not consistent with hypothesis 1. The difference between these results and the findings of Quattrone and Tversky (Reference Quattrone and Tversky1988) might be explained by the use of real—rather than hypothetical—incentives, which reduces the incidence of reflection behavior around the reference point (Laury and Holt, Reference Laury, Holt, Cox and Harrison2008).
Weather effects
Even though the random assignment of subjects to the forecasted weather sessions avoids self-selection biases, the experimenter cannot fully control for the allocation of actual weather conditions. Ideally the actual weather conditions would match the forecasted conditions. However, since the experimental sessions were planned (and the subjects recruited) 1 or 2 weeks prior to the experimental sessions, forecasted and actual weather conditions did not always coincide. Because the focus of this study is the effect of the effective weather to which the subjects were exposed on the day of the experiment, I use actual weather data in my analysis rather than forecasted ones.Footnote 7 Four definitions of weather quality are used.
First, the amount of sunlight has proved to be critical in affecting individual behavior by Hirshleifer and Shumway (Reference Hirshleifer and Shumway2003). Following their approach, I collected data on the number of minutes the sky was clear (including scattered and partly cloudy) or overcast (including mostly cloudy or rainy) between 7 a.m. and the time of the end of the experiment (all experimental sessions have been run between 2 p.m. and 4 p.m.). A good weather day is defined as one in which the sky was clear for more than 50% of the time. This measure is referred to as “objective weather.”
Because subjectivity plays a key role in assessing the perceived quality of weather, I used subjects’ answers to the questionnaire item “How do you feel about the weather today?” as a measure of perceived weather. Subjects were asked to rate the weather on a scale from 1 (Terrible) to 7 (Awesome). I assume a good weather day to be described with scores higher than 4 (fair) and a bad weather day to be described with scores lower than 4. This assessment of the weather condition is referred to as “subjective weather.”
Precipitation provides a third indicator of the quality of weather. Consistent with Gomez et al. (Reference Gomez, Hansford and Krause2007), who measure rainfall relative to the average precipitation in the area of study, I define a bad weather day as one in which the amount of rainfall exceeds the average daily amount (0.12 inches in the area in which the experiment was conducted). This measure is referred to as “relative precipitation.” Absolute rainfall is also considered, with presence or absence of rain defining bad or good weather, respectively. This measure is referred to as “absolute precipitation.”
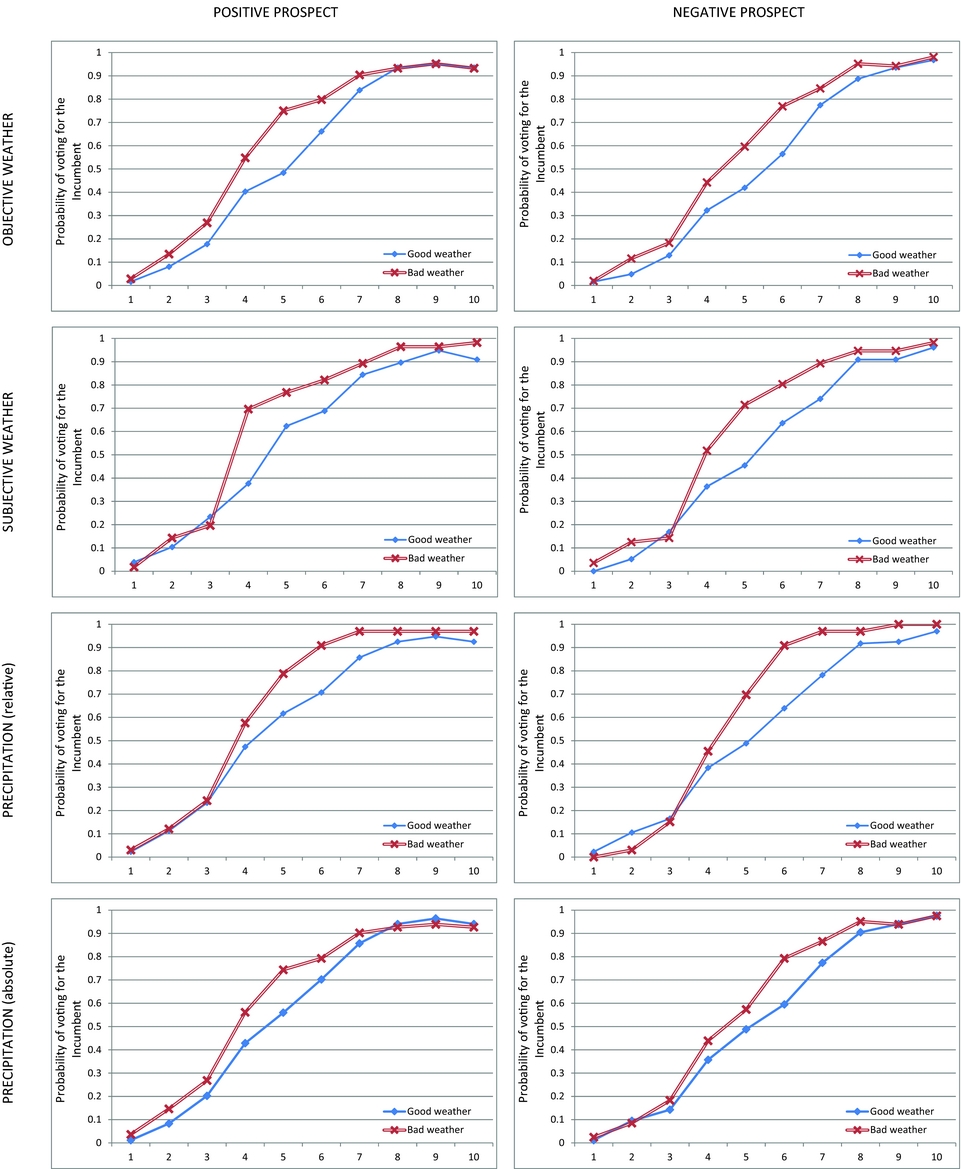
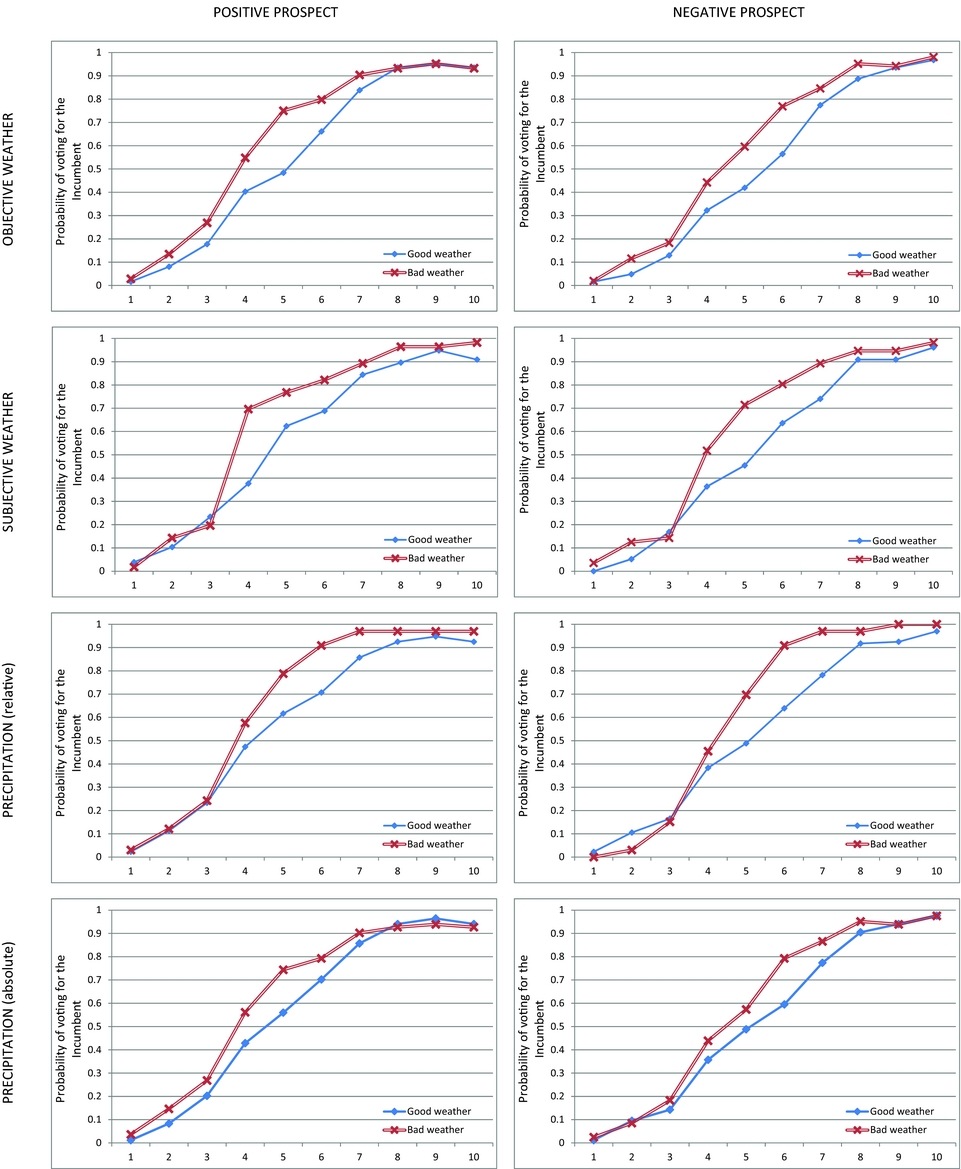
In Figure 2, I report the raw data on the effect of weather. In all panels, bad weather conditions produce a leftward shift of the frequency lines, suggesting support for hypothesis 2. The impact of weather is especially pronounced in rounds 4–7, in which the two candidates’ expected values are very similar, and in which one would expect the majority of subjects to start switching from the risky to the risk-free candidate.
Probability of Voting for the Risk-Free (Incumbent) Candidate, by Weather Treatment. The Vertical Axes Report the Percentage of Votes for the Risk-Free Candidate. The Horizontal Axes Reports the Number of the Round. In Each Panel, the Blue Single Line and the Red Double Line Describe Observations in the Good and Bad Weather Treatments, Respectively. The Left and Right Panels Refer to Observations in the Positive and Negative Prospect Treatments, Respectively. Observations are Grouped by Weather Measure. Starting from the Top, the First Plots Refer to Subjective Weather Assessments; the Second to Objective Measures; and the Third and Fourth to Relative and Absolute Precipitation Measures, Respectively.
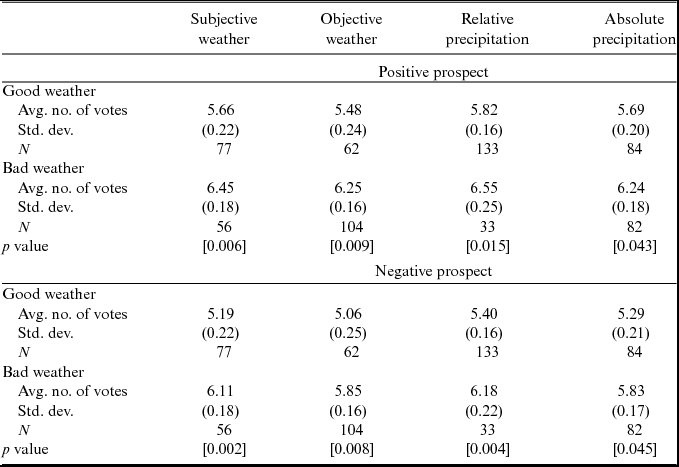
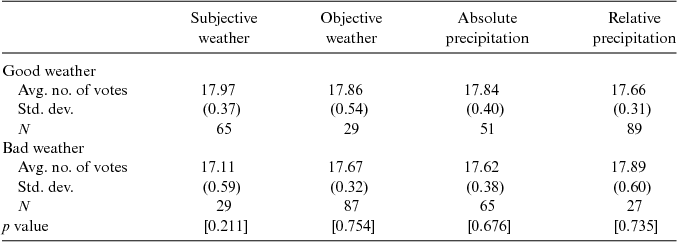
To assess whether the differences shown in Figure 2 are statistically significant, I calculate the average number of votes for the risk-free candidate and the Welch test t-statistics for the null of identical number of votes across treatments. The differences in vote choice between good and bad weather are statistically significant at conventional levels for all measures of weather conditions. In Table 2, I report the results of the test.Footnote 8 Consistent with hypotheses 1 and 2, agents are shown to be more likely to vote for the risk-free candidate in positive prospects and with inclement weather conditions.
Average Frequencies of Votes for Incumbent
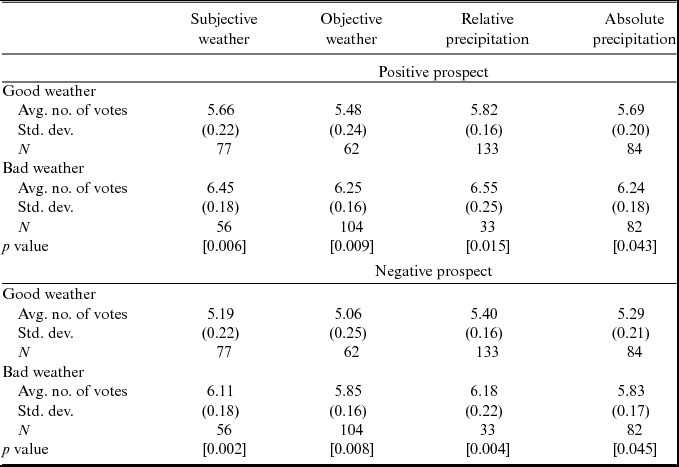
Notes. This table reports the average number of votes for the risk-free candidate (incumbent), the standard deviation of the mean (in parentheses), and the number of observations across the ten elections for each prospect and each weather conditions. The last row reports the p values (in brackets) of the Welch test for the null hypothesis that the mean in good weather conditions is equal to the mean in bad weather conditions.
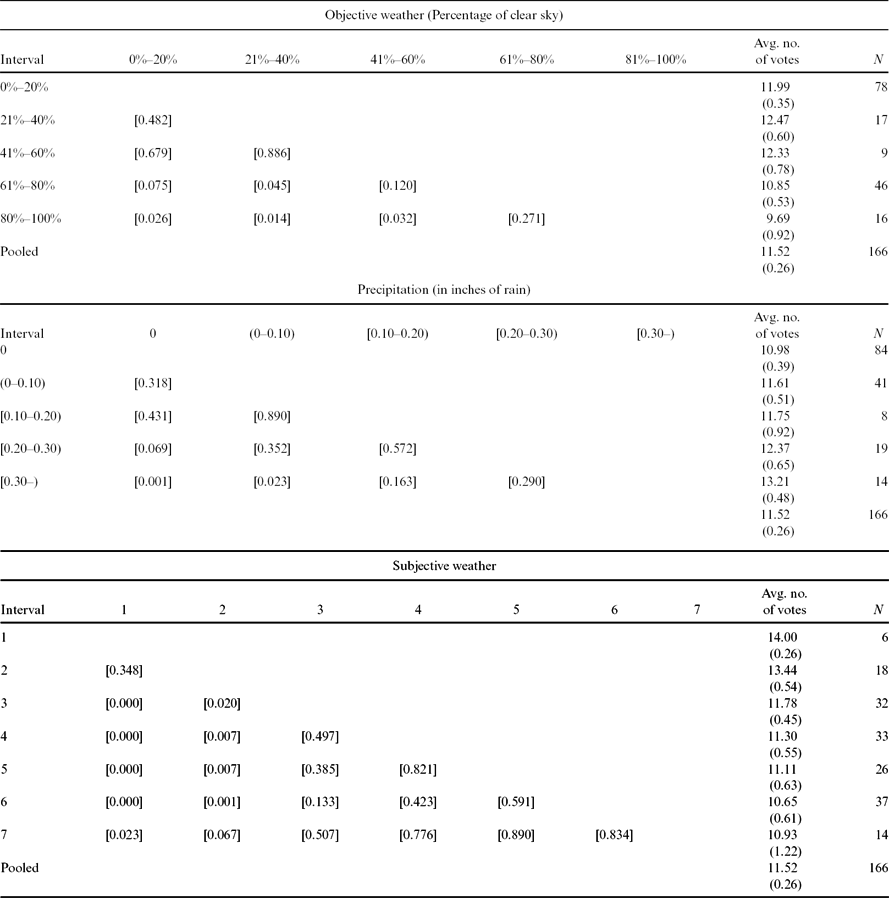
To analyze more accurately the effect of weather conditions on vote choice, I categorize the objective weather measure and the precipitation measure into quintiles, and the subjective weather into the seven questionnaire levels (see Table 3).
Interval Levels Categorization of Weather Conditions
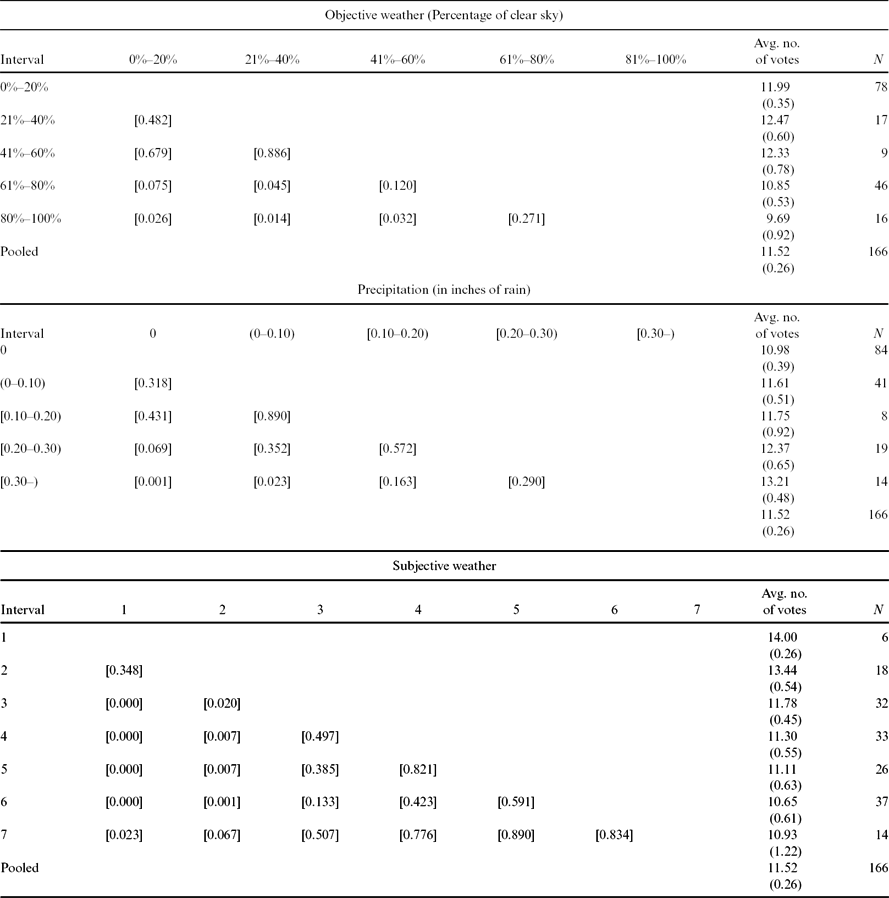
Notes. This table reports the analysis of the effect of weather on the likelihood of voting for the risk-free candidate (incumbent) for different interval categorizations of the weather quality. The top panel refer to objective weather; the middle to precipitation; and the bottom to subjective weather. The rightmost two columns report the average number of votes for the risk-free candidate, the standard deviation of the mean (in parentheses), and the number of observations across the two prospects. The matrices in the middle columns report the p values (in brackets) for the null hypothesis that the average number of votes for the risk-free candidate in two different weather condition intervals are equal.
Voting behavior proves to be significantly different across fairly extreme weather conditions. For example, vote choice in sessions when the sky was clear for less than 40% of the time is significantly different than when the sky was clear for more than 60% of the time. However, we cannot reject the null hypothesis that vote choice is identical between relatively sunny (or cloudy) sessions. Similarly, behavior in sessions with no rainfall is significantly different than behavior in sessions with more than average rainfall (more than 0.30 inches), but a small amount of rain (less than 0.20 inches) does not affect vote choice relative to no rain at all. The effect of subjective weather is statistically significant only when extremely poor weather (rated 1 or 2) is compared to better weather conditions.
Causal Mechanisms
In this section, I investigate and analyze two different possible underlying causal paths of the relation between weather and voting choice. One possible explanation is that weather affects cognitive behavior and thus decision making. Previous literature claims that the environment affects the following: (i) the interpretation of available data; (ii) the processing of information, or (iii) the tendency of agents to rely on simple decision heuristics, such as imitating prior decisions or maintaining the status quo (Isen, Reference Isen, Lewis and Haviland-Jones2000).
To test this mechanism, I first investigate if weather affects cognitive effort, using the responses to a mathematical quiz that the subjects were asked to complete after the voting task.Footnote 9 The responses to the mathematical quiz are not statistically different across any measure of weather (see Table 4), indicating that weather does not affect the type of cognitive effort required of the subjects need during the experiment.
Cognitive Mechanism
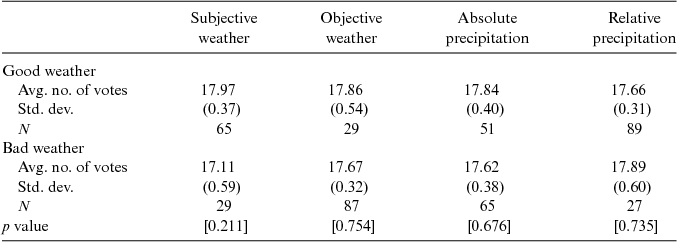
Notes. This table reports the average number of correct math answers, the standard deviation of the mean (in parentheses), and the number of observations for each weather condition. The last row reports the p values (in brackets) of the Welch test for the null hypothesis that the means in good and bad weather conditions are equal.
A second explanation for the link between weather and voting choice is that mood is an intermediate variable through which weather affects decision making. This possible causal path is supported by studies suggesting that pleasant weather conditions enhance agents’ mood (Sanders and Brizzolara, Reference Sanders and Brizzolara1982) and affect the subjective assessment of the likelihood of future events (Wright and Bower, Reference Wright and Bower1992), making agents more inclined to accept risks. To test this possibility, I investigate whether the weather affects mood and whether mood affects voting choice.
To measure positive and negative affect mood states, I use the responses that subjects provided in the PANAS-X affect scale form. Positive affect is defined as feelings such as happiness, joy, excitement, enthusiasm, and contentment. Negative affect measures feelings such as fear, anger, anxiety, and depression.Footnote 10
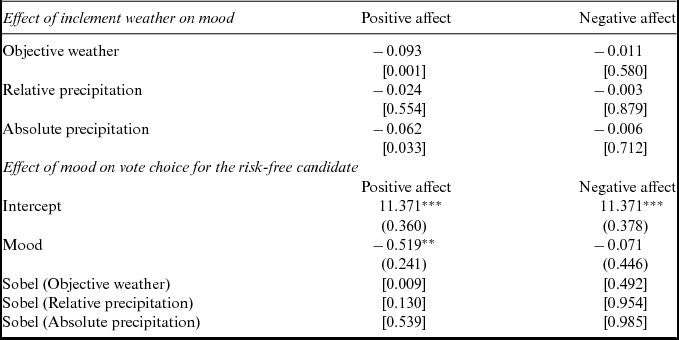
In top panel of Table 5, I report the affect score differences between bad-weather and good-weather (the left and right column refers to the positive and negative affect scores, respectively).Footnote 11 A positive number indicates that the score is higher under bad-weather conditions than under good-weather conditions. The results show that when weather conditions worsen, positive affect scores significatively decrease (overcast sky and absolute precipitation levels affect positive mood scores at 1% and 5% significance levels, respectively), while negative mood scores are not significantly affected by weather conditions. In the bottom panel of Table 5, I report the results of the regression of the the votes for the risk-free candidate on the affect states. The results suggest that the likelihood of voting for the risk-free candidate is significantly influenced by both positive and negative affect states.
Mediation Analysis of the Mood Mechanism
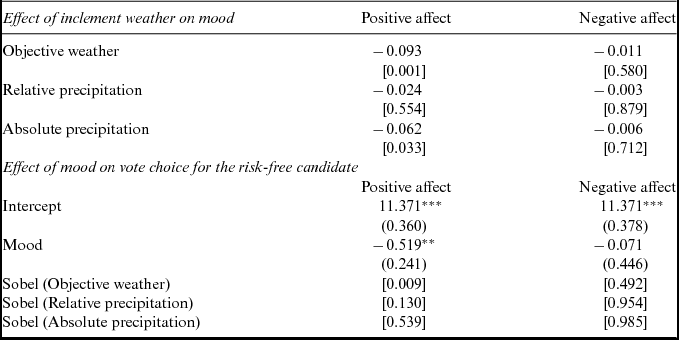
Note. The top panel shows the effect of weather on mood. Each entry reports the spread of the scores between the bad and the good weather conditions and the p values (in brackets) for the null hypothesis that the scores under bad and good weather conditions are equal. The bottom panel shows the effect of mood on voting choice. It reports the estimated coefficients of the regressions of the number of votes for the risk-free candidate on an intercept and on the standardized scores of the PANAS-X categories. The numbers in parentheses are the standard deviations of the estimated coefficients. The last row shows the results of the Sobel test mediation analysis: the p values (in brackets) for the null hypothesis of no mediation of mood in the effect of weather on the vote choices.
I also test the mediational hypothesis using a Sobel test (1982) for partial mediation.Footnote 12 The hypothesis is that the relationship between weather and vote choice is an indirect effect due to the influence of mood (the mediator). The test shows that the null hypothesis of no mediation of positive affect in the documented effect of weather on vote choice is rejected at conventional levels of statistical significance when weather quality is accounted for by the objective measure (P-value 0.009).
The mood-risk channel investigated in this article does not exclude other mechanisms through which weather may affect individuals’ behavior. A more thorough analysis, in which mood states are induced and controlled rather than self-reported, is needed to fully understand and distinguish among different (and potentially interacting) causal mechanisms. I regard this as an important question for future research.
CONCLUSION
This article provides experimental evidence of the effect of weather–measured in terms of precipitation, sunlight exposure, and subjective weather quality—on the likelihood that voters will vote for candidates who are perceived to be risky. My findings show that bad weather decreases risk tolerance, thus, increasing the likelihood that voters will vote in favor of a less-risky candidate, while good weather conditions promote risk-taking behavior. In close elections, bad weather may result in up to a twice as great a probability of choosing a less-risky candidate over a more-risky one.
Horiuchi and Kang (Reference Horiuchi and Kang2018) provide an estimate of the effect of weather on parties’ vote share in presidential elections, after controlling for the effect of weather on turnout. My results show that weather on election day can affect parties’ vote share by swinging the vote choice of the so-called marginal voters, that is, voters who are almost indifferent between the candidates. Weather does not seem to affect the vote choice when candidates yield substantially different utilities; hence, one should not expect weather to swing the votes of partisans or of voters who perceive the candidates to be substantially different in terms of political attitudes, policy programs, or personal characteristics. Rather, weather is more likely to affect the vote choice of voters in lower-stakes elections, in which voters might be less informed about the policy preferences of the candidates, and the risk of candidates not carrying through on campaign promises may be the key factor in swing voters’ decisions.
The results of this analysis suggest that not only policy ambiguity but also performance uncertainty may affect vote choice, especially when candidates’ policy preferences are similar. Although the findings of this study could be reinterpreted to allow candidates to carry different types of risks, which ultimately would affect voters’ utilities, further studies are needed to test the magnitude of the weather effect in the presence of such risks.
This study opens up new questions to pursue that will advance our collective understanding of risks and their effect on vote choice. What kind of personal characteristics and actions cause a candidate to be perceived as risky? To what type of risks are voters more sensitive? The design used in this article could be fruitfully extended to analyze the effect of different types of candidate riskiness on vote choice, such as uncertainty about future policy programs or unknown capacity for the fulfillment of political promises.
SUPPLEMENTARY MATERIALS
To view supplementary material for this article, please visit https://doi.org/10.1017/XPS.2018.13