INTRODUCTION
Recent studies have demonstrated that a number of littoral fishes in temperate waters use nearshore areas, i.e. intertidal and subtidal exposed zones, and/or enclosed shallow embayments, as temporary nursery grounds for young of-the-year (YOY) (Jenkins et al., Reference Jenkins, Wheatley and Poore1996; Raventós & Macpherson, 2001; Hindell & Jenkins, Reference Hindell and Jenkins2004; Hernández-Miranda et al., Reference Hernández-Miranda, Veas, Espinoza, Thorrold and Ojeda2009). As YOY increase in size they move to the deeper benthic habitats of the adult population. A particular case within littoral fishes are the intertidal fishes, which have to deal with many biotic and abiotic factors due to the temporal and spatially limited nature of rocky pools. Abiotic limiting factors are mainly represented by daily and seasonal variability in temperature, oxygen concentration and salinity, whereas biotic limiting factors are competition and food availability (Gibson, Reference Gibson1982; Metaxas & Scheibling, Reference Metaxas and Scheibling1993; Pulgar et al., Reference Pulgar, Ojeda and Bozinovic2006).
To date most studies on rocky pool fish assemblages have been focused on revealing community structure, temporal and spatial pattern of their abundance, and/or recolonization process after catastrophic perturbations (Moring, Reference Moring1996). These studies have demonstrated that despite the dynamic of rocky pools, intertidal rocky fishes make a successful use of these habitats either as a transitory usage during their juvenile phase or as a permanent residence during their entire life. Even after catastrophic events where rocky pools are defaunated, recolonization of fish fauna takes place, due to larval supply from the plankton (Griffiths et al., Reference Griffiths, West, David and Russell2004). Furthermore, some studies have shown that several species have high degree of fidelity to rocky pools (Green, Reference Green1971; Yoshiyama et al., Reference Yoshiyama, Gaylord, Philippart, Moore, Jordan, Coon, Schalk, Valpey and Tosques1992; Griffiths, Reference Griffiths2003). Contrasting with such a valuable amount of insight gathered there is a lack of knowledge on the early life history traits, particularly during the first month of YOY life of intertidal fishes. By revealing early life history traits it would be possible to make clear pre-settlement and post-settlement processes as well as the dynamics of growth of YOY in intertidal rocky pools. Such an insight would be very useful to reveal the role that intertidal pools play as nursery grounds for both transitory and resident species.
Otolith microstructure analysis demonstrated to be a powerful tool to reveal the early life history of fishes (Panella, Reference Pannella1971; Campana & Jones, Reference Campana, Jones, Stevenson and Campana1992). A first step when using this methodology is to analyse the readability of otolith microstructure to reveal what kind of ecological information the otoliths contain. Then, basic information about age and growth can be obtained for any species analysed. The aim of the current paper was to analyse daily growth increment patterns in six species of perciform fishes: Bovichtus chilensis (Bovichtidae), Girella laevifrons and Graus nigra (Kyphosidae); Helcogrammoides chilensis (Tripterygiidae); and Hypsoblennius sordidus and Scartichthys viridis (Blenniidae), collected in rocky pools in order to define early life history traits of this species. At first, microstructural features were described and the length-at-age relationships at the time of capture were determined for each species. An estimate of individual growth was also provided using daily increment width as a proxy of daily growth rates.
MATERIALS AND METHODS
Study area and sampling methods
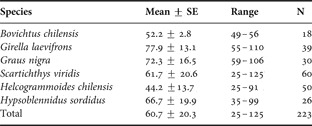
Young of-the year were collected in intertidal pools along the littoral zone of central Chile, between 33oS and 34oS. A total of 223 YOY, ranging from 25 to 125 mm in total length (TL), were collected from June to December 2008 (Table 1). Sampling procedures consisted in extracting water from tidal pools during low tides using a portable water pump (Tecumseh 5Hp). This procedure has been successfully applied to collect fishes in intertidal pools (Hernández-Miranda & Ojeda, Reference Hernández-Miranda and Ojeda2006). The pump aperture was set perpendicularly to the pool bottom to avoid fishes being suctioned into the pump. Once water was suctioned, a dilution of BZ 20 anaesthetic was added to facilitate the collection of juveniles. Sampling was occasional and hence did not provide a complete random design on a temporal and spatial scale. However, YOY collected and analysed during the study period were suitable for the purposes of the current study.
Mean length and range of young-of-the-year of six species of intertidal fishes collected in central Chile in 2008.

SE, standard error.
Otolith analysis
In the laboratory, TL was measured to the nearest 0.01 mm, and then the left and right sagittae were removed, cleaned of adhering tissue, dried and stored in clean micro vials tubes. Using the slide-glass embed method sagittae were prepared for examination of primary increments (Plaza et al., Reference Plaza, Honda, Sakaji and Nashida2005). After polishing, counts of the daily increments were made twice across the area of distinctive increments. Otolith radii and increment widths were measured through a linear axis from the second check surrounding the primordium along the post-rostrum of the sagittae (i.e. maximum radius). When increments were measured through a shorter axis, they were standardized to the maximum radius to make increment width fully comparable among individuals and species. All counting and measurements were carried out using an image analysis system (Image-pro-plus) at magnifications of 400–1000 ×. The daily periodicity of primary increments has been only validated for S. viridis (Hernández-Miranda et al., Reference Hernández-Miranda, Veas, Espinoza, Thorrold and Ojeda2009). For the remaining five species primary increments were assumed to be daily. Age was estimated as the number of increments, whereas hatch date distributions were calculated by subtracting the age in days from the calendar day of sampling.
Statistical analyses
Comparison of increment width over age was carried out using univariate repeated measures analysis of variance (ANOVA), following the criteria described by Chambers & Miller (Reference Chambers, Miller, Secor, Dean and Campana1995). The analysis was a 2-factor design, with species as an independent factor (i.e. between-subject factor (a) with cases arranged in rows), and age as a repeated factor (i.e. within-subjects factor (b) with numbers of levels arranged in columns). Increment widths were averaged every 5 days before applying repeated measures ANOVA to reduce both the numbers of repeated measures and high frequency noise (Pyper & Peterman, Reference Pyper and Peterman1998). All repeated measures ANOVAs were achieved on a balanced set of repeated measures, i.e. truncated at 100th day to maximize the number of observations and repeated measures, because the number of primary increments measured varied within and among species. The length-at-age and otolith size–fish size relationships were assessed using lineal regression and analysis of covariance (ANCOVA) with length as dependent variable, species as fixed factor and age as a covariate.
RESULTS
Otolith macro and micro-structure of the collected species
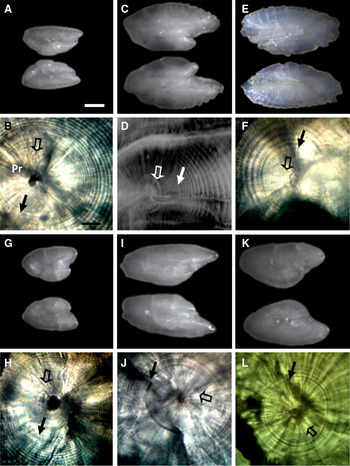
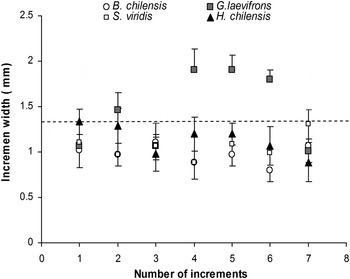
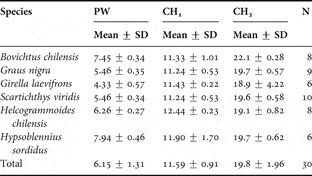
In the six species, sagittal otoliths showed a slightly oval shape, symmetric and laterally compressed (Figure 1). This shape facilitated the preparation in sagittal position, where the micro-increments where distinguishable in a two-side polishing, except for G. nigra and G. laevifrons that turned concave with growth (Figure 1C–E). In these species two-side polishing in frontal planes provided resolution for examination of daily increments. In all species (Figure 1), a unique primordium (overall mean, OM = 6.15 ± 1.31 µm in maximum width) enclosed by a diffuse first check (CH1) (OM = 11.59 ± 0.91 µm in radius) and a very distinctive one (CH2) enclosing a wider area (OM = 19.8 ± 1.96 µm in radius) containing very faint rings, after which clear, concentric and well-defined rings were observed (Table 2). Between the first and second check 4–7 faint and partially concentric rings were observed in some species, such as in B. chilensis, G. nigra and G. laevifrons. Mean values of log-transformed radii at the formation of both first and second check did not vary significantly among species, except for B. chilensis (multivariate ANOVA; Wilks' lamda = 0.83; P = 0.42). Mean increments width between the two checks, measured in otoliths (N = 7) from 4 four species ranged between 0.7 and 1.9 µm (OM = 1.15 ±0.21 µm) (Figure 2).
Stereoscopic and microscopic image of sagittal otoliths of juveniles intertidal species collected in central Chile: (A, B) Bovichtus chilensis, 5.8 cm total length (TL); (C, D) Graus nigra, 6.45 cm TL; (E, F) Girella laevifrons, 10.4 TL; (G, H); Scartichthys viridis, 6.95 TL; (I, J) Helcogrammoides chilensis, 5.85 cm TL; (K, L) Hypsoblennius sordidus, 7.85 TL. Scale bars correspond to 0.5 mm for macrostructure and 10 µm for microstructure. Filled and unfilled arrows denote the first and second check, respectively.

Mean width of faint increments deposited between the first and second check of young-of-the year of four intertidal species collected in central Chile. Vertical bars and dashed line denote 1 standard deviation and the overall mean, respectively.

Mean values of primordium diameter (PD), radii-at formation of the first check (CH1) and radii-at formation of the second check (CH2) of young of-the-year of six species of intertidal fishes collected in Central Chile in 2008; SD, standard deviation.

Increment width profile
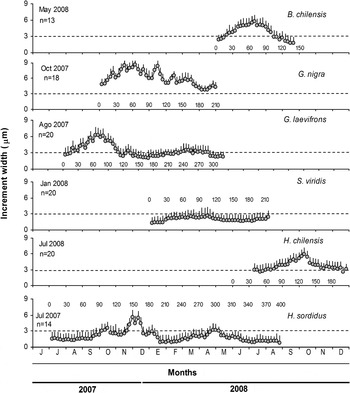
The widths of each primary increment were measured from the second check and then averaged to build an increment width profile for each species (Figure 3). The increment width depends upon the ontogenetic development of each fish and the relevant hatching period. Hence, increment width profiles were built using a subsample of YOYs hatched within the same month (Figure 3). Daily increment width was very variable ranging from 0.46 to 8.82 µm, showing significant differences in increment width over age and among species (repeated measures ANOVA P < 0.05). Although hatch month was not the same for each species, two main increment width patterns were observed: (i) a parabolic growth with wider increment widths during the first three months of life (e.g. B. chilensis, Graus nigra, G. laevifrons and H. chilensis); and (ii) a more irregular pattern with lower increment widths over age in S. viridis and H. sordidus (Figure 3). Hypsoblennius sordidus showed two distinctive peaks over the longer life periods investigated.
Mean increment width (IW) profile of sagittal otoliths in sub-samples of young of-the-year of six different hatch cohorts of intertidal species collected in central Chile. Mean IW profiles were arranged according to calendar month to facilitate comparison of changes in IW over age and as season progressed. 30-days interval numbers close to IW profiles denote numbers of days after hatching. Date inside figures denote hatch month whereas dashed lines correspond to the overall mean increment width (3 µm). Vertical bars denote 1 standard deviation and ‘n'= sampling size.

Length-at-age and otolith size–fish size relationships
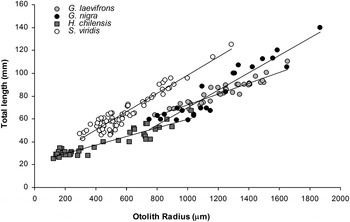
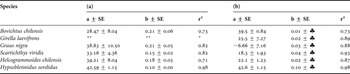
Estimations of mean instantaneous growth rate (i.e. the slope of length-at-age relationship) were obtained for all species, except for G. laevifrons, due to the poor readability of increments in most specimens. In this species the micro-increments were reliable only in a few preparations containing primary increments with high resolution (N = 10). For the remaining species mean growth rate varied from 0.1 to 0.21 mmd−1 (Table 3a). The maximum otolith length was used as measure of otolith instead of maximum radius because polishing planes used varied within and among species. Inability to ensure the same polishing plane (i.e. frontal, transversal or sagittal) for all samples analysed made maximum radius not fully comparable within individual and among species. The otolith length–fish size relationship was determined only in those species with a significantly wide size (Figure 4; Table 3b). All relationships were linear in the four species although the slope significantly varied among them (ANCOVA; P < 0.001), with S. viridis showing the larger otoliths over the entire range of YOY analysed (Figure 4).
Otolith size–fish size relationships of young-of-the year of four species of intertidal fishes collected in central Chile.

Length-at-age (a) and otolith size-fish length relationship (b) of six species collected in intertidal rocky pools in central Chile. Models were all significant (P < 0.001). *, model was not fit to this species; ♣, standard errors <0.01.

DISCUSSION
Two characteristic features of otolith growth shared among the six species of YOY intertidal fishes in central Chile were: (i) the occurrence of a unique dark primordium surrounded by two checks; and (ii) the existence of a few faint rings formed between them. The first and second check could be linked to hatch and first feeding events, respectively, such as has been reported in a number of species in both pelagic and demersal fishes (Morales-Nin, Reference Morales-Nin2000). Conversely, the occurrence of faint rings within is more uncertain and difficult to explain without validating the time of formation of these ontogenetic events; however, some inferences can be given. The time of initial formation of the first daily growth increments in otolith of teleosts appears to differ among species. In some species it coincides with the onset of exogenous feeding (Jenkins, Reference Jenkins1987; Maillet & Checkey, Reference Maillet and Checkey1990; Sepulveda, Reference Sepulveda1994), in other species, the first growth increment is laid down immediately after hatching (Radtke & Waiwood, Reference Radtke and Waiwood1980; Quiñones-Velazquez, Reference Quiñones-Velazquez1999; Morales-Nin, Reference Morales-Nin2000; Morley et al., Reference Morley, Belchier and Dickson2005) presumably linked to the fact that most larvae are able to do exogenous feeding before yolk is completely absorbed, and hence be able to deposit distinctive increments. In the current study the 4–7 faint rings never completely enclosed the first check at least at the level of resolution of immersion lens under light microscopy, which could suggest that these rings were formed prior to first feeding, presumably representing an estimation of the average yolk-sac duration. The variability in resolution and the inconsistency in the occurrence of these faint rings within individuals and species could be a result of polishing due to their reduced width being almost narrower than 2 µm. In addition, it can be associated with differences in time of embryonic development before hatching, as recently hatched larvae of pelagic spawners (B. chilensis, G. laevifrons and G. nigra) exhibit a large yolk-sac and eyes without pigmentation, whereas benthic spawners (S. viridis, H. chilensis and H. sordidus) hatch at an advanced stage of development.
Increment width profiles showed high variability over age and between species, probably linked to different hatching periods found among them. Despite this variability, however, two common features can be drawn: (i) the species showing the faster instantaneous growth rates showed the relatively higher otolith growth rate (i.e. B. chilensis and G. nigra); and (ii) the slow-growing species S. viridis, H. chilensis, H. sordidus and G. laevifrons generally exhibit an increment width narrower than 3 µm (i.e. the overall mean increment width) throughout most of early life. Previous studies in central Chile have reported that the two fast-growing species (i.e. B. chilensis and G. nigra) are carnivorous and therefore able to feed on small crustaceans and other invertebrates (Muñoz & Ojeda, Reference Muñoz and Ojeda1998), whereas slow-growing species are either herbivorous (S. viridis) whose diet encompasses mainly macro-algae or omnivorous (all other species) consuming invertebrate prey as well as macro-algae (Muñoz & Ojeda, Reference Muñoz and Ojeda1998; Ojeda & Muñoz, Reference Ojeda and Muñoz1999; Cáceres & Ojeda, Reference Cáceres and Ojeda2000; Berríos & Vargas, Reference Berríos and Vargas2004; Diaz & Muñoz, Reference Diaz and Muñoz2010). These findings can be used to explain growth differences, because carnivorous diet provides higher caloric gain due to its higher protein content. The faster growing species (B. chilensis and G. nigra) shared a similar sharp decrease in increment width at 60–70 days of YOY life. Drastic changes in increment spacing in otolith of YOY of demersal fishes have been linked to either ontogenetic shift from pelagic to demersal life (settlement) or metamorphosis, or both when these events match (Victor, Reference Victor1982; Wellington & Victor, Reference Wellington and Victor1989; Sponaugle & Cowen, Reference Sponaugle and Cowen1994; Hamer & Jenkins, Reference Hamer and Jenkins1996; Wilson & McCormick, Reference Wilson and McCormick1997; Raventos & Macpherson, Reference Raventos and Macpherson2001; Soliman et al., Reference Soliman, Yamada and Yamaoka2010; Kohn & Clements, Reference Kohn and Clements2011). Metamorphosis, however, has been more linked to a reduction of increment width as early as the first month of life after a period of fast growth after hatching. Hence, the reduction in increment width observed after three months in our species seems to be associated with a shift from pelagic to intertidal life.
Further evidence suggesting a reduced growth in length of YOY in intertidal pools came from the mean growth rates estimated using the age-at length relationship, which ranged from 0.1 to 0.23 mmd−1 for the species analysed in the present study. Such values fall at the lower limit of growth rates reported by other studies using a similar methodology in YOY of demersal species (e.g. Lophius budegassa 0.8–1.2 mmd−1 (La Messa & De Rossi, Reference La Mesa and De Rossi2008); Merluccius merluccius 0.66 mmd−1 (Piñeiro et al., Reference Piñeiro, Rey, de Pontual and Garcia2008); Cynoscion nebulosus 0.84 mmd−1 (Powell et al., Reference Powell, Cheshire, Laban, Colvocoresses, O'Donnell and Davidian2004); Pseudopleuronectes yokohamae 0.35 mmd−1 (Joh et al., Reference Joh, Takatsu, Nakaya, Higashitani and Takahashi2005); Sciaenops ocellatus 0.45 mmd−1 (Stunz et al., Reference Stunz, Minello and Levin2002); and Sebastes inermis 0.49–0.51 mmd−1 (Plaza et al., Reference Plaza, Katayama and Omori2002)). Present results give evidence that low growth rates of intertidal YOY fishes are a common feature irrespective of species, as a result of a confined environment where feeding and environmental conditions can change dramatically linked to tidal cycle and/or other physical processes at sub-inertial scale. Consequently, according to the classic ecological assumption that habitat quality is directly related to enhanced growth intertidal habitats seem not to be effective nursery grounds for YOY fishes. Conversely, our findings agree with recent studies, which proposed that growth alone cannot be considered a bio-indicator of habitat quality, as growth is the result of the combined effect of several factors such as changing environmental conditions, previous growth history, density dependence and selective mortality (Gilliers et al., Reference Gilliers, Le Pape, Desaunay, Morin, Guerault and Amara2006; Searcy et al., Reference Searcy, Eggleston and Hare2007).
The reduced growth observed when YOY recruit to intertidal pools, however, is based on two main assumptions: (i) ring width is a linear proxy of somatic growth rates; and (ii) micro-increments are deposited on a daily basis. The first assumption can be tested through the otolith size–fish size relationship, which was demonstrated to be linear and nearly isometric in five of six species in the current study. These results agree with previous studies on YOY of other species, in which otolith–fish size relationships were linear (Campana & Neilson, Reference Campana and Neilson1985; La Mesa & Ashford, Reference La Mesa and Ashford2008; Kristensen et al., Reference Kristensen, Closs, Lokman and Grønkjær2008). A linear and nearly isometric isometric relationship suggests that fish growth and otolith growth variations followed the same direction; hence, supporting the inference that an apparent reduction in growth occurred during permanence of YOY in intertidal rock pools.
ACKNOWLEDGEMENTS
This research was funded by the project FONDECYT 1100424 to F.P.O., G.P. and M.F.L. We thank G. Moyano for assistance in collecting YOY fishes in intertidal pools and preparation of otoliths for examination of daily increments.