Introduction
Ixodes scapularis is an obligate haematophagous ectoparasite and the principal vector for Lyme disease, anaplasmosis, babesiosis and Powassan virus in North America (Nelson et al., Reference Nelson, Saha, Kugeler, Delorey, Shankar, Hinckley and Mead2015). Female I. scapularis lay egg masses containing up to 3000 eggs (Mount et al., Reference Mount, Haile and Daniels1997), but <1% are reported to survive to reproduce (Awerbuch and Sandberg, Reference Awerbuch and Sandberg1995; Wu et al., Reference Wu, Duvvuri, Lou, Ogden, Pelcat and Wu2013). Survival rates vary for a multitude of reasons including host contact rates and environmental stressors (Ogden et al., Reference Ogden, Radojevic, Wu, Duvvuri, Leighton and Wu2014). Ixodes scapularis spends over 95% of its 2-year life cycle off-host, either questing or in diapause (Ostfeld and Brunner, Reference Ostfeld and Brunner2015). The longest inactive period in the I. scapularis life cycle lasts approximately from September to June and occurs between their larval and nymphal life stages (Ogden et al., Reference Ogden, Lindsay, Beauchamp, Charron, Maarouf, O'callaghan, Waltner-Toews and Barker2004). During this period most engorged larvae molt into nymphs and enter behavioural diapause, terminating their questing activity to reduce their exposure to cold temperatures (Belozerov, Reference Belozerov, Obenchain and Galun1982; Gray et al., Reference Gray, Kahl, Lane, Levin and Tsao2016). The probability of encountering a host partially determines the percentage of larvae that will quest the following season as nymphs (Ogden et al., Reference Ogden, Bigras-Poulin, O'callaghan, Barker, Lindsay, Maarouf, Smoyer-Tomic, Waltner-Toews and Charron2005), but off-host mortality also contributes to survivorship between the I. scapularis larval and nymphal life stages (Lindsay et al., Reference Lindsay, Barker, Surgeoner, McEwen, Gillespie and Robinson1995, Reference Lindsay, Barker, Surgeoner, Mcewen, Gillespie and Addison1998).
The patterns and controls of off-host survivorship during the 10-month period of behavioural diapause for I. scapularis nymphs have received limited attention (Eisen et al., Reference Eisen, Eisen, Ogden and Beard2016). Research on the off-host dynamics of I. scapularis has primarily concentrated on their actively questing life stages (Jones and Kitron, Reference Jones and Kitron2000; Ostfeld et al., Reference Ostfeld, Canham, Oggenfuss, Winchcombe and Keesing2006), or on total survival between questing periods (Lindsay et al., Reference Lindsay, Barker, Surgeoner, McEwen, Gillespie and Robinson1995; Ginsberg and Zhioua, Reference Ginsberg and Zhioua1996; Burtis et al., Reference Burtis, Sullivan, Levi, Oggenfuss, Fahey and Ostfeld2016a). Because of the long duration of this dormant period for I. scapularis nymphs (Lindsay et al., Reference Lindsay, Barker, Surgeoner, Mcewen, Gillespie and Addison1998), the timing of mortality events is uncertain, as survivorship may either be consistent throughout the year or decrease during a specific season (Brunner et al., Reference Brunner, Killilea and Ostfeld2012). Furthermore, although researchers have measured the body condition of ticks collected from the field (Randolph and Storey, Reference Randolph and Storey1999), I. scapularis energy use and body condition during their behavioural diapause period has not been measured under field conditions. Measurements of physiological age have proven to be most reliable for representing the body condition of ticks (Uspensky, Reference Uspensky1995). In the most common methods, lipids are extracted from ticks to measure energy storage, which is strongly correlated with age and survival for both I. scapularis (Pool et al., Reference Pool, Petronglo, Falco and Daniels2017) and its close relative I. ricinus (Steele and Randolph, Reference Steele and Randolph1985; Herrmann et al., Reference Herrmann, Voordouw and Gern2013). The hypothesis underlying this research is that the survivorship of I. scapularis during behavioural diapause depends primarily upon the adequacy of energy reserves. Thus, we expected survivorship and energy reserves will show similar patterns and be correlated under field conditions, particularly in the spring as the weather warms and tick metabolic activity increases. These trends should intensify once I. scapularis nymphs begin actively questing for hosts in the early summer. Although the correlative nature of our research does not provide a conclusive mechanistic basis for testing the hypothesis, the patterns may be suggestive of this relationship and thereby justify future mechanistic studies.
Densities of questing I. scapularis nymphs are spatially heterogeneous among field sites at local scales (Pardanani and Mather, Reference Pardanani and Mather2004), but the extent to which off-host survivorship contributes to this variability is unknown. The density of questing ticks can be affected by many factors aside from those affecting off-host survival, including host community composition, weather conditions and tick phenology (Schulze et al., Reference Schulze, Jordan and Hung1997). Tick dragging or flagging are the most common collection methods and cannot differentiate between these factors as ticks must be actively questing to be detected (Killilea et al., Reference Killilea, Swei, Lane, Briggs and Ostfeld2008). Therefore, the degree to which any one of these factors contributes to the density of questing I. scapularis in a specific location is difficult to determine using the dragging method alone. When paired with dragging data, microcosms provide a method by which the contribution of off-host factors during specific periods can be isolated (Burtis, Reference Burtis2017). Isolating these factors is an important step towards identifying the underlying mechanisms affecting the spatial distribution of I. scapularis.
Dragging data also suggest that soil properties such as litter depth can impact the survival and density of I. scapularis (Lubelczyk et al., Reference Lubelczyk, Elias, Rand, Holman, Lacombe and Smith2004; Clow et al., Reference Clow, Ogden, Lindsay, Michel, Pearl and Jardine2017), but whether these properties directly affect the survival of I. scapularis nymphs is rarely investigated, particularly at fine scales (e.g. within field sites) (Boehnke et al., Reference Boehnke, Gebhardt, Petney and Norra2017). Soil properties often show a high degree of fine-scale variability (Amador et al., Reference Amador, Wang, Savin and Görres2000; Ettema and Wardle, Reference Ettema and Wardle2002), and few studies of tick survival and density have adequately measured fine-scale variation to detect effects on survival within field sites. Due to the low mobility of I. scapularis (Bertrand and Wilson, Reference Bertrand and Wilson1996; Ostfeld et al., Reference Ostfeld, Hazler and Cepeda1996) their drop-off location is likely to have a strong effect on their off-host survival. Soil organic matter (SOM) is a significant factor affecting the survival of many soil-dwelling arthropods, as it retains moisture and stabilizes soil microclimates (Vreeken-Buijs et al., Reference Vreeken-Buijs, Hassink and Brussaard1998; Christenson et al., Reference Christenson, Clark, Livingston, Heffernan, Campbell, Driscoll, Groffman, Fahey, Fisk, Mitchell and Templer2017). High SOM levels have been correlated with higher survival of questing I. scapularis nymphs in the summer (Burtis and Pflueger, Reference Burtis and Pflueger2017), but the effect of SOM may not be consistent throughout the I. scapularis life cycle, as ticks behaviourally reduce their exposure to harsh climatic conditions through the cessation of questing activity. Tracking the strength of this effect during the I. scapularis nymphal overwintering period could provide valuable information regarding the consistency of SOM effects on tick survival at different stages in their life cycle.
The objectives of the present study were: (1) to determine under field conditions the temporal patterns of survivorship for engorged larval I. scapularis as they develop into nymphs and undergo behavioural diapause between September and July; (2) to evaluate the degree to which off-host mortality during this period contributes to differences in naturally questing tick densities in different field locations; and (3) to observe whether tick survivorship and energy use show similar trends throughout the overwintering period under field conditions. Survivorship in microcosms was measured across forested sites that exhibited either high or low natural tick densities. Energy use was determined based on the lipid reserves of I. scapularis nymphs recovered from the microcosms. Additionally, we measured SOM content (% SOM) as a likely contributor to habitat quality in microcosms within each site. To determine the consistency and broader applicability of these observations, we compared results with those using the same methods from a previous season at a different site. We expected tick survivorship and energy storage to decline starting in the spring due to increasing use of energy reserves as the weather warms. Assuming that off-host survival contributes to spatial variation in tick densities, we expected a positive relationship between survivorship in the microcosms and the site-level density of naturally questing ticks. Finally, we expected a positive relationship between tick survivorship and local habitat quality as represented by % SOM, with this effect being reduced during the winter due to the insulating effect of snow cover.
Materials and methods
Site descriptions
This research was conducted primarily on six field sites located in Dutchess County in New York State. We located field sites with high vs low natural I. scapularis density using records from 194 sites, where tick density data were collected in 2011 and 2012 by Dr R. Ostfeld (Table S1). During these collections, all sites were sampled using the dragging method (Schulze et al., Reference Schulze, Jordan and Hung1997). A 120 m × 120 m sampling grid, or an irregular grid covering the same total area (14 400 m2), was established on each site and sampled twice per summer. During each visit 16 transects were sampled, and drag cloths were checked every 30 m (480 m2 per visit). Due to drought conditions tick densities were low across the majority of the collection sites in 2012, so we used the 2011 data to identify potential high- and low-density sites. High-density sites averaged >12 nymphs per 100 m2 during the nymphal seasonal peak, whereas low-density sites averaged <1.2 nymphs per 100 m2. These sites were resampled in 2015 and 2016 (described below) to confirm that the observed differences were maintained. The minimum distance between the selected sites was 7.0 km and all sites were well-matched for slope, soil type, forest composition and understory vegetation.
All sites were characterized as second-growth northern hardwood forests where the canopy was dominated by sugar maple (Acer saccharum) and red oak (Quercus rubra). All stands were between 50 and 100 years old. The soils at five of the sites were classified as either Nassau-Cardigan or Hollis-Chatfield series and were rocky Inceptisols, with nearly level (0–5%) slopes. Soil at the Taconic site was a Copake gravelly silt loam (USDA, 2017). All sites had little understory vegetation cover. A 30 × 30 m sampling and randomization grid with flags every 3 m was established on each of the sites. These 121-point grids were used to randomly select the locations of the 48 microcosms placed on each of the six sites (288 total) and determine which transects were to be dragged to collect tick density data.
During a previous season (2013–2014), similar data were collected for overwintering I. scapularis nymphs at one site located in Ithaca NY (42°28′4.06″N; 76°25′34.21″W). This site was located in a northern hardwood forest dominated by A. saccharum on a Howard gravely loam soil with no understory vegetation. A 136-point sampling grid was established on this site, with points separated by 3 m (21 m × 48 m). This grid was used to randomize the locations of the 85 microcosms established on the site. We note that this sampling effort was designed primarily to test the microcosm approach, but the results proved informative and are presented for the first time here.
Tick density measurements
Larval and nymphal I. scapularis density data were collected weekly across the six sites in Dutchess County during the summer (May–August) in both 2015 and 2016 using the tick dragging method (Schulze et al., Reference Schulze, Jordan and Hung1997). High temporal resolution tick density data for the sites during the study period were needed to ensure that the density designations (high/low) based on data collected in 2011 were maintained during our field season. Ticks were collected weekly between 20 May and 1 September by dragging a 150 m2 area on each site. Drag cloths were checked every 30 m, and five 30 m transects were randomly selected using the grids laid out on each site. Ticks were collected into vials containing 70% ethanol and returned to the laboratory where they were keyed to species (Durden and Keirans, Reference Durden and Keirans1996). Sites were dragged between 8:00 and– 18:00 h, and drag times were alternated to ensure that no site was repeatedly sampled during the same time of day.
Larval I. scapularis collection and rearing
We collected larval I. scapularis, for addition to the microcosms, in July and August using the dragging method on Cary Institute of Ecosystem Studies (CIES) property (41°46′56.91″N; 73°43′59.18″W) in an area with a dense understory of Japanese Barberry (Berberis thunbergii). This collection location was used both in 2013 for the Ithaca site, and 2015 for the six Dutchess County sites. After collection, the larvae were fed upon one of 20 laboratory-raised mice (Peromyscus leucopus) within 6 h. All mice used in this experiment were obtained from the Peromyscus genetic stock centre supported by the University of South Carolina and maintained in a facility at the CIES. Mice were manually restrained and approximately 100 larvae were placed on each mouse using a fine tipped brush. Once inoculated, mice were placed in a PVC tube with food for 4 h to discourage grooming and allow the ticks to begin feeding. Mice were then kept in a wire mesh cage suspended above a tape-lined tray with a moistened towel in the bottom as described in Keesing et al. (Reference Keesing, Brunner, Duerr, Killilea, LoGiudice, Schmidt, Vuong and Ostfeld2009). The trays were checked every 12 h and engorged larvae were collected and deposited into vials containing plaster of Paris and DI water to maintain a humid environment. These engorged larvae were kept at 20 °C for no more than 3 weeks before being placed in the field. Prior to deployment, larvae were randomly assigned to microcosms and field sites to ensure that no individual microcosm would contain ticks that were collected during the same time period or fed on the same host at the same time. All animal handling procedures were approved by a joint IACUC protocol (2013-0015) between the CIES and Cornell University.
Microcosm deployment
Survival of I. scapularis was investigated under field conditions using microcosms containing soil and leaf litter from the field sites to ensure that ticks had access to natural refugia (Brunner et al., Reference Brunner, Killilea and Ostfeld2012; Burtis, Reference Burtis2017). To construct each microcosm, a PVC segment (15 cm diameter/5 cm depth) was placed on the surface of the soil, and a knife was used to cut the leaf litter and underlying surface soil inside the core. Next the PVC segment was pushed into the soil, and then the segment containing a soil core was lifted using a spatula and placed inside a fine mesh organdy bag. At this point, 15 engorged larval I. scapularis were added to the bag using a fine brush. The bag was then sealed using a cable tie and the microcosm was placed back into the original hole in the soil. The microcosm was then lightly covered with leaf litter from the surrounding area to avoid animal disturbances during its field deployment. In Dutchess County, microcosms (48 per site) were deployed between 25 and 29 August 2015 across all six sites, while in Ithaca all 85 microcosms were deployed on 1 September 2013. Air temperature data were collected from NOAA weather stations, one located in Millbrook, NY (ID # USW00064756) and one in Ithaca, NY (ID # USC00304174) (NOAA, 2018).
Tick recovery and lipid extraction
In 2015–2016 subsets of microcosms were collected from the field in Dutchess County on the following six days: (1) 18 October 2015, (2) 6 December 2015, (3) 29 January 2016, (4) 19 March 2016, (5) 12 May 2016 and (6) 2 July 2016. A total of 48 randomly selected microcosms were collected on each day (eight per site). During the 2013–2014 field season in Ithaca, there were three collection days, 16 December 2013, 15 February 2014 and 5 July 2014. A total of 20 microcosms were retrieved during the December and February collections, and 45 were collected in July. Retrieving the ticks from the microcosms involved hand sorting the leaf litter and soil for 30 min, and then hanging the materials in a Berlese funnel for 3 days under a 25 watt light bulb. To allow ticks to acclimate to indoor temperatures and avoid shock when introduced to the Berlese funnels, the microcosms were stored at room temperature for 48 h prior to retrieval; this method has proven effective for collecting diapausing and non-diapausing nymphs and engorged larvae from microcosms (Burtis, Reference Burtis2017). After the ticks were extracted, the soil was removed from the funnel, homogenized and dried at 65 °C for 48 h. The soil was then weighed and placed in a muffle furnace at 400 °C for 4 h and then reweighed to determine loss on ignition, which was used to estimate the SOM concentration (% SOM) (Goldin, Reference Goldin1987; Schulte et al., Reference Schulte, Kaufmann and Peter1991).
The ‘lipid index’ of the nymphs was determined using a chloroform extraction method which has been shown to be effective for I. scapularis (Pool et al., Reference Pool, Petronglo, Falco and Daniels2017). Ticks were collected from the ethanol jars at the bottom of the Berlese funnels every 24 h to reduce interference with the lipid extraction values, as ethanol can dissolve lipids (a test of storage effect is reported in Fig. S1). To estimate lipid content and physiological age, nymphs were dried at 70 °C for 48 h, weighed and then placed in chloroform for 72 h, with the chloroform being exchanged every 24 h. Nymphs were weighed as a group from each microcosm to ±1 µg using a Sartorius MC5 microbalance; thus, we obtained an average physiological age of the nymphs within each microcosm. We calculated the ‘lipid index’ to correct for the increased lipid storage of large bodied individuals. To calculate the index, we determined the average body and lipid mass of all the ticks within each microcosm. We then took the square root of the average lipid mass and divided it by the average body mass of ticks within each microcosm (Steele and Randolph, Reference Steele and Randolph1985). Finally, to determine their molting success, and the initial lipid index values of freshly molted nymphs, 100 of the engorged larvae were kept under laboratory conditions each year (2013/2015).
Statistical analyses
We used two mixed-effects models for data collected from the Dutchess County microcosms to determine how I. scapularis survival and lipid index values were affected by collection date (as a categorical variable), tick density class (high/low) and % SOM. Post-hoc Tukey tests were run on these models to directly compare survival and lipid index values among collection dates. These P values were corrected for multiple comparisons using the Holm method (Holm, Reference Holm1979). Similarly, we compared survival and lipid index data from the Dutchess County microcosms to those from the site in Ithaca using two mixed-effects models that included collection date, % SOM and year of collection (2014 – Ithaca/2016 – Dutchess County). Only data from microcosms collected in December, January and July in the Dutchess County sites were used to compare against those collected in the Ithaca site. All four mixed-effects models also included ‘site’ as a random effect, and the inclusion of fixed effects and their interactions were determined according to their Akaike information criterion (AIC) scores (Tables 1–4) following procedures described in Zuur et al. (Reference Zuur, Leno, Walker, Saveliev and Smith2009). We also ran a t-test to compare the lipid index values of the nymphs that molted under laboratory conditions in 2013 vs 2015. Over 99% of engorged larvae had molted into nymphs by our first collection in October, reflecting their feeding and deployment date (Gray et al., Reference Gray, Kahl, Lane, Levin and Tsao2016), so only ticks which had successfully molted were included in our survival and lipid index data. Any microcosm that did not contain nymphs at the time of collection (n = 33) was not included in the lipid index analyses.
The AIC values for the mixed-effects model used to determine the relationship between tick survival in the microcosms in Dutchess County, with the fixed effects listed below

The ‘density’ parameter represents the high- vs low-density sites, ‘SOM’ is per cent soil organic matter, and ‘collection’ is the date the microcosms were collected. All models, including the intercept model, include ‘site’ as a random effect. The ΔAIC values are compared against the intercept model.
The AIC values for the mixed-effects model used to determine the relationship between the lipid index values of the ticks collected in Dutchess County, with the fixed effects listed below

Fixed effects are the same as described in table 1. All models, including the intercept model, include ‘site’ as a random effect. The ΔAIC values are compared against the intercept model.
The AIC values for the mixed-effects model used to determine the relationship between tick survival in the microcosms, with the fixed effects listed below between the two collection years

Fixed effects are the same as described in table 1, with the addition of ‘year’ which represents the collection year (2014 – Ithaca + 2016 – Dutchess County). All models, including the intercept model, include ‘site’ as a random effect. The ΔAIC values are compared against the intercept model.
The AIC values for the mixed-effects model used to determine the relationship between the lipid index values of ticks in the microcosms, with the fixed effects listed below between the two collection years

We used a mixed-effects model to analyse the natural density of questing ticks on our six sites in Dutchess County to validate our density categories and compare natural tick densities between years. This model included tick density class (high/low), year (2015/2016) and collection date as fixed effects, with site as a random effect. A linear mixed-effects model was used to detect the relationship between tick survival in the microcosms and lipid index values; because collection date and lipid index were strongly correlated, we included site as a random effect nested within collection date, which was nested within year.
The residuals of all models were checked for normality using Shapiro–Wilk tests and analyses were conducted in R version 3.4.1 (R Core Team, 2017). Mixed-effects models were constructed using the ‘lme4’ package (Bates et al., Reference Bates, Maechler, Bolker and Walker2014), and the degrees of freedom and P values were computed using the Satterthwaite approximation in the ‘lmerTest’ package (Kuznetsova et al., Reference Kuznetsova, Brockhoff and Christensen2017).
Results
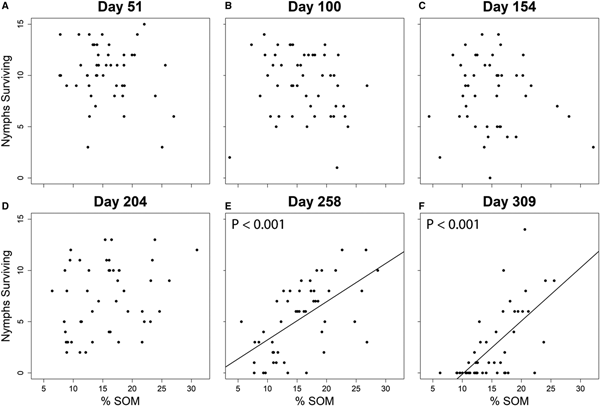
In the Dutchess County trial, tick survival (F = 27.75; d.f. = 5, 265; P < 0.001) and energy storage (F = 63.81; d.f. = 5, 245; P < 0.001) (Table 5) both varied significantly among collection dates, decreasing significantly during the fourth collection, and continuing to decrease further through the final two collections (Fig. 1). A weak positive correlation was observed between nymph survivorship and their lipid index values within microcosms (t = 4.64; d.f. = 145; P < 0.001; r 2 = 0.086). According to our linear mixed-effects model, a significant relationship was detected between % SOM and tick survival, but the relationship was only significant during the final two collection periods in Dutchess County on day 258 (t = 3.90; d.f. = 265; P < 0.001) and day 309 (t = 4.99; d.f. = 265; P < 0.001) (Table 6) (Fig. 2). According to the AIC values, % SOM was excluded from the lipid index analyses (Tables 2 and 4), and in the Ithaca trial, the relationship between survivorship and % SOM was not significant (t = 0.779; d.f. = 109; P = 0.473).
Survival (A) and lipid index values (B) of the nymphal I. scapularis collected from the microcosms in Dutchess County. The points represent the means for the high (solid lines) and low (dashed lines) density sites, and the error bars show the 95% confidence interval for each collection date. The first points (in September) on both figures represent the survival and lipid index of ticks reared under laboratory conditions. Letters represent those time periods which differ significantly (P < 0.05) from one another according to the post-hoc Tukey tests. The sample sizes shown on the figure (n) represent the number of microcosms collected from the high- (top) and low-density (bottom) sites. The points are placed on a continuous axis based upon collection date with t = 0 at the establishment of the field plot.

Scatterplots showing the relationship between nymphal survival and soil organic matter (% SOM) during each of the six collections in Dutchess County. The line is the line of best fit, and no significant relationship (P < 0.05) between survival and % SOM was observed for those collection days which lack lines of best fit and P values in the upper left corner of their scatterplots (A–D). The relationship was significant on those collection dates with P values (E and F).

Results of the mixed-effects model analysing the lipid index values of the ticks in the microcosms in Dutchess County

Collection represents the date of retrieval for the microcosms. This model included site as a random effect.
Results of the mixed-effects model for tick survival in the microcosms in Dutchess County

SOM is per cent soil organic matter and collection is the date of retrieval for the microcosms. This model included site as a random effect.
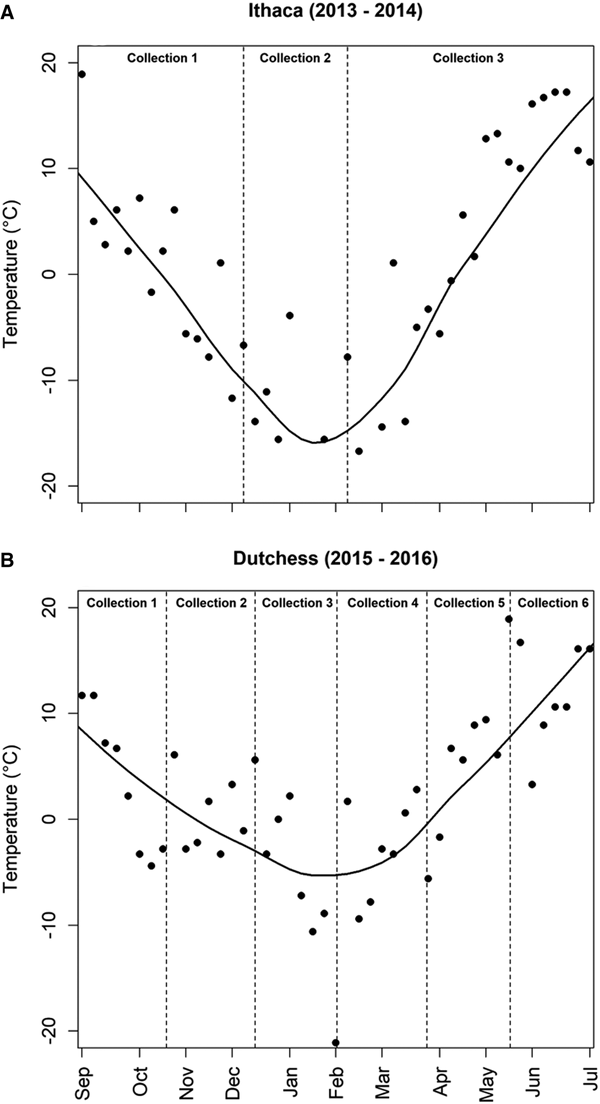
Of the 100 engorged larvae allowed to molt under laboratory conditions during each year, 95% successfully molted into nymphs in 2013 (Ithaca trial), while 94% molted in 2015 (Dutchess County trial). The lipid index of these nymphs did not differ significantly between years (t = −0.50; d.f. = 38; P = 0.620), indicating no difference in initial body condition or molting success for the I. scapularis used during these two field seasons. For the winter collections (December and February), the number of nymphs surviving did not differ significantly between microcosms in Ithaca and Dutchess County, but nymphal survival was significantly higher in Ithaca during the July collection (t = −3.78; d.f. = 208; P < 0.001) (Table 7) (Fig. 3). Similarly, lipid index values did not differ significantly between Ithaca and Dutchess County in December or February, but nymphs from microcosms collected in Dutchess County in July had significantly lower lipid index values than those collected during the same time period in Ithaca (t = −2.84; d.f. = 194; P = 0.005) (Fig. 3) (Table 8). Temperatures were consistently lower in Ithaca than in Dutchess County, with a 3.94 °C difference during the first collection period between September and December, an 8.42 °C difference during the second collection period between December and February, and a difference of 1.94 °C during the third collection period between February and July (Fig. 4).
The comparison of I. scapularis nymphal survival (A) and lipid index values (B) in 2013–2014 in Ithaca NY (solid lines) and 2015–2016 (dashed lines) in Dutchess County NY. Points represent the mean for that sampling period, and the error bars represent the 95% confidence intervals. The first points (in September) on both figures represent the survival and lipid index of ticks reared under laboratory conditions. The * symbol represents a significant (P < 0.01) difference during that sampling period. The sample sizes shown on the figure (n) represent the number of microcosms collected in Ithaca (top) and Dutchess County (bottom). The points are placed on a continuous axis based upon collection date with t = 0 at the establishment of the field plot.

The weekly mean temperatures during the field seasons in Dutchess County (A) and Ithaca (B). The dashed vertical lines show the collection periods for each field season and a smooth line is included to show the general temperature trends.

Results of the mixed-effects model for tick survival in the microcosms between the 2 years (2014 – Ithaca + 2016 – Dutchess County)

SOM is per cent soil organic matter and collection is the date of retrieval for the microcosms. This model includes three collection dates (December + February + July) and site as a random effect.
Results of the mixed effects model analyzing lipid index values of ticks in the microcosms between the two years (2014 – Ithaca + 2016 – Dutchess County)

Collection is the date of retrieval for the microcosms. This model includes three collection dates (December + February + July) and site as a random effect.
The density of I. scapularis was nearly ten times higher on the high-density sites than the low-density sites in Dutchess County for both questing larvae (F = 36.32; d.f. = 1, 46; P < 0.001) and nymphs (F = 69.66; d.f. = 1, 46; P < 0.001). For example, in 2015, tick densities (expressed per 150 m2) on the low-density sites peaked at 1.7 nymphs and 4.7 larvae, while on the high-density sites, the peak nymphal density was 14.0 and the larval density was 39.7. Densities of larvae (F = 8.23; d.f. = 1, 46; P = 0.006) and nymphs (F = 11.89; d.f. = 1, 46; P = 0.001) were significantly higher in 2015 than 2016 (Fig. 5). No significant difference was observed in tick survival or energy use between the high- vs low-density sites (Fig. 1), and this factor was excluded from our analysis according to the AIC value (Tables 1 and 2).
The density of questing nymphs in 2015 (A) and 2016 (B) and larvae in 2015 (C) and 2016 (D) for the high (solid lines) and low (dashed lines) density sites. The points represent the density on the given collection date for each of the sites. All densities are presented as the number of ticks per 150 m2.

Discussion
The majority of the engorged larvae molted in the field before our first microcosm collection in October, which is expected given the timing of their feeding and deployment (Gray et al., Reference Gray, Kahl, Lane, Levin and Tsao2016). Relatively low survival rates were experienced by the I. scapularis nymphs during their molt from engorged larvae, with 31% dying between their initial placement into the microcosms and the first field collection (Fig. 1). In contrast, under laboratory conditions, 94% of the engorged larvae molted successfully, and the relatively low survivorship in the field suggests that I. scapularis is particularly vulnerable when molting under field conditions. Overall survivorship was highest during the winter months, with nymphs collected from our microcosms in December and February exhibiting no significant difference in survival or lipid index values (Fig. 1). Low energy usage during the winter months is likely due to the cold temperatures, as the nymphs stop questing for hosts and enter a behavioural diapause period to conserve energy during a potentially physiologically stressful period (Yuval and Spielman, Reference Yuval and Spielman1990). Survivorship of the I. scapularis nymphs in our microcosms began to decline in March, and reduced survivorship continued through the final collection in July. This pattern was also reflected in the lipid index values, with energy storage being dramatically reduced during the final two collections (Fig. 1).
The significant decrease in both nymphal survival and lipid index values began during the March collection and hence before the beginning of the principal questing period of I. scapularis nymphs in May in the northeastern USA (Levi et al., Reference Levi, Keesing, Oggenfuss and Ostfeld2015). This suggests that warm temperatures, rather than questing activity, may drive the reduction in survivorship we observed in the early spring. Similarly, high temperatures have been observed to reduce energy storage for questing I. ricinus nymphs (Steele and Randolph, Reference Steele and Randolph1985; Van Es et al., Reference Van Es, Hillerton and Gettinby1998; Herrmann and Gern, Reference Herrmann and Gern2012).
Nymphal survivorship was positively correlated with lipid index values within the microcosms, but this relationship was highly variable, likely because ticks with low energy storage died and we were unable to measure their lipid indices. The lipid index values in our July collections averaged 18.4% lower than those of field-collected I. scapularis nymphs in the Hudson Valley (Pool, Reference Pool2018). This difference may have been a result of interannual variation, although it is also possible that collection of I. scapularis nymphs with relatively low energy storage from our microcosms was more efficient than using a drag cloth. Moreover, the phenology of different I. scapularis populations in the USA varies (Arsnoe et al., Reference Arsnoe, Hickling, Ginsberg, McElreath and Tsao2015), and energy use patterns of southeastern populations likely differ from those in the northeastern USA. Lipid indices represent a potent tool for studying the ecology and behaviour of I. scapularis, but information collected from well-controlled laboratory experiments regarding survival and activity thresholds is necessary to allow for more informative comparisons between field studies.
The comparisons of tick survival in our microcosms between the two field seasons in Ithaca and Dutchess County provide additional evidence that overall I. scapularis survivorship is high during the winter months (Fig. 3). Furthermore, despite mid-winter air temperatures that were on average 8.42 °C colder in Ithaca than those in Dutchess County, wintertime I. scapularis survivorship and energy use did not differ significantly between these locations. The lack of cold-related stress on I. scapularis is likely due to their high level of cold tolerance (Burks et al., Reference Burks, Stewart, Needham and Lee1996; Vandyk et al., Reference Vandyk, Bartholomew, Rowley and Platt1996), combined with the protection afforded to ticks by the soil environment. Winter snow has a significant insulating effect on soil temperature (Zhang, Reference Zhang2005), and atmospheric temperatures are generally somewhat disconnected from those in the soil. Our results add to the growing body of evidence that cold winter air temperatures do not have a strong negative impact on I. scapularis survival in much of the northeastern USA and Canada (Lindsay et al., Reference Lindsay, Barker, Surgeoner, McEwen, Gillespie and Robinson1995; Brunner et al., Reference Brunner, Killilea and Ostfeld2012; Ostfeld and Brunner, Reference Ostfeld and Brunner2015; Ogden et al., Reference Ogden and Lindsay2016; Burtis et al., Reference Burtis, Sullivan, Levi, Oggenfuss, Fahey and Ostfeld2016a).
Our detailed overwinter survivorship timeline from the Dutchess County sites shows that I. scapularis experiences high levels of mortality in the spring and early summer, which could explain previously observed negative correlations between questing I. scapularis densities and harsh spring conditions, especially hot, dry weather (Berger et al., Reference Berger, Ginsberg, Dugas, Hamel and Mather2014; Burtis et al., Reference Burtis, Ostfeld, Yavitt and Fahey2016b). We also observed a significant difference in survival at the end of the season between the site in Ithaca and those in Dutchess County. This may be due to the warmer conditions in our Dutchess County field sites (Fig. 4), which may have driven earlier seasonal emergence of the I. scapularis nymphs in our microcosms (Levi et al., Reference Levi, Keesing, Oggenfuss and Ostfeld2015; Monaghan et al., Reference Monaghan, Moore, Sampson, Beard and Eisen2015). We emphasize, however, that our interannual comparison of tick survival at the end of the season (Fig. 3) is limited by the fact that these collections occurred on different sites, so we cannot account for site-dependent factors. Further research regarding the effect of spring and summer weather conditions on I. scapularis physiology and survival is needed. Much of our knowledge regarding the effects of summer conditions on I. scapularis populations is based upon natural densities of questing ticks (Berger et al., Reference Berger, Ginsberg, Dugas, Hamel and Mather2014; Burtis et al., Reference Burtis, Ostfeld, Yavitt and Fahey2016b), but these data can be strongly affected by tick behaviour (Vail and Smith, Reference Vail and Smith1998), such as reduced questing activity to avoid desiccation (Schulze et al., Reference Schulze, Jordan and Hung1997; Perret et al., Reference Perret, Guerin, Diehl, Vlimant and Gern2003). Variation in tick phenology can also affect dragging data as the seasonal onset of questing activity can be affected by weather conditions (Levi et al., Reference Levi, Keesing, Oggenfuss and Ostfeld2015). We suggest that the use of microcosm studies to supplement other data collection efforts will improve our ability to understand the direct effects of weather conditions on I. scapularis population dynamics.
Our data also suggest that population density trends are not always predictive of off-host I. scapularis survival in a particular field site, further highlighting the need to use multiple metrics when evaluating the population dynamics of I. scapularis under field conditions. Despite natural tick densities that differed by nearly an order of magnitude between the high- vs low-density sites in Dutchess County, we observed no significant difference in the survival or lipid index values of I. scapularis collected from microcosms on high- vs low-density sites. At fine scales, tick densities tend to be spatially heterogeneous, and without spatial autocorrelation (Pardanani and Mather, Reference Pardanani and Mather2004), but whether this heterogeneity results from host community dynamics or site factors directly impacting tick off-host survival remains unknown. The probability of finding a host is often a strong factor affecting I. scapularis survival (Levin and Fish, Reference Levin and Fish1998; Ogden et al., Reference Ogden, Bigras-Poulin, O'callaghan, Barker, Lindsay, Maarouf, Smoyer-Tomic, Waltner-Toews and Charron2005), but site factors such as litter depth and understory vegetation can also significantly affect survival (Ostfeld et al., Reference Ostfeld, Cepeda, Hazler and Miller1995; Bertrand and Wilson, Reference Bertrand and Wilson1997). Our six Dutchess County sites were well-matched for those factors that might affect off-host survival, but we still observed large differences in the densities of questing I. scapularis. Therefore, our results highlight the importance of considering both host populations and off-host factors when investigating the spatial distribution of I. scapularis nymphs. It is also important to highlight that survival can vary interannually, therefore it is possible that off-host factors can affect survival more strongly in some years than others. Field studies investigating interannual variability in off-host survival will further illuminate those factors which affect the off-host survivorship of I. scapularis.
We observed a significant effect of SOM content on the survival of I. scapularis nymphs in microcosms, but this effect only emerged during our final two collections in Dutchess County (Fig. 2). Ticks placed in microcosms that contained highly organic soils exhibited higher survivorship, and it is possible that SOM provides protection from climatic exposure for ticks during the spring and early summer when they experience high mortality. Mortality was low in the fall and winter, and the additional insulation from fallen leaves and snow may have reduced the effect of SOM on tick survival in the microcosms during these periods. SOM content did not significantly affect tick survival in our Ithaca collections, probably because of the low spatial variation in SOM within the Ithaca field site. Moreover, average SOM content varied by no more than 4.6% among our six Dutchess County sites; hence, we were unable to evaluate site-level effects on tick survival. Still, SOM varies widely among forest and soil types (Parton et al., Reference Parton, Schimel, Cole and Ojima1987; Berg, Reference Berg2000), and may contribute to variation in tick densities at a localized scale.
In summary, our results indicate that nymphal survivorship of I. scapularis is lowest in the spring and early summer, coincident with reduced nymphal energy reserves. The relationship between survival and energy use within microcosms is tentative due to our inability to collect lipid index data from dead nymphs. We also observed that engorged larvae molting in the field exhibited relatively low survivorship, while survival during the winter months was relatively high even when air temperatures were cold. The lack of relationship between natural I. scapularis densities and overwinter survival suggests that the fine-scale spatial patterns of I. scapularis nymphal populations are not always driven by off-host factors and highlights the need to use multiple metrics when investigating the mechanisms driving tick population dynamics. The relationship we observed between SOM and tick survival in the microcosms suggests that drop-off location within field sites can impact nymphal survival when soil properties are spatially heterogeneous. We focused on general trends occurring during the 10-month period between the I. scapularis larval and nymphal activity peaks, and patterns in off-host survivorship for other periods within the I. scapularis life cycle require further investigation. Finally, we recommend that fine temporal resolution measurements of the relationship among temperature, tick survival and the depletion of energy reserves are needed to conclusively establish the mechanisms of tick mortality during periods of low survivorship.
Supplementary material
The supplementary material for this article can be found at https://doi.org/10.1017/S0031182018002147.
Author ORCIDs
James C. Burtis 0000-0002-8496-985X.
Acknowledgements
We would like to thank Michael Fargione, Todd Bittner, Greg Pitcher and Tim Stanley for their assistance in gaining permissions to use the properties of the Cary Institute, Cornell University, Wilcox Park and Sharpe Reservation respectively. We would also like to thank the New York State Department of Environmental Conservation and the Town of Union Vale for their generous cooperation and permission to conduct research on public properties. Additionally, we would like to thank Dr Patrick Sullivan for his assistance in evaluating our statistical models and Dr Richard Ostfeld for providing field data, guidance and laboratory space at the Cary Institute. We would also like to thank Caroline Pflueger and the members of the Ostfeld laboratory for their spectacular assistance both in the field and the laboratory. Finally, we would like to thank the two anonymous reviewers for their insightful comments, which we believe significantly improved this manuscript.
Financial support
This research received support from the Atkinson Center for a Sustainable Future at Cornell University and the Bentley Holden Fund through the Cary Institute of Ecosystem Studies.
Conflict of interest
None.
Ethical standards
Not applicable.