Implications
The present paper has confirmed that banana meal is a valuable energy source for feeding pigs and demonstrated that delayed harvest stage can improve the energy value of this raw material. In our experimental conditions, up to 60% of meal produced from banana harvested at 900 degrees-days can be fed to the growing-finishing pigs without any detrimental consequences on growth performance.
Introduction
Many tropical countries such as French West Indies (FWI) do not produce grain for livestock feeding and have to import it. As feed represents about 60% to 70% of total cost of production in the pig industry, the high cost of imported feed is a major constraint to the development of the local pig production especially when local meat must compete with cheap imported meat. Within tropical countries, if properly utilized, several local feed resources could greatly contribute to reduce the amount of imported raw material for livestock. Banana is an important agricultural export commodity for many tropical and subtropical countries. In Guadeloupe, bananas accounted for 50% of export earnings in 2011. In practice, bananas are harvested green, and the fruits whose quality does not meet the expected standards are rejected for export. About 15% to 20% of the banana production in the FWI is wasted (Archimède et al., Reference Archimède, Gourdine, Fanchone, Alexandre, Marie Magdeleine, Calif, Fleury, Anais and Renaudeau2011). These discarded bananas (i.e., from 45 000 to 60 000 T/year in the FWI) could constitute a very good source of energy for livestock. However, the high moisture content and the short conservation time of green banana make its transportation difficult, and limit the direct use by animal production units located far from the plantations. Alternatively, ‘rejected’ bananas could be dried and the meal could be used as a substitute of imported corn in pig feeds (Clavijo and Maner, Reference Clavijo and Maner1975; Le Dividich et al., Reference Le Dividich, Geoffroy, Canope and Chenost1978). The main costs of the use of banana meal (BM) would be transportation, the processing and the storage since feed grade bananas can be obtained at almost no cost. There is limited information regarding the nutritional value of BM in pigs (Le Dividich and Canope, Reference Le Dividich and Canope1974; Clavijo and Maner, Reference Clavijo and Maner1975) and this information needs to be reevaluated with actual banana cultivars and pig genotypes.
The purpose of the present work was to determine the nutritional value of green BM in growing pigs according to different harvesting stages and to quantify the effect of gradual substitution of cereals by BM on growth performance and feeding behavior in growing-finishing pigs.
Material and methods
Two trials were designed to study the effect of harvest stage on the nutritional value of BM (trial 1) and to evaluate the consequences of feeding gradual levels of BM on growth performance and feeding behavior in growing pigs (trial 2). Both trials were performed at the experimental facilities of the Institut National de la Recherche Agronomique in Guadeloupe, FWI (latitude 16°N, longitude 61°W). Banana (‘Grande Naine’; AAA genome, Cavendish subgroup) used in both trials was harvested in Guadeloupe. The time of harvesting for green banana, as to other crops, is based on the concept of thermal unit accumulation, expressed as degrees-days (DD). This method sums, from the flower emergence to harvest, the daily average temperature minus a base temperature (22°C for ‘Grande Naine’ cultivar). For export markets, the optimal harvesting time is 900 DD. For this study, banana, once harvested, was sliced with its peal, dried at 60°C for 3 days, using an industrial oven and ground through a 2 mm screen.
Experimental design and animal management
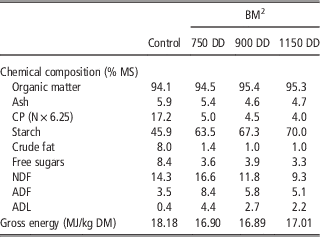
Trial 1 was conducted on 24 castrated Large White (LW) pigs in two batches of 12 pigs each. Within each batch, three blocks of four littermates were chosen where each littermate was randomly assigned to one of the four dietary treatments. At about 40 kg BW, pigs were moved to individual digestibility cages in an open front experimental room. Climatic parameters were not controlled and followed those of the outdoor conditions. Three diets including BM were compared with a control (C) soybean meal-corn diet. The 750 DD, 900 DD and the 1150 DD diets were obtained by substituting 40% (on a DM basis) of the C diet by BM obtained from fruits harvested at 750 DD (early harvesting stage), 900 DD (normal harvesting stage) and 1150 DD (late harvesting stage). The control diet was a commercial pig-grower feed. Experimental diets were prepared by mixing BM with the control diet, water (1:1.5, W/v), and mineral and vitamins mixture (4 g/kg) to maintain a constant level (i.e. 1%) of minerals and vitamins in the final feed. Chemical compositions of C diet and BMs are given in Table 1. The same BMs were used in the two batches. Within each replicate, pigs were adapted to the diet for 10 days before total collection of feces and urine for 8 days. During the adaptation and the collection periods, feed allowance was fixed at about 150 gDM/dayperkg BW0.60. At the beginning of the collection period, the daily DM allowance was calculated for each pig on the average BW basis, estimated form the initial BW and the average BW gain measured during the adaptation period assuming that BW gain was similar in the adaptation and the collection periods. Pigs had free access to water with drinkers designed to avoid spillage.
Chemical composition of control dietFootnote 1 and banana meals (BM) (trial 1)

1 Diet formulated with corn (55%), wheat middling (22%), and soybean meal (17%).
2 750 DD, 900 DD and 1140DD, indicated as early, normal and late stages of harvesting of banana bunch.
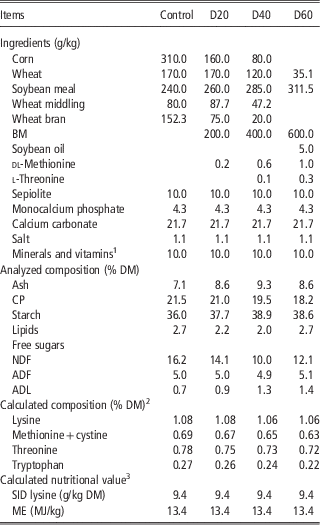
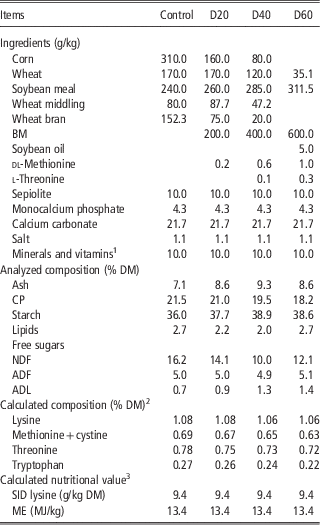
Trial 2 was conducted on a total 72 LW pigs (36 castrated males and 36 gilts). At 10 weeks of age, pigs were weighed and divided into eight groups of nine animals. Each group was constituted by five castrated males and four gilts or four castrated males and five gilts. While being weighed, each pig also had a transponder ear tag inserted to enable individual identification by ‘Acema 64’ (Acemo, Pontivy, France) feed dispenser system. Animals were moved in one of the eight pens (5.7×2.7 m) in an open-front fattening unit and allowed to one of the four dietary treatments (2 pens/diet) differing in the rate of inclusion of BM. These experimental diets were based on wheat, corn, soybean meal, wheat by-products and BM (900 DD) and contained the same amount of digestible lysine and metabolizable energy (ME). We used a basal control diet without BM and diets D20, D40 and D60 containing 20%, 40% and 60% of BM, respectively at the expense of cereals. The experimental diets were processed in a commercial factory according to standard procedures. The feed was provided as pellets and was replenished every day between 0700 and 0800 h to ensure a continuous supply in the feeder. Details on the composition of the experimental diets are given in Table 2. Only four of the eight pens had feed intake recording, so pigs were switched between pens every 2 weeks after being weighed in the morning according to the procedure described by Young et al. (Reference Young, Cai and Dekkers2011). Alternate pens were in the same room and had the same characteristics (except for the feeder). Feeding behavior data from days when pigs were switched between pens were not taken into account. The experiment started after 10 days of adaptation and ended when pigs reached approximately 100 kg live BW.
Composition of experimental diets (trial 2)
BM=banana meal; SID=standardized ileal digestible; ME=metabolizable energy.
1 Minerals and vitamins mixture supplied (g/kg of diet): 10 of Cu (as CuSo4); 80 of Fe (as FeSO4.7H2O); 40 of Mn (as MnO); 100 of Zn (as ZnO); 0.6 of I (as Ca(IO3)2); 0.10 of CO (as CoSO4.7H2O); 0.15 of Se (as Na2SeO3); 5,000 IU of vitamin A; 1000 IU of vitamin D3; 15 IU of vitamin E; 2 mg of vitamin K3; 2 mg of thiamin; 4 mg of riboflavin; 20 mg of nicotinic acid; 10 mg of d-panthothenic acid; 3 mg of pyroxidine; 0.02 mg of vitamin B12; 1.0 mg of folic acid; and 0.2 mg of biotin.
2 Estimated from INRA French tables (Sauvant et al., Reference Sauvant, Perez and Tran2002) considering that AA contents in BM is negligible.
3 SID lysine and ME content were calculated from INRA Tables (Noblet et al. Reference Noblet, Seve and Jondreville2002).
Measurements
Trial 1: All the pigs were weighted at the beginning and the end of the adaptation period, and at the end of the collection period. Every morning, any feed refusal and spillage were collected and dried to measure the DM content (24 h at 103°C). One sample of each experimental diet was also taken daily and pooled at the end of the collection period for DM determination and further chemical analysis. During the 8 days collection period, feces and urine were daily and individually collected and stored at 4°C. Urine was collected with sulphuric acid (0.1 N; 10% v/v) in order to avoid ammonia losses during collection and storage. At the end of the collection period, feces and urine were weighed, homogenized and sub-sampled. One sample of feces was dried (48 h at 103°C) for DM determination and the second was freeze-dried for further analyses.
Trial 2: All the pigs were individually weighed at the beginning of the experiment, and thereafter every 2 weeks until the end of the experiment. An additional weighing was performed at the end of the experiment after a 24 h fasting period. The backfat thickness was measured ultrasonically (Agroscan; E.C.M., Angoulême, France) at the last rib at 45 mm from the midline at the end of the experiment. For pigs housed in pen without electronic feed dispenser, feed intake was measured by the difference between the feed allowed during each 2 weeks period and refusal collected the days when pigs were switched between pens. For the pens equipped with a feed dispenser, the equipment was calibrated at the start of the experiment using a 500 g test weight. Each feeding stalls allows access to only one pig at a time. After each visit to the feeder, the identity of the animal (via the ear-tag transponder), the feeder entry and exit times and the amount of feed consumed were registered and stored in a computer.
Chemical analyses
Diet samples were analyzed for DM, ash, organic matter (AOAC Method N°923.03), CP (N×6.25; AOAC Method N°992.15), and ether extract (AOAC Method N°945.16) (AOAC, 1990), for free sugars according to Tollier and Robin (Reference Tollier and Robin1979) and for gross energy (GE) content using an adiabatic bomb calorimeter (C5000; IKA, Staufen, Germany). Starch content was determined using the UV method for the determination of starch in foods and other materials (Enzy Plus Starch kit Biocontrol). Dry fecal samples were analyzed for DM, GE, ash, ether extract and CP and fresh samples of urine for N. Cell wall components (NDF, ADF and ADL; AOAC Methods 200.04 and 973.18) in diet samples were determined according to the Van Soest and Wine method (Reference Van Soest and Wine1967).
Calculation and statistical analyses
From data produced in trial 1, apparent digestibility coefficients of nutrient and energy were calculated according to standard procedures. Digestible energy (DE) content was calculated as the difference between measured GE intake and energy loss in feces. ME content of diets was calculated as the difference between DE and energy loss in urine estimated from N loss (g/day) according to the equation of Le Goff and Noblet (Reference Le Goff and Noblet2001; energy loss in urine (kJ/day)=345+31.1×N loss in urine (g/day), R 2=0.94, r.s.d.=110). Data were analyzed by using an ANOVA including the effects of diet, batch, block effect within each batch and their interactions each animals being considered the experimental unit. The digestive utilization and energy values of the different BMs were calculated according to the difference method assuming that the nutrient digestibility of the control diet was constant in the experimental diets.
To allow comparison with results from other studies, successive feeder visits were grouped into the same meal using a meal criterion defined as the maximum length of a within-meal interval (i.e. short pauses belonging to the same meal) between visits. Visits separated by intervals shorter than the meal criterion were considered to be part of the same meal. A meal criterion was estimated using the log survivor curve technique as described by Labroue et al. (Reference Labroue, Guéblez, Sellier and Meunier-Salaün1994). The meal criterion of 2 min was established by the latter authors from LW pigs in experimental conditions similar to the present ones. According to this 2-min meal criterion, the components of feeding behavior were calculated for each pig as following: daily number of meals, daily feed intake (g), total ingestion time per day (i.e. total duration of all feeding bouts (min)), ingestion rate (i.e. total feed intake/total ingestion time (g/min)), the average feed intake per meal (total feed consumption/number of meals (g)), and the average ingestion time per meal (total ingestion time/number of meals (min)). Feeding behavior data were pooled by 2 weeks period and were submitted to an ANOVA including the effect of diet, sex, period of measurements, block and their interactions. The animal (n=17 or 18/treatment) was considered the experimental unit. Mean growth performance (except feed conversion ratio (FCR)) were submitted to an ANOVA taking into account the effect of diet, sex, pen, block and interactions. The FCR was calculated on a pen basis for each period of measurement and computed with an ANOVA with diet, pen, and interactions as main effects. Each pen of pigs (2/treatment) was the experimental unit.
Results
Digestibility study (trial 1)
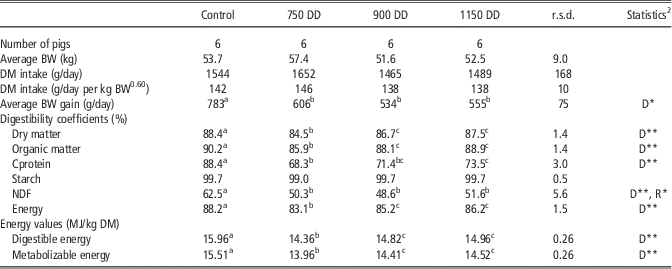
As planned, average BW and DM intake were not affected by diet composition (Table 3). During the collection period, the ADG was significantly higher for control diet than for diets including BM (783 v. 565 g/day; P<0.05). This can be partly explained by the reduced CP contents when compared with the control diet (12.3% on average v. 17.2%; data not shown). The inclusion of 40% of BM reduced the digestibility coefficients of nutrients and energy. This effect was related to the stage of harvesting. When compared with the control diet, the digestibility coefficients of organic matter and energy were reduced by 4.3% and 5.1%, respectively for the 750 DD diet (P<0.05) and by 1.7% and 2.5% for the 900 DD and 1050 DD diets. Whatever the stage of harvesting, the digestibility coefficient of NDF was significantly lower in diets with 40% BM than in the control ones (50.2% v. 62.5%; P<0.01). The effect of dietary treatment on DE and ME values followed the same trends as those observed for digestibility coefficients of energy. Higher DE and ME values were found for control diet (15.96 and 15.51 MJ/kg DM, respectively) than for diets with BM. Among the three other diets, DE and ME values were greater (P<0.05) in diet 900 and 1150 DD than in diet 750 DD (Table 3).
Digestive utilization of experimental dietsFootnote 1 (least square means)

r.s.d.=residual standard deviation.
1 750 DD, 900 DD and 1150 DD diets composing 40% banana meal and 60% of control diet.
2 ANOVA, taking into account the effect of dietary treatment (D), Replicate (R), block within each replicate and their interaction.Least square means with different superscripts differed (P<0.05) from dietary treatments. Each animals (n=6/treatment) was the experimental unit.
*P<0.05, **P<0.01.
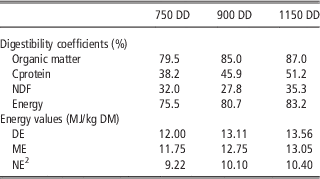
The experimental diets were prepared to calculate digestibility coefficients of energy and energy values of BM according to different stages of harvesting. These values were calculated by difference. Data shown in Table 4 indicate that the digestibility coefficient of energy increased with the degree of maturity. It was increasing by 5.2% between 750 and 900 DD and by only 2.5% between 900 and 1150 DD. Similar results were obtained for DE and ME values (Table 4).
Apparent nutrient digestibility coefficients and energy values of banana meal according to stages of harvestingFootnote 1

DE=digestible energy; ME=metabolizable energy; NE=net energy.
1 Value calculated according to difference methods.
2 The NE values were estimated by NEg8 equation, published by Noblet et al. (Reference Noblet, Fortune, Shi and Dubois1994).
Growth trial (trial 2)
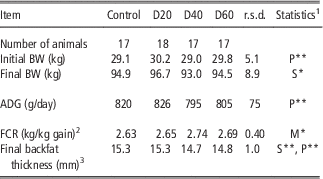
The chemical composition of experimental diets given in Table 2 was in agreement with the objectives of the experiment. At the beginning of the experiment, pigs were 83 days old and averaged 29.5 kg BW. Two pigs were removed at the beginning of the experiment because of leg problems (diets C diet and D20) and one pig died for unknown reasons after 27 days of experiment (diet D40). As shown in Table 5, the diet composition did not influence the ADG and FCR (812 g/day and 2.75 kg/kg on average, respectively; P>0.05). The backfat thickness at the end of the experiment was similar (P=0.19) for all diets (15.0 mm on average). The final BW and backfat thickness were found significantly higher in barrows than in gilts (97.1 v. 92.5 kg and 15.4 v. 14.7 mm, respectively). The ADG tended to be higher in barrows than in gilts (828 v. 794 g/day; P=0.079).
Effect of banana meal on performance of growing pigs (least square means)

r.s.d.=residual standard deviation.
1 ANOVA taking into account the effect of dietary treatment (D), sex (S), pen (P) within dietary treatment and block. Each animal was the experimental unit.
2 Adjusted for an average dry matter of 88.0% and calculated per pen for each 2 week measurement period. These data computed by ANOVA, involving the effect of dietary treatment (D), period of measurements (M), their interactions. Each pen of pigs was the experimental unit.
3 Mean values of ultra sound measurements performed on the back and shoulder.
*P<0.05, **P<0.01.
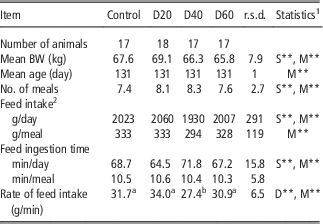
During the growing period, pigs were measured three times for their individual feed intake and feeding behavior. The average BW and age for these measurements were 67.2 kg at 131 days, respectively and they did not differ among diets (Table 6). Logically, most of the feeding behavior parameters were influenced by the period of measurement in connection with the increase of BW. The rate of feed intake was significantly lower in pigs fed D40 compared with the other diets (32.2 v. 27.4 g/min; P<0.01). As the average daily feed intake was similar among the diets (2.0 kg/day; P=0.150), the numerical increase in the feed ingestion time in D40 (71.8 v. 66.8 min/day; P=0.128) was mainly related to the higher rate of feed intake. Meal characteristics were not influenced (P>0.05) by the dietary treatment. Gilts compared with barrows made less frequent meals (7.0 v. 8.7 meals/day; P<0.01), ate less (2132 v. 1878 g/day; P<0.01) and spent less time eating (64.5 v. 71.6 min/day; P<0.01).
Effect of banana meal on feeding behavior of growing pigs (least square means)

r.s.d.=residual standard deviation.
1 ANOVA taking into consideration the effect of dietary treatment (D), sex (S), period of measurement (M) and block within D. Least square means with a different superscripts differed (P<0.05) from dietary treatment each individual pig was the experimental unit. *P<0.05, **P<0.01.
2 Values adjusted for 88.0% dry matter.
Discussion
Whatever the stage of harvesting, the unpeeled green BM was lower in starch (67.0 v. 74.2 g/100 g DM), CP (5.0 v. 9.4 g/100 g DM), fat (1.1 v. 4.3 g/100 g DM), and subsequently lower in GE (16.9 v. 18.7 MJ/kg DM) compared to corn (Sauvant et al., Reference Sauvant, Perez and Tran2002). The NDF content was rather similar in BM and corn (12.4 v. 10.4/100 g) but detergent fiber fractions (DF) of BM was more lignified compared with corn (25 v. 5 g lignin/100 g NDF). The low energy digestibility of BM compared with corn (75.5% to 83.2% v. 88% in corn; Noblet et al., Reference Noblet, Seve and Jondreville2002) can be mainly explained by both its reduced concentration in highly digestible nutrients (fat, starch) and the high proportions of non-fermentable fiber and lignin in the DF. According to the low energy digestibility coefficient but also to the low GE content in BM, DE and ME contents of BM was 18% to 27% lower than corn depending on the age of harvesting (Noblet et al., Reference Noblet, Seve and Jondreville2002). The DE content reported in the present study for BM (12.0MJ/kg to 13.6 MJ/kg DM with an average value of 12.8 MJ/kg DM) is rather similar to values reported in young pigs by Le Dividich and Canope (Reference Le Dividich and Canope1974) (13.3 MJ/kg DM) and in growing pigs by Clavijo and Maner (Reference Clavijo and Maner1975) (13.4 MJ/kg DM) but it was lower that the value obtained from plantain meal by Restrepo and Gonzalo (Reference Restrepo and Gonzalo1973) (15.1 MJ/kg DM). This higher DE value in plantains is mainly related to its greater content of starch compared with bananas (Ly, Reference Ly2004; Heuzé et al., Reference Heuzé, Tran, Archimède, Lessire and Renaudeau2011).
To our knowledge few papers have been published on the effect of the harvest stage on the nutritional values of BM in pigs. The present study has shown clearly that energy digestibility coefficient, DE and ME values of BM increase with the age of harvesting. Expressed as a percentage of ME measured at 750 DD, ME content increased by 8% and 10%, respectively at 900 and 1150 DD. This can be related to a change in chemical composition (more starch and less DF) with the development of the fruit and the increase in the pulp to peel ratio from 750 to 1150 DD. In particular, NDF content is an important component limiting the total tract digestibility of nutrient and energy due to the low digestibility of DF fraction and its possible interaction with other nutrients.
The first practical application of the study is to provide valuable information to help producers to make a good decision for the best harvesting stage of bananas for producing BM for feeding pigs. When compared with the standard harvest time of 900, 1150 DD delays the date of harvest by about 30 days. Practically, the yield of fruits (T DM/ha) is improved by about 15% during this time lag (Lassoudière et al., Reference Lassoudière, Frossard and Sarah1978) which potentially represents a gain of about 20% of energy (ME) for pigs per unit of surface. In other words, for banana plantations specifically dedicated for meal production for feeding pigs, a delayed harvesting stage at 1150 DD could be advised. However, in practice only non-marketed fruits harvested at 900 DD are currently valued for feeding livestock. In consequence, we decided to use BM produced from bananas harvested at 900 DD for determining the optimal incorporation rate of BM for growing pigs.
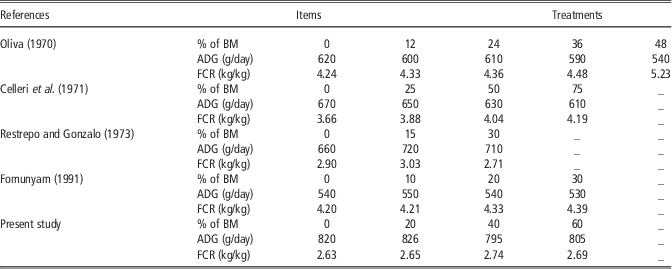
In trial 2, BM was used as a substitute for cereal grain to supply 0%, 20%, 40% or 60% of the total diet for growing-finishing pigs. Based on the results obtained in trial 1, the experimental diets were formulated in order to maintain constant ME and digestible lysine contents. Increasing the level of incorporation of BM did not have negative effect on ADG and FCR. This means that up to 60% of BM can be fed to growing/finishing pigs without any adverse effects on growth performance. Similarly, growth performance remained constant in post-weaning pigs fed by diets with 15% or 30% of green BM (Restrepo and Gonzalo, Reference Restrepo and Gonzalo1973) (Table 7). However, some other works performed in Equator (Oliva, Reference Oliva1970), in Colombia (Celleri et al., Reference Celleri, Oliva and Maner1971) and in Cameroon (Fomunyam, Reference Fomunyam1991) in growing finishing pigs showed a gradual decrease in both ADG and FCR when level of BM increase (Table 7). In most of the latter studies, corn has been substituted on an equal weight basis with BM leading to an overestimation of energy value of BM with negative effects on growth performance. In addition, in the present study, the amino acids supply by BM was likely negligible (Ly, Reference Ly2004). Thus, the major part of digestible amino acids was provided by soybean meal and synthetic amino acids. Accordingly, it can be hypothesized that the linear depression in growth performance with increasing level of BM observed in the literature is also related to a dietary amino acid deficiency.
Effect of various level of green BM on performance of growing finishing pigs: literature survey

BM=banana meal; FCR=feed conversion ratio.
The inclusion of high-dietary level of BM adversely affected the pellets processing. Problems during pellets processing (low hardness and durability, resistance to flow of the mash feed through the die, etc.) have been detected by the manufacturer at the beginning of the D40 feed production. This problem concerned to only 5% on the total fabrication (200 kg on a total of 4 T). According to the limited availability of BM, this amount of feed was not discarded and it was mixed with 95% of ‘normal’ feed. The pelleting problem was solved by increasing the retention time of the mash feed into the steam conditioner before the pelleting processing. These changes were also applied for pelleting D60 diet. In practice, these results suggest that pelletability of diets would decrease with increased rate of BM without any changes during the processing. During feed pelleting, heat and water added in the conditioner will alter components like starch and protein in the feed mash in a way that binding properties come into effect (Abdollahi, Reference Abdollahi2011). As the gelatinization temperature of banana starch is higher than that of cereals (corn, wheat) (Ling et al., Reference Ling, Osman, Fernandes and Reilly1982). more heat is required for the banana starch to be gelatinized. In other words, the pelleting problems encountered at the beginning of the D40 diet fabrication could result from an insufficient temperature in the conditioner. As a longer retention time in the conditioner indirectly increases the temperature (Stark, Reference Stark2012), logically the change in this parameter in the present study has resulted to an improved pellet quality. However, the pelleting properties in diets with high level of BM have been decreased in relation to the substitution of raw materials with high binding properties (wheat products; Wood, Reference Wood1987) by-products with low pelletability characteristics (BM and/or fat).
A striking result of the present study was the reduced rate of feed intake in pigs fed D40 diet. As the rate of feed intake and feed acceptance are generally positively related (Bigelow and Houpt, Reference Bigelow and Houpt1988), it could be suggested that the D40 diet was less palatable when compared with the three others diets. Solà-Oriol et al. (Reference Solà-Oriol, Roura and Torrallardona2009) suggested that feed characteristics such as texture, taste or odor may be responsible for the change in feed preference in pigs. Undesirable chemical reactions and/or physical changes are supposed to have occurred during the process of D40 diet which affected its palatability. This hypothesis is purely speculative and remains to be confirmed by further works.
Acknowledgements
The authors would like to acknowledge the staff of the experimental station of PTEA for their technical assistance in the care of pigs, and T. Etienne, S. Calif, Y. Jaguelin for the laboratory analysis. This work was supported by the European Union (FEOGA FEDER), SICA Les Producteurs de Guadeloupe and les Grands Moulins des Antilles.