Introduction
Parasites draw resources from and may have negative influences on individual hosts, with repercussions on their growth, development, metabolism, behaviour and reproduction (Goater and Ward, Reference Goater and Ward1992; Poulin, Reference Poulin1999; Jong-Brink et al., Reference Jong-Brink, Bergamin-Sassen and Soto2001; Robar et al., Reference Robar, Murray and Burness2011). At the population level, effects on host abundance (Scott and Dobson, Reference Scott and Dobson1989), reproduction (Engelstädter and Hurst, Reference Engelstädter and Hurst2009) and survival (Ebert et al., Reference Ebert, Lipsitch and Mangin2000) have been reported. Parasites can differentially affect the fitness of sympatric species by favouring one species over the other based on host species physiology and environmental context (Schall, Reference Schall1992), and thus with a potential role mediating interspecific competition and/or as biological markers of stress in competing hosts. Nevertheless, the effects of competition between host species and its impact on parasitaemia are still largely understudied so in this study we enquire whether blood parasites can also serve as biomarkers of interspecific competition.
Reptiles are commonly infected by haemogregarines (Adeleorina), a group of apicomplexan blood parasites (Telford, Reference Telford2009). Morphological identification of these parasites is, however, problematic, given their small size, their different morphological stages, and the blood smear quality, among others (Hassl, Reference Hassl2012). Contemporary molecular methods contribute to overcoming some of these difficulties and are nowadays commonly used for detection, identification and even quantification of blood parasites (Maia et al., Reference Maia, Harris, Carranza and Gómez-Díaz2014).
Blood parasites commonly infect lizard hosts across Europe (Haklová-Kočíkova et al., Reference Haklová-Kočíková, Hižňanová, Majláth, Račka, Harris, Földvári, Tryjanowski, Kokošová, Malčeková and Majláthová2014; Megía-Palma et al., Reference Megía-Palma, Martínez and Merino2018a, Reference Megía-Palma, Martínez, Cuervo, Belliure, Jiménez-Robles, Gomes and Merino2018b, Zechmeisterová et al., Reference Zechmeisterová, De Bellocq and Široky2019), including the host genera Podarcis and Iberolacerta (Hassl, Reference Hassl2012; Megía-Palma et al., Reference Megía-Palma, Jiménez-Robles, Hernández-Agüero and Riva2020a). These parasites typically infect red blood cells of lizard hosts, where their infection can be associated with anaemia and impaired tail regeneration (Oppliger and Clobert, Reference Oppliger and Clobert1997; Megía-Palma et al., Reference Megía-Palma, Jiménez-Robles, Hernández-Agüero and Riva2020a, Reference Megía-Palma, Arregui, Pozo, Žagar, Serén, Carretero and Merino2020b), hindered locomotor activity (Oppliger et al., Reference Oppliger, Celerier and Clobert1996; Garrido and Pérez-Mellado, Reference Garrido and Pérez-Mellado2013), and reduced survival of reproductive individuals (Sorci et al., Reference Sorci, Clobert and Michalakis1996). At the same time, the negative effect of blood parasites in lizard hosts is puzzling because while some previous studies indicated negative effects associated with the infection (Lazić et al., Reference Lazić, Carretero, Živković and Crnobrnja-Isailović2017; Megía-Palma et al., Reference Megía-Palma, Jiménez-Robles, Hernández-Agüero and Riva2020a), others showed neutral or even positive correlation between parasitism intensity and fitness-related traits (Amo et al., Reference Amo, López and Martín2004; Ekner-Grzyb et al., Reference Ekner-Grzyb, Sajkowska, Dudek, Gawałek, Skórka and Tryjanowski2013; Damas-Moreira et al., Reference Damas-Moreira, Harris, Rosado, Tavares, Maia, Salvi and Perera2014; Megía-Palma et al., Reference Megía-Palma, Martínez and Merino2016). Moreover, parasite intensity is also modulated with other life-history traits, such as host sex and size (Schall, Reference Schall1992; Smallridge and Bull, Reference Smallridge and Bull2000; Álvarez-Ruiz et al., Reference Álvarez-Ruiz, Megía-Palma, Reguera, Ruiz, Zamora-Camacho, Figuerola and Moreno-Rueda2018; Arakelyan et al., Reference Arakelyan, Harutyunyan, Aghayan and Carretero2019), reproductive effort (Veiga et al., Reference Veiga, Salvador, Merino and Puerta1998), host body and physiological condition (Salvador et al., Reference Salvador, Veiga, Martin, Lopez, Abelenda and Puertac1996), habitat type (Carbayo et al., Reference Carbayo, Martín and Civantos2019), host density (Arneberg et al., Reference Arneberg, Skorping, Grenfell and Read1998) and environmental stress (Oppliger et al., Reference Oppliger, Celerier and Clobert1996, Reference Oppliger, Clobert, Lecomte, Lorenzon, Boudjemadi and John-Alder1998; Megía-Palma et al., Reference Megía-Palma, Arregui, Pozo, Žagar, Serén, Carretero and Merino2020b).
Different blood parasite lineages may exploit their hosts in different manners (e.g. Alizon et al., Reference Alizon, de Roode and Michalakis2013) and, thus, it is pertinent that blood parasites are identified at the molecular level to allow analysing their likely differential relationships with the host. Although phylogenetic relationships and taxonomy of blood parasites of lizards remain controversial (Karadjian et al., Reference Karadjian, Chavatte and Landau2015; Maia et al., Reference Maia, Carranza and Harris2016; O'Donoghue, Reference O'Donoghue2017; Hrazdilová et al., Reference Hrazdilová, Červená, Blanvillain, Foronda and Modrý2021), the genera recognized as infecting lizards are Hepatozoon, Karyolysus and Bartazoon (see Maia et al., Reference Maia, Carranza and Harris2016; Hrazdilová et al., Reference Hrazdilová, Červená, Blanvillain, Foronda and Modrý2021). Parasites in the three genera are transmitted by invertebrate hosts such as mites and ticks (Telford, Reference Telford2009; Karadjian et al., Reference Karadjian, Chavatte and Landau2015). Karyolysus specifically undergo two cycles of asexual reproduction, one in the lizard and the other in the definitive invertebrate host where sexual reproduction also occurs (Reichenow, Reference Reichenow1919). Karyolysus primarily infects Palearctic lizards in Europe (Svahn, Reference Svahn1974; Álvarez-Calvo, Reference Álvarez-Calvo1975; Beyer and Sidorenko, Reference Beyer and Sidorenko1984; Haklová-Kočíková et al., Reference Haklová-Kočíková, Hižňanová, Majláth, Račka, Harris, Földvári, Tryjanowski, Kokošová, Malčeková and Majláthová2014; Tomé et al., Reference Tomé, Pereira, Harris, Carretero and Perera2019; Zechmeisterová et al., Reference Zechmeisterová, De Bellocq and Široky2019). Mites of the genus Ophionyssus are postulated as definitive hosts and vectors of the genus Karyolysus (Reichenow, Reference Reichenow1913; Svahn, Reference Svahn1975; Haklová-Kočíková et al., Reference Haklová-Kočíková, Hižňanová, Majláth, Račka, Harris, Földvári, Tryjanowski, Kokošová, Malčeková and Majláthová2014).
To investigate the connection between parasites and host species in competition, this study focuses on a pair of sympatric lizard host species under different competition scenarios. The common wall lizard (Podarcis muralis) is a widespread lizard inhabiting a wide range of natural and anthropic habitats (Speybroeck et al., Reference Speybroeck, Beukema, Bok, Voort and Velikov2016).To date, several genetic lineages have been recognized to coincide with European glacial refugia, one of which is located in southern Slovenia (Salvi et al., Reference Salvi, Harris, Kaliontzopoulou, Carretero and Pinho2013). In contrast, the Horvath's rock lizard (Iberolacerta horvathi) is endemic, ranging from the northern Dinaric karst in Croatia to the pre-Alpine and Alpine regions of Austria and Italy (Krofel et al., Reference Krofel, Cafuta, Planinc, Sopotnik, Šalamun, Tome, Vamberger and Žagar2009; Žagar et al., Reference Žagar, Carretero, Krofel, Lužnik, Podnar and Tvrtković2014). It commonly inhabits higher altitudes with some exceptions (Žagar, Reference Dormann, Calabrese, Guillera-Arroita, Matechou, Bahn, Barton, Beale, Ciuti, Elith and Gerstner2016). A recent phylogeographic study (Cocca et al., Reference Cocca, Žagar, Sillero, Jowers, Krofel, Lužnik, Podnar, Tvrtković, Carretero and Crottini2021) suggests that this species survived in situ during the glaciations in southern Slovenia. Both species overlap geographically in Slovenia (Krofel et al., Reference Krofel, Cafuta, Planinc, Sopotnik, Šalamun, Tome, Vamberger and Žagar2009) with P. muralis being more common at lower altitudes (Žagar, Reference Žagar2008; Krofel et al., Reference Krofel, Cafuta, Planinc, Sopotnik, Šalamun, Tome, Vamberger and Žagar2009). At the local level, the two species may occur in syntopy with a high trophic overlap (Richard and Lapini, Reference Richard and Lapini1993; Žagar et al., Reference Žagar, Kos and Vrezec2013) and competing for basking space (Žagar et al., Reference Žagar, Carretero, Osojnik, Sillero and Vrezec2015b). They also share common predators, with I. horvathi displaying more conservative antipredator strategies (Žagar et al., Reference Žagar, Bitenc, Vrezec and Carretero2015a). The two species have similar morphology and performance (Žagar et al., Reference Žagar, Osojnik, Carretero and Vrezec2012; Žagar et al. Reference Žagar, Carretero, Vrezec, Drašler and Kaliontzopoulou2017), although they differ in some eco-physiological traits; for example, I. horvathi having a higher metabolic potential (Žagar et al., Reference Žagar, Simčič, Carretero and Vrezec2015c), being more resistant to dehydration (Osojnik et al., Reference Osojnik, Žagar, Carretero, García-Muñoz and Vrezec2013) and maintaining the same preferred temperatures throughout the year, unlike P. muralis, which shows seasonal acclimatization (Osojnik et al., Reference Osojnik, Žagar, Carretero, García-Muñoz and Vrezec2013).
Despite the comprehensive investigations on the role of blood parasites in competition dynamics performed in other host models (Hatcher et al., Reference Hatcher, Dick and Dunn2006), evidence is still very scarce in lizards (i.e. a single study on the genus Plasmodium on Anolis lizards; Schall, Reference Schall1992). Due to previous indications on the capability of particular parasite lineages to invade closely related lacertid hosts (Megía-Palma et al., Reference Megía-Palma, Martínez and Merino2018a, Reference Megía-Palma, Martínez, Cuervo, Belliure, Jiménez-Robles, Gomes and Merino2018b), it was expected that the studied species will share some of the parasites. The objective of this study was to identify and quantify haemoparasites in allotopic and syntopic populations of two host species, I. horvathi and P. muralis. More specifically, the goal was to determine whether host species share the same parasite lineages, and, whether the two lizard species have consistent differences in parasitism in syntopy and allotopy. Given that competition could weaken the host and based on previous evidence regarding asymmetric competition between these lizard species, it was hypothesized that I. horvathi, the host species with more restricted distribution and lower competitive potential, will achieve higher parasitemia levels in syntopic sites. Should this occur, it would support the concept that I. horvathi can be more susceptible to the infection by blood parasites in localities where both lizard hosts co-occur. On the other hand, differential susceptibility to parasite infection in competing host species could affect their competitive relationship. To this aim, molecular methods were used to identify and characterize the genetic diversity of haemogregarine parasites in both host species, and analysis of parasitaemia was conducted across host populations, including allotopic (where only one host species was present) and syntopic populations (where both lizard species were present and competition is likely to occur) (Žagar et al., Reference Žagar, Carretero, Osojnik, Sillero and Vrezec2015b).
Materials and methods
Sampling
Adult lizards were collected within the area of occurrence of both species in Slovenia (Krofel et al., Reference Krofel, Cafuta, Planinc, Sopotnik, Šalamun, Tome, Vamberger and Žagar2009; Žagar, Reference Žagar2016) between May and August of 2018 and 2019. Blood smears for evaluation of parasitemia were collected from eight locations (five syntopic populations, plus one allotopic P. muralis and two allotopic I. horvathi, Fig. 2). For genetic analysis of parasites, samples were collected in the field in 2018 and 2019. Additionally, samples obtained before 2018 and stored in the CIBIO collection in Portugal were also included in the end totalling ten successfully sampled locations for the genetic analysis (two allotopic P. muralis, four allotopic I. horvathi and four syntopic, Fig. 1). All sampling sites were located in areas of moderate climate of hilly regions (Kozjek et al., Reference Kozjek, Dolinar and Skok2017) (Fig. 1). Primary vegetation on most sampling sites comprises a deciduous forest transitioning into an open landscape with shrubs and rock walls of natural or anthropogenic origin (Perko and Orožen Adamič, Reference Perko and Orožen Adamič1998). Lizards were caught with a noose and species were identified based on head scalation (Breg et al., Reference Breg, Janota, Peganc, Petrovič, Tome and Vamberger2010) and sexed based on colouration, femoral pore size and presence of hemipenises (Kryštufek and Janžekovič, Reference Kryštufek and Janžekovič1999). The exact location of each captured individual was recorded by GPS and its snout–vent length (SVL) was measured using a digital calliper to the nearest 0.1 cm.
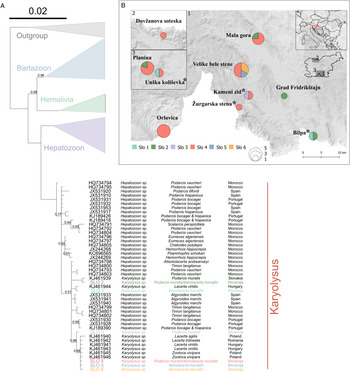
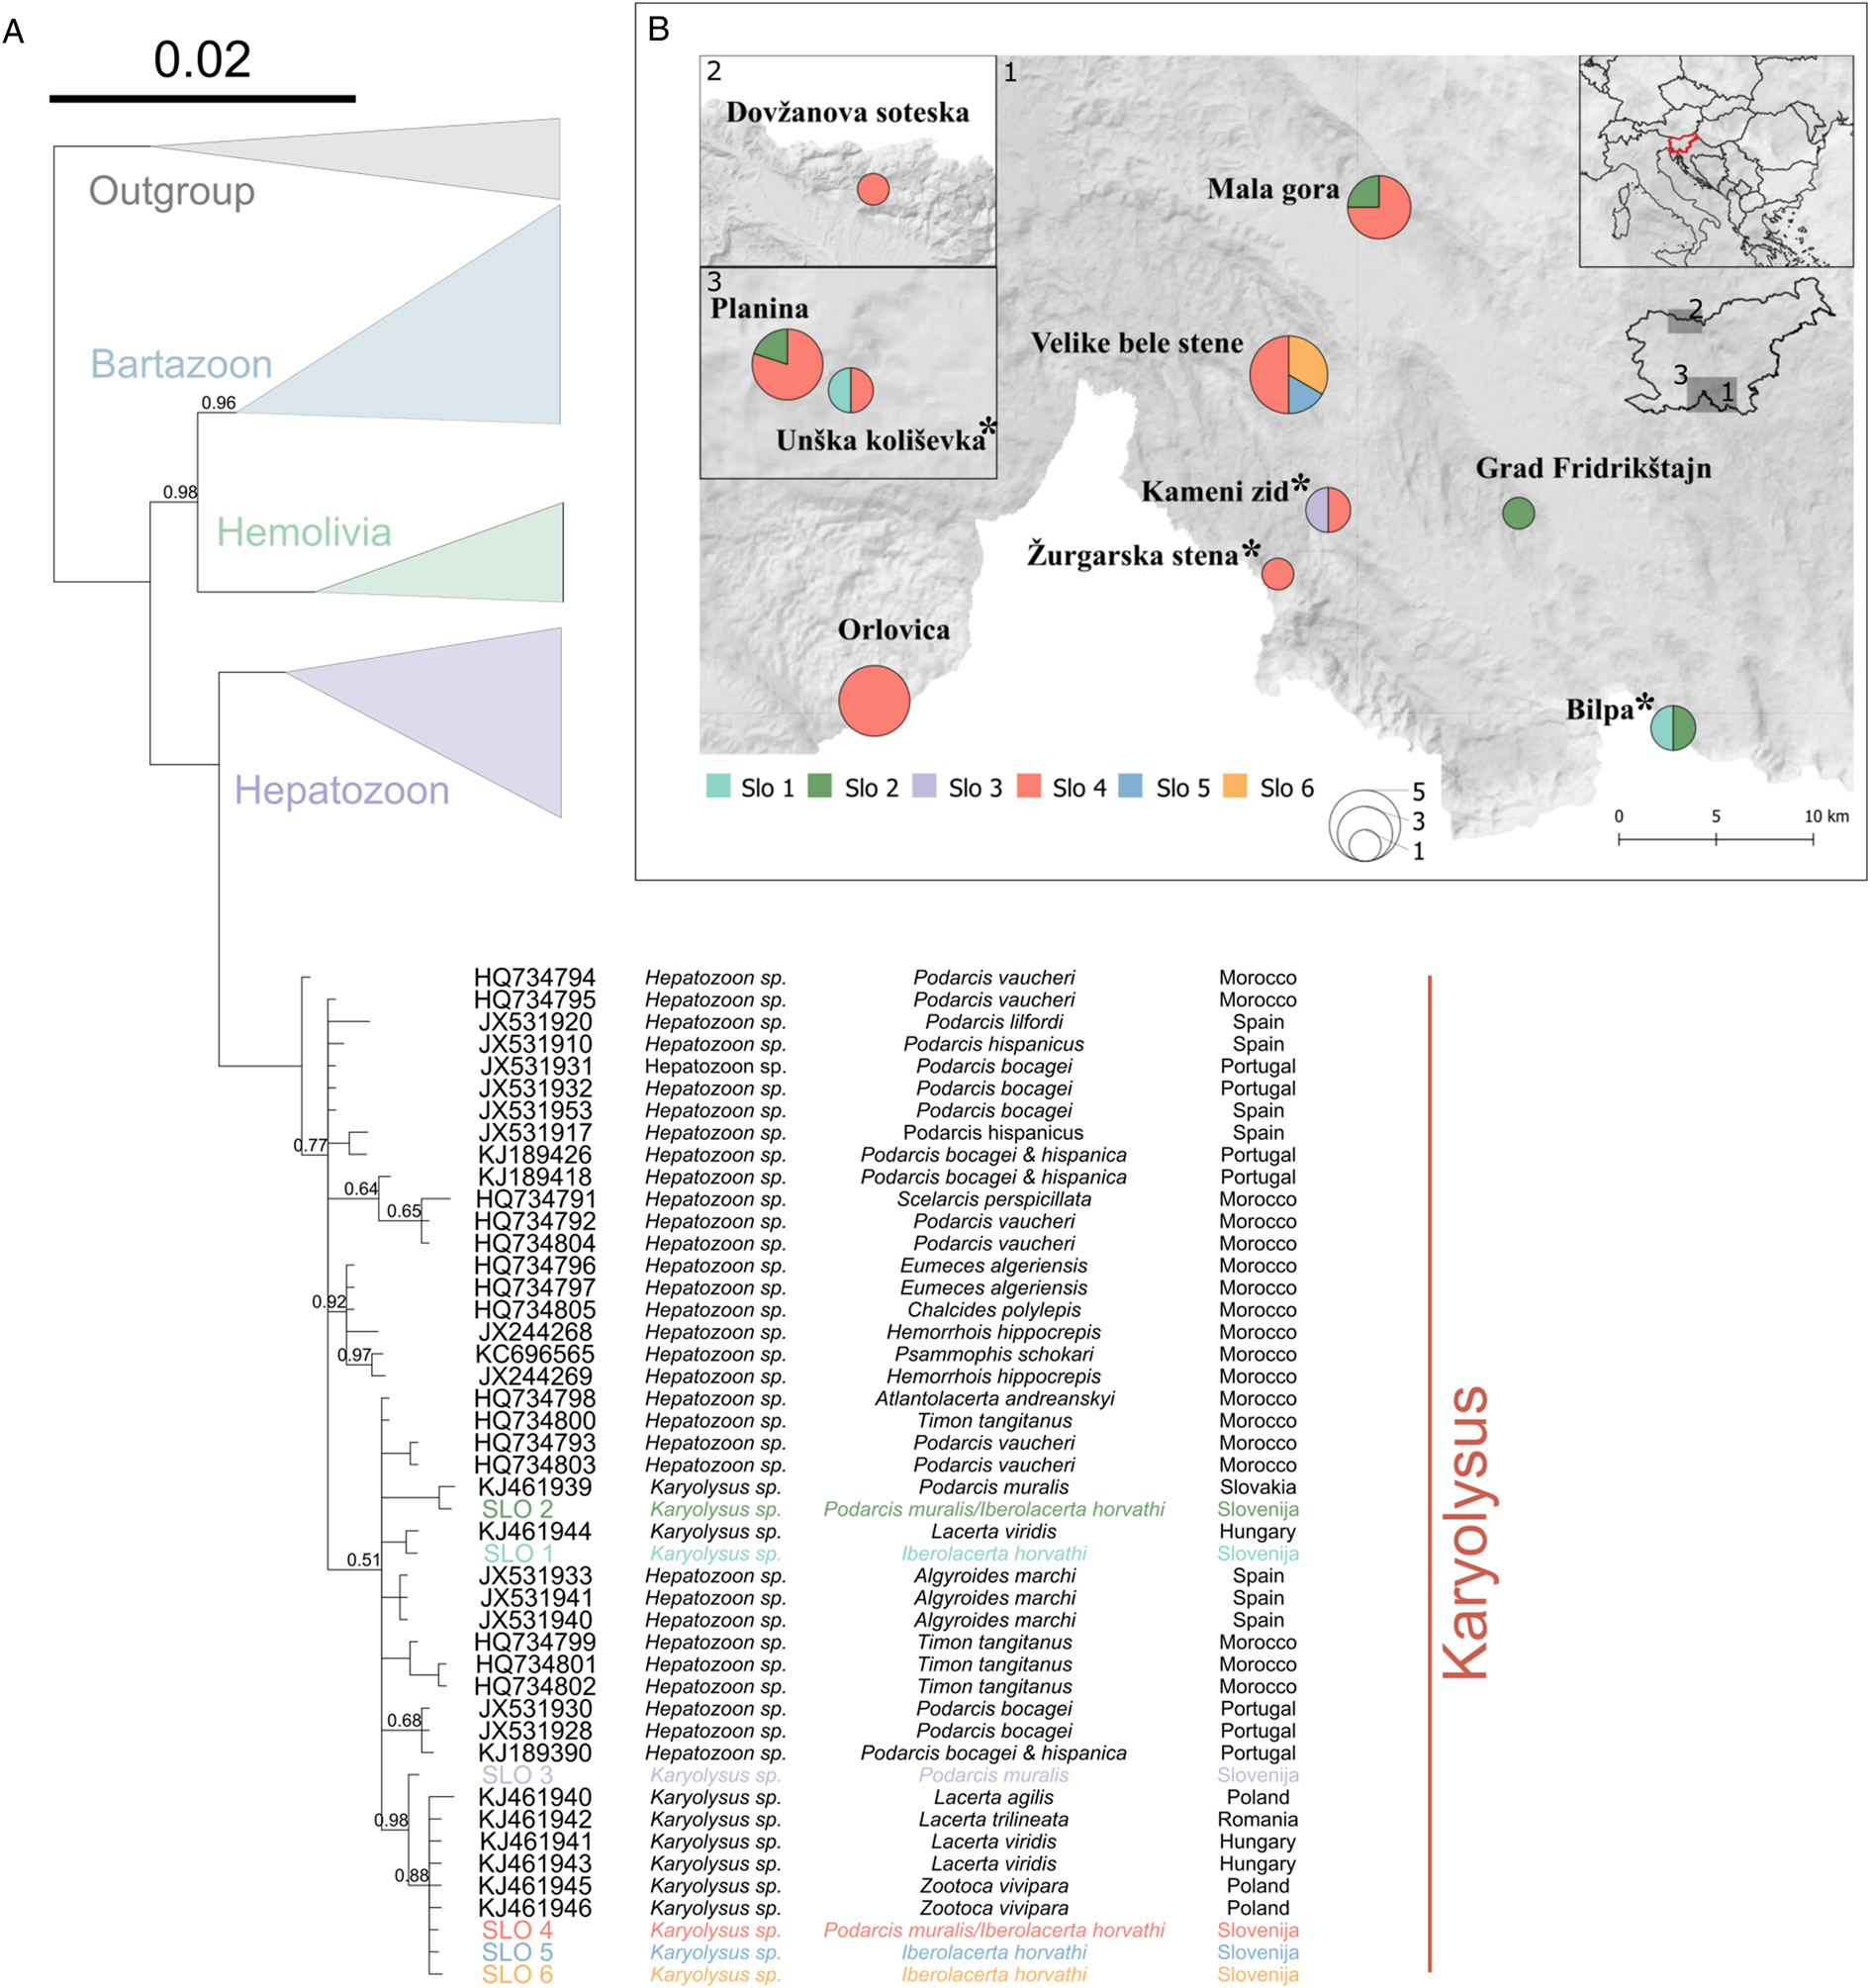
(A) Phylogenetic tree of the Karyolysus group. Order of information from left to right: accession number, parasite genus, host species and country of sample origin. New haplotypes from our samples are coloured by haplotype and shown on the map. Node support values are shown for main branches where Bayesian posterior probabilities <1. (B) Map of newly obtained haplotypes. *Marks syntopic locations.
Blood was collected from a short tail tip fragment and saved on Whatman paper (FTA® Classic Card, Cat. No. WB12 0205). Papers were labelled and saved in individual plastic bags. Tail tips were saved in Eppendorf tubes with 96% ethanol. A second drop of blood from the tail tips was used to prepare blood smears. Blood samples for genetic analysis of the parasites were collected from a total of 137 lizard hosts (61 P. muralis and 76 I. horvathi) from 10 locations, and blood smears for evaluating prevalence and intensity of parasites from eight of the locations (Supplementary Table 1).
Blood smear analysis
Dry blood smears were fixed in 100% methanol, air-dried and stained with Giemsa (Presnell et al., Reference Presnell, Schreibman and Humason1997) before observation under a Zeiss Axioscope microscope with an in-built camera (DFC290 HD, Leica). Samples with haemogregarine parasites detected during a first screening were considered positive. In these, five neighbouring microscope fields were photographed from non-overlapping spots of the microscope slide at 400× magnification using LAS 4.0 (Leica) software. Stitching of the adjacent fields of view provided five landscapes of blood cells per slide. Five hundred erythrocytes were screened by eye for the presence of haemogregarine parasites and count of infected cells in each landscape, totalling 2500 screened erythrocytes per blood smear.
Molecular methods and analysis
DNA was extracted from 137 samples collected in 2018 and 2019 and from 78 samples collected prior to 2018 by using a GenElute Mammalian Genomic DNA Miniprep (Sigma-Aldrich, St. Louis, Missouri, USA) commercial kit following the manufacturer instructions and the high salt method (Sambrook et al., Reference Sambrook, Fritsch and Maniatis1989), respectively. To molecularly confirm the presence of parasites, and later identify them, the set of primers HAM-F and HepR900 (Netherlands et al., Reference Netherlands, Cook, Du Preez, Vanhove, Brendonck and Smit2018) was used, targeting an approximately 940 bp long fragment of 18S rRNA gene. Polymerase chain reactions (PCRs) were performed according to Netherlands et al. (Reference Netherlands, Cook, Du Preez, Vanhove, Brendonck and Smit2018). The obtained PCR results were commercially cleaned and sequenced at Macrogen Europe with the same set of primers.
Sequences were reviewed in Geneious 4.8.5. (https://www.geneious.com) and blasted to the NCBI database to discard non-target amplifications and confirm the identity of the sequences obtained. In order to determine the phylogenetic position of these new sequences, the dataset used by Karadjian et al. (Reference Karadjian, Chavatte and Landau2015, references within) was reanalysed to reconstruct haemogregarine phylogenetic relationships including our new samples. The full sequence dataset was then aligned using MAFFT (Katoh et al., Reference Katoh, Misawa, Kuma and Miyata2002) and checked for the optimal evolutionary model with PartitionFinder2 (Lanfear et al., Reference Lanfear, Frandsen, Wright, Senfeld and Calcott2017). The optimal model, GTR + I + G, was selected using Bayesian information criterion (BIC). The phylogenetic tree was built using a Bayesian approach in MrBayes 3.2.2 (Huelsenbeck et al., Reference Huelsenbeck, Ronquist, Nielsen and Bollback2001; Ronquist and Huelsenbeck, Reference Ronquist and Huelsenbeck2003) using two runs of four chains each and 30 × 106 generations, with sampling frequency set at 1000 and a burnin of 25% of the full run. MrBayes results were checked with Tracer 1.7.1 (Rambaut et al., Reference Rambaut, Drummond, Xie, Baele and Suchard2018), the effective sample size was over 200. All software was ran on the public server CIPRES (Miller et al., Reference Miller, Pfeiffer and Schwartz2010), the tree was visualized using FigTree 1.4.3 (Rambaut et al., Reference Rambaut, Drummond, Xie, Baele and Suchard2018), annotated using R 4.0.0 (R Core Team, 2020) in RStudio 1.2.5033 and finished in Inkscape 1.0.2.
Statistical analysis of parasitization
To test for differences in parasite prevalence and intensity, generalized linear mixed models (GLMMs) were constructed. Before running the models, data were checked for seasonal variation due to the fact that sampling took place in several months. The results show no significant seasonal variation for prevalence (x 2 = 15.767, df = 12, P = 0.2021) or seasonal correlation for intensity (R = 0.043, P = 0.61). In the first step global models with a binomial error distribution and a logit link for prevalence and a negative binomial error distribution for intensity (we used raw intensity data – the number of cells infected) were fitted. The models contained the following fixed predictors: sex, species, syntopy and log(SVL), and locality as a random predictor. The model fits were checked using the DHARMa package (Hartig, Reference Hartig2020) which showed no deviation from the binomial and negative binomial distributions, respectively. To observe predictor effects, a multi-model inference approach (Dormann, et al., Reference Dormann, Calabrese, Guillera-Arroita, Matechou, Bahn, Barton, Beale, Ciuti, Elith and Gerstner2018) was used. The dredge function from the MuMIn package (Barton, Reference Barton(2020) was used to construct all possible models containing combinations of all main effects and first-order interactions between sex and species and species and syntopy. A list of models was obtained from which the best fitting models were selected based on the corrected Akaike information criterion (AIC). All models were ranked based on AIC and the ones that had a difference in AIC lower or equal to two from the best-fitting model were selected. A model averaging approach was used on the selected models using the model.avg function from the MuMIn package (Barton Reference Barton2020). The importance of each predictor in our final model-averaged results was also calculated. All statistical analyses were performed in R and RStudio (RStudio team, 2021).
Results
Parasite identity
Due to low amplification and sequencing success, only 26 sequences were obtained and used to identify six new haplotypes. The phylogenetics analyses performed indicated all the sequences nested within the genus Karyolysus (Fig. 1, see supp. material F1 for full tree). The most frequent among newly obtained haplotype, SLO 4, was present in eight locations and shared by both lizard host species. Karyolysus haplotype SLO 2 was also shared by both hosts species and present in four locations, while Karyolysus haplotype SLO 1 occurred only in I. horvathi hosts in two locations (Fig. 1). Haplotypes SLO3 (P. muralis), SLO 5 (I. horvathi) and SLO 6 (I. horvathi) were only detected in one location each and as such were unique for their respective locations and species (Fig. 1).
Parasite prevalence and intensity
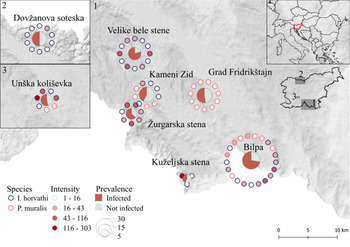
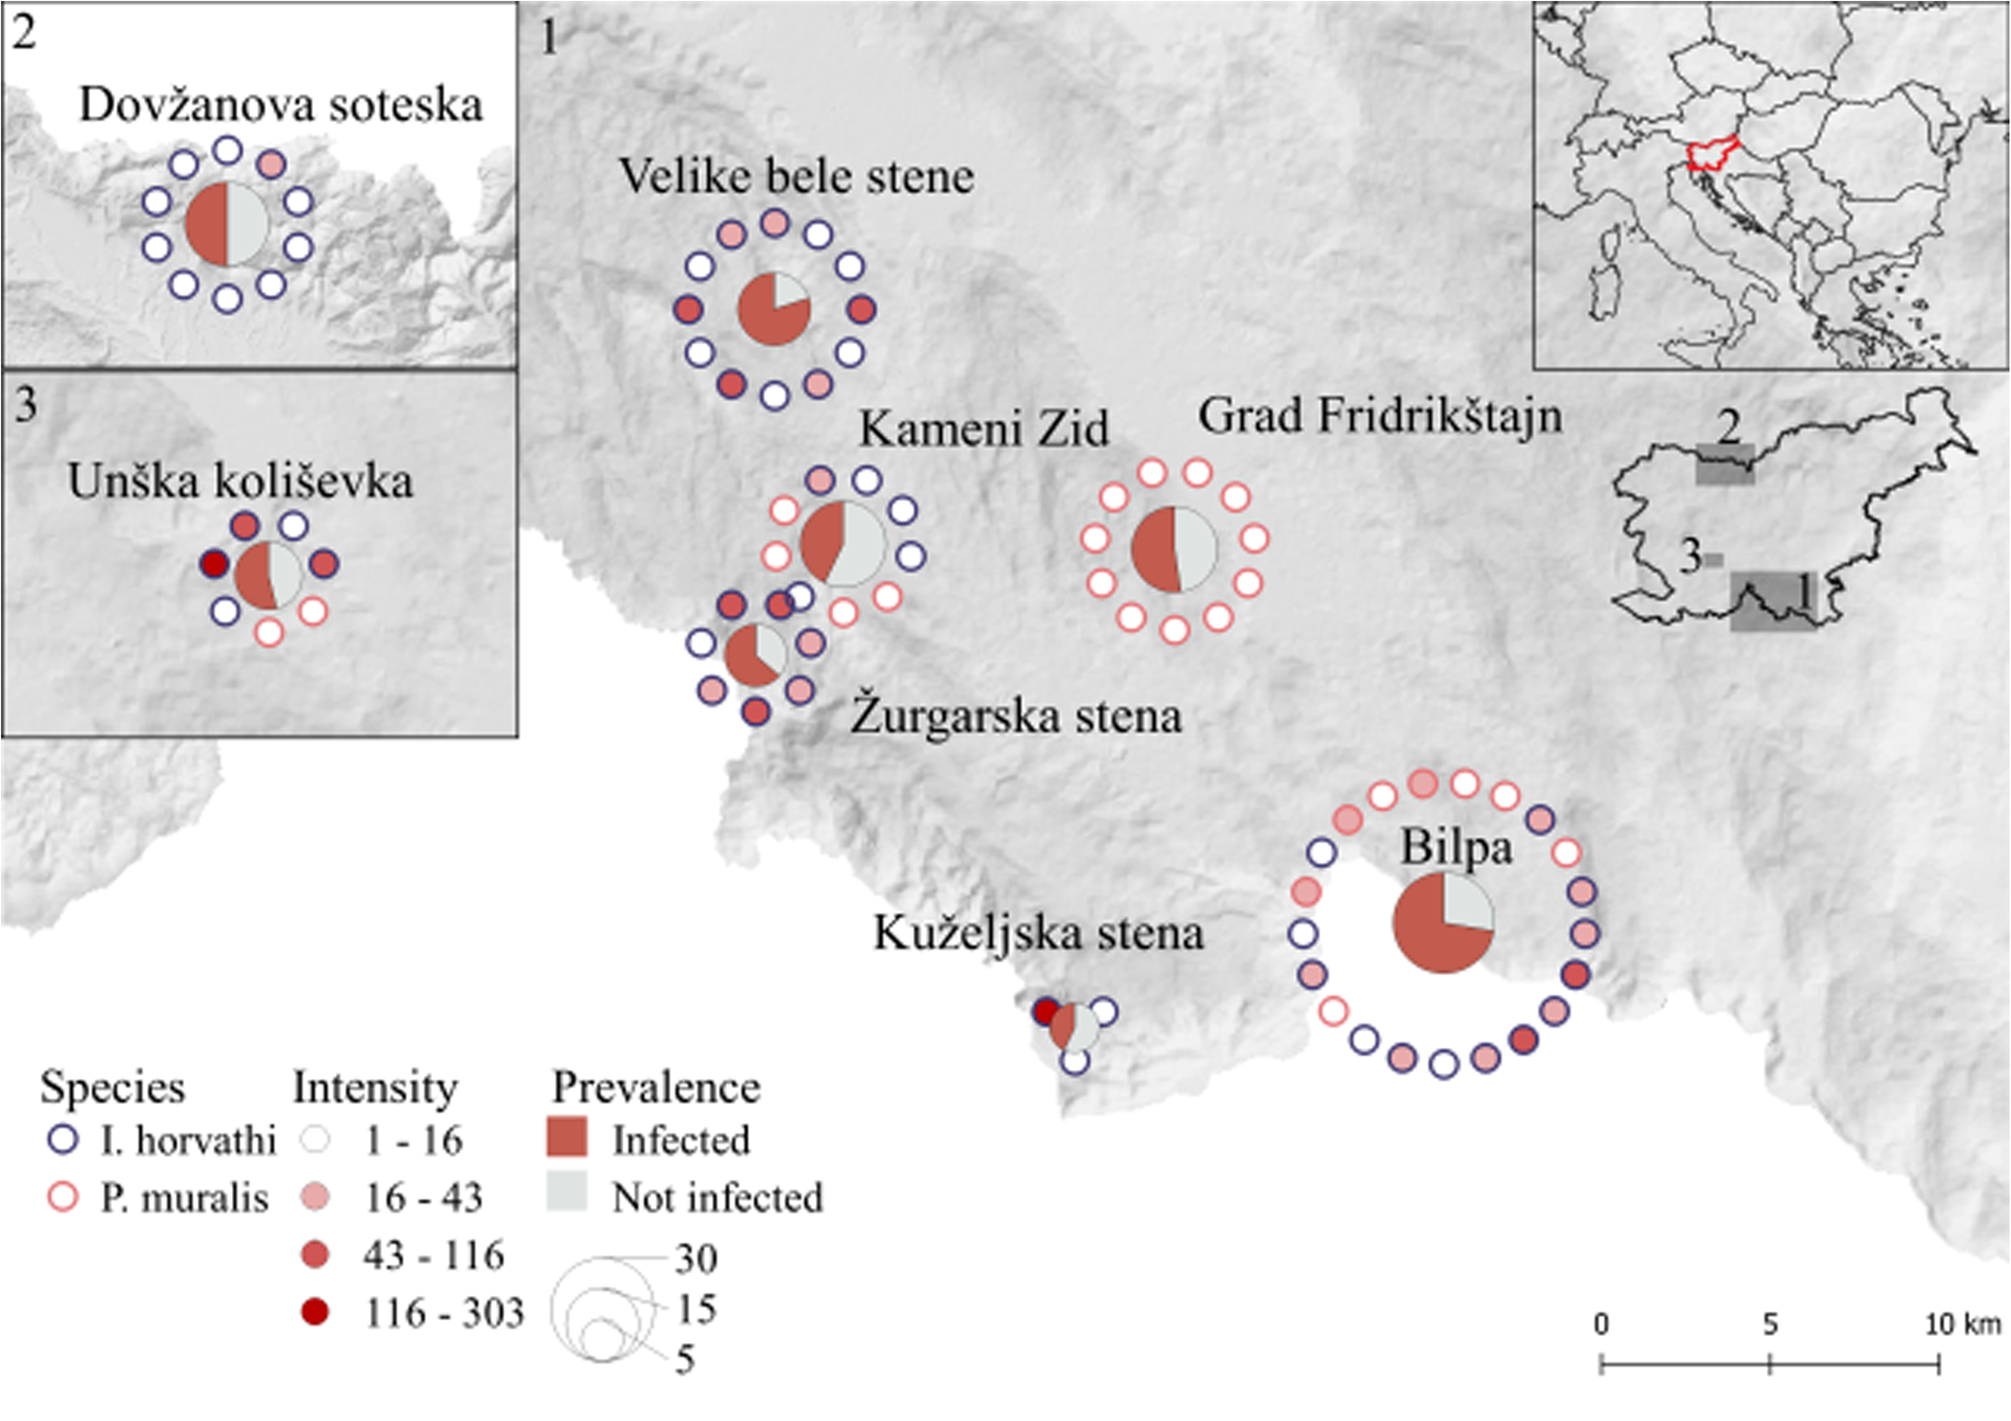
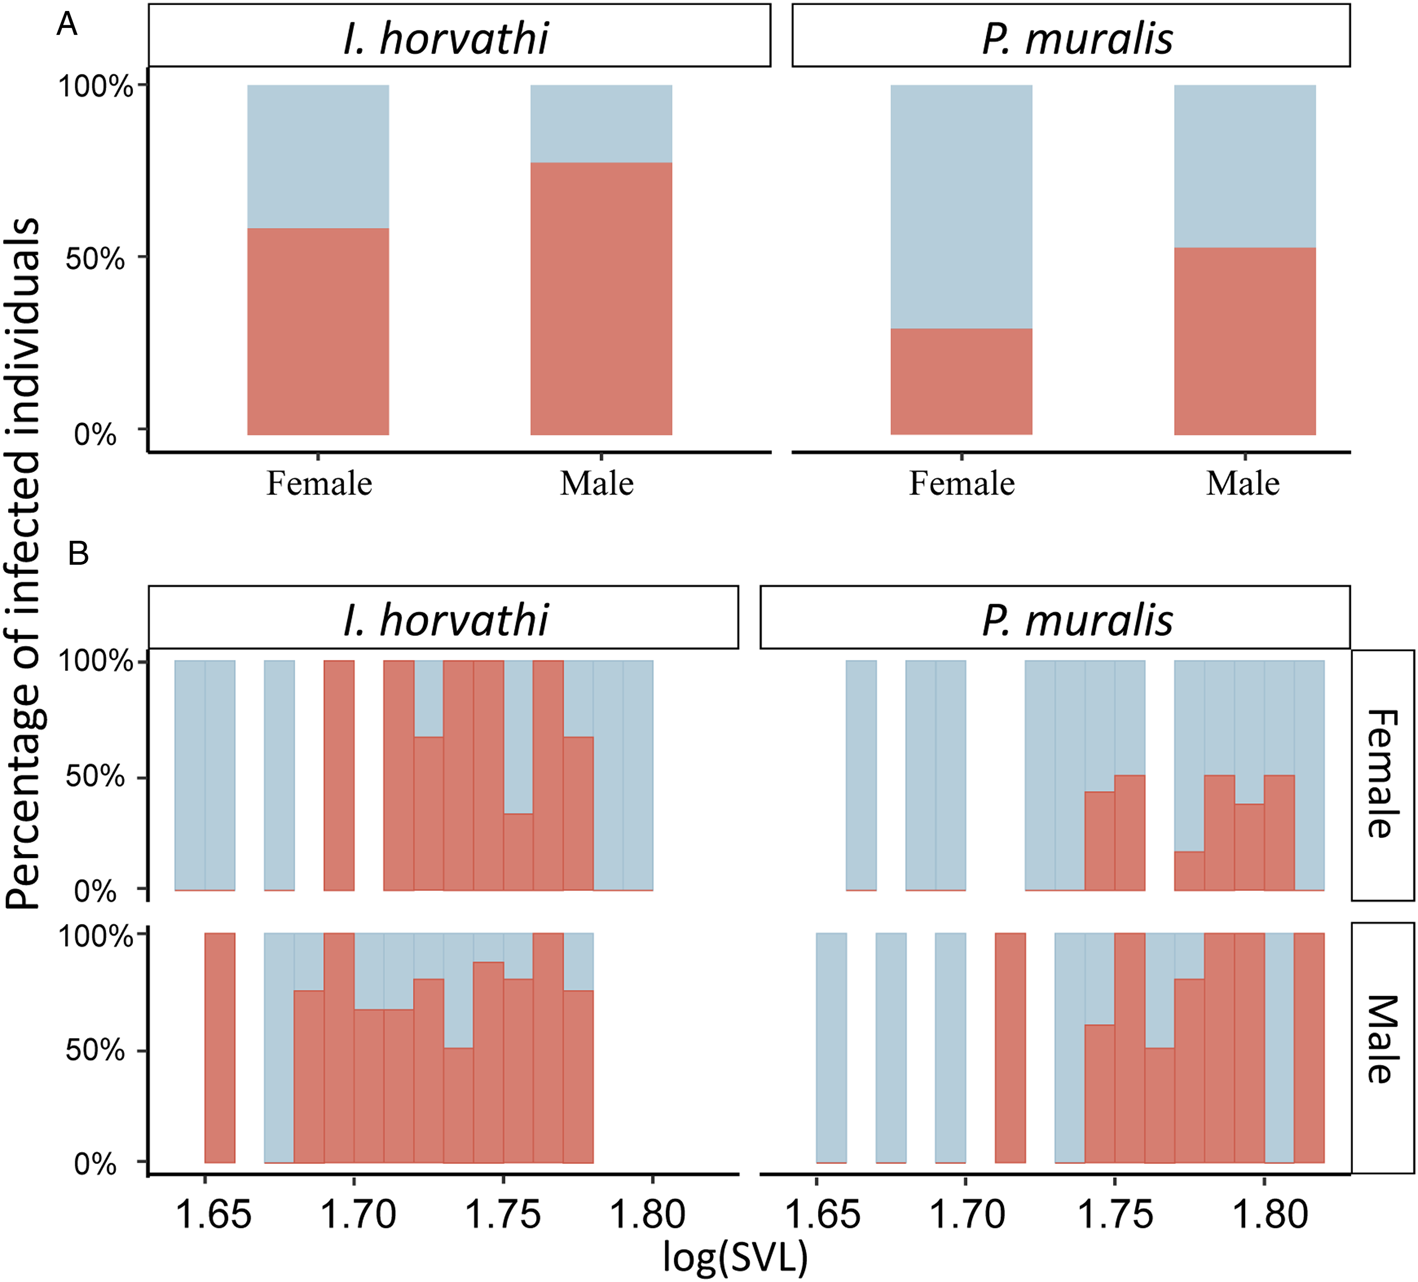
In total 137 (I. horvathi (N = 76) and P. muralis (N = 61)) blood smears were analysed, out of which 80 (58%) were infected with haemogregarines (I. horvathi 73% (Wilson interval = 62–81%) infected and P. muralis 41% (Wilson interval = 30–54%) infected) (Table 1, see Supplementary Table 1 for details). Parasite presence was confirmed in both species and in all studied locations (Fig. 2). The results of the multi-model inference of prevalence analysis resulted in two candidate models with ΔAIC ⩽ 2 (Table 2). The model-averaged results (Table 2) show a significant effect of species, with I. horvathi males (77.78%) and females (59.09%) being more commonly infected as opposed to P. muralis males (53.57%) and females (30.37%) (P value <0.01, Fig. 3A, Tables 1 and 2). A weaker but significant support for the effect of sex was also observed, males were more commonly infected than females (Table 1, Fig. 3A) (P value <0.05, Fig. 3A, Tables 1 and 2), and SVL, with no strong signal of larger animals being more infected than smaller ones (P value <0.05, Fig. S3, Table 2). In the case of intensity, three candidate models with ΔAIC ⩽ 2 were selected (Table 2). The model-averaged results (Table 2) showed a significant effect of species with both allotopic I. horvathi (Table 1) and syntopic I. horvathi (Table 1) having higher infection intensity than allotopic P. muralis (Table 1) and syntopic P. muralis (Table 1) (P value <0.001, Fig. 4, Table 2). The intensity was also higher in males than females (P value <0.001, Fig. 4, Table 2). Finally, individuals in syntopic locations showed higher parasite intensity compared to individuals from allotopic locations (P value = 0.034, Fig. 4), with a seemingly more pronounced difference in I. horvathi (Fig. 4). Based on SVL measurements, larger individuals of I. horvathi tended to be more intensely parasitized (P value <0.01, Fig. S2, Table 2).
Map of sampled locations with a prevalence of infection (pie charts; ratios of infected individuals) and level of parasite intensity (dots around the circle correspond to the individual sample).
Parasite prevalence expressed as the percentage of infected individuals for predictors included in the final models. (A) Prevalence by sex and species. (B) Prevalence by log10 transformed SVL values. Infected individuals marked in red.
Parasite intensity expressed as the logarithm of 1 + number of infected cells for predictors included in the final model by syntopy, species and sex. Outliers in grey.
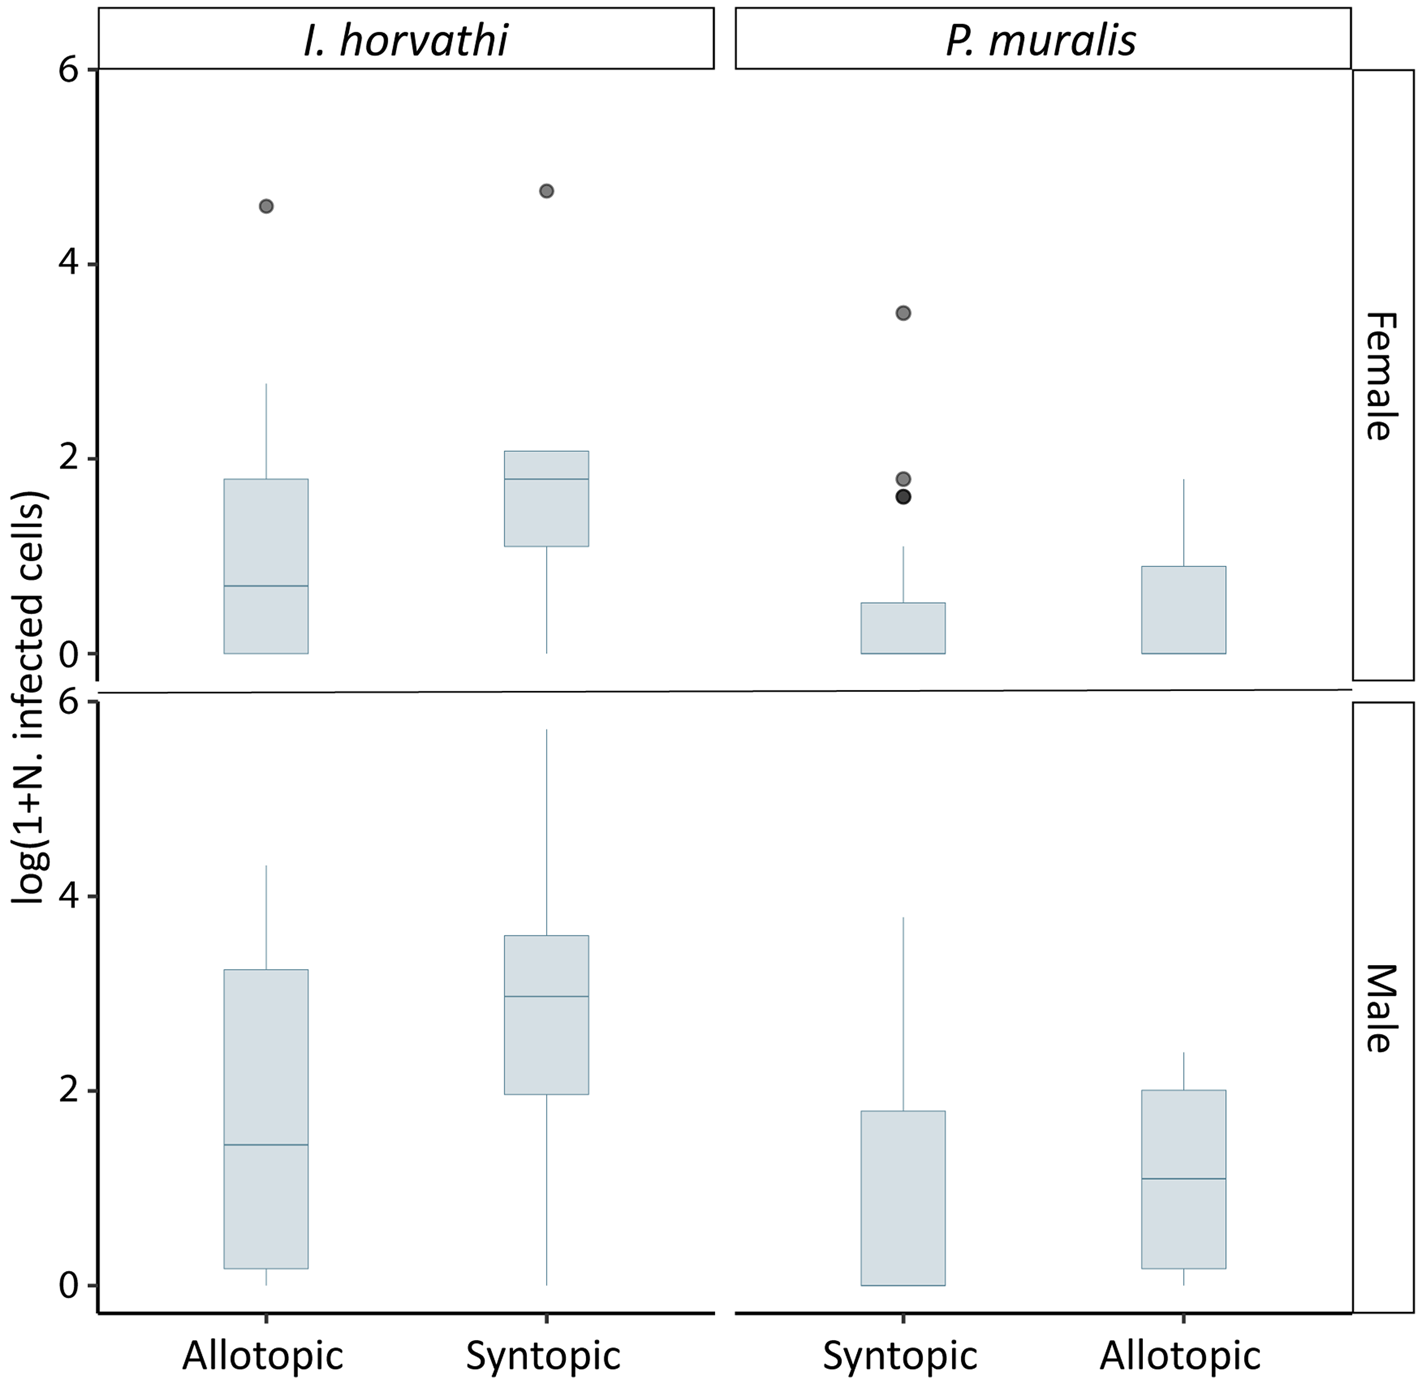
Table of descriptive statistics of prevalence and intensity of parasites for categorical predictors used in the final models.
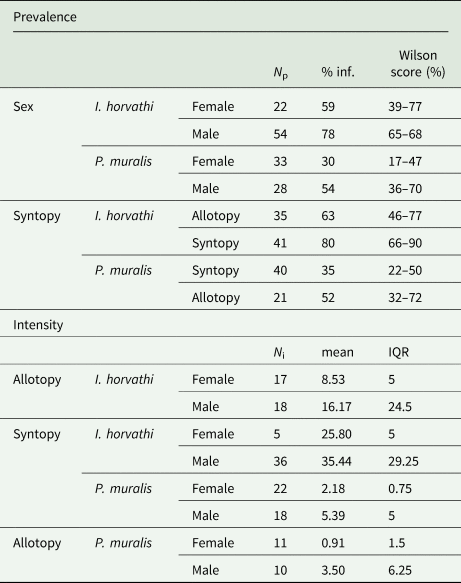
N p, number of individuals observed per group for prevalence; %inf, percentage of infected individuals; N i, number of individuals observed per group for intensity, mean – mean of infection intensity; Wilson score, Wilson score interval; IQR, Interquartile range.
Results of automatic multi model inference using model averaging from candidate models.
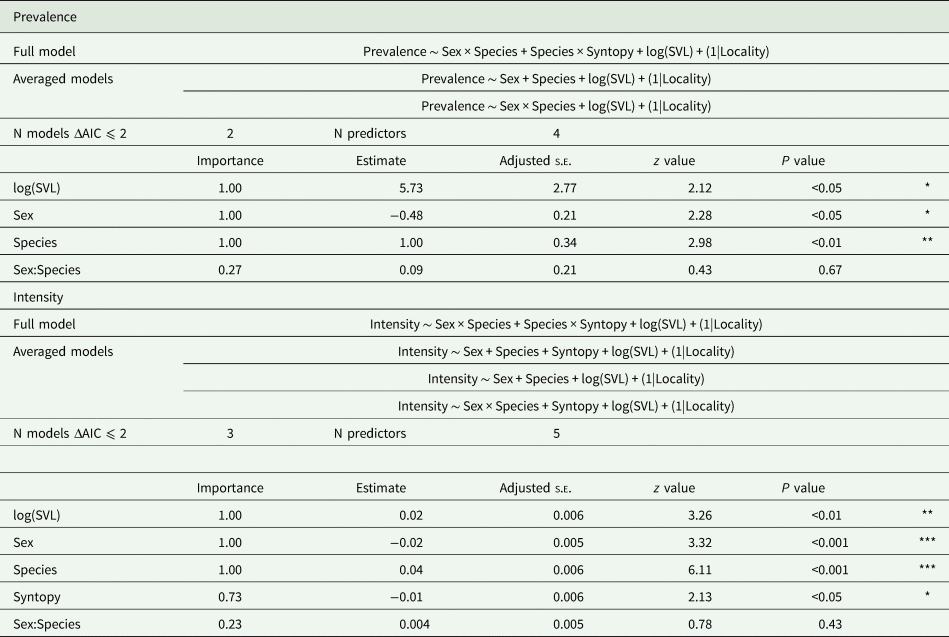
Column ‘Importance’ shows the average weights in the final models. Estimate show estimates after model averaging. Adjusted s.e. shows standard error after model averaging. z value corresponds to the Wald z statistic and P value to the P statistic. * marks ⩽0.05, ** marks ⩽0.01 and *** marks ⩽0.001.
Discussion
Results suggest that parasitization by haemogregarines is relevant in the dynamics of the competitive relationship between two lizard species, I. horvathi and P. muralis. Both lizard hosts share some haplotypes of the parasites detected, which also shows that the studied species of lizards play a role as intermediate hosts in the life cycle of Karyolysus which is not host-specific. This might be explained due to host specificity being potentially linked with the definitive host where parasites undergo sexual reproduction (e.g. Megía-Palma et al., Reference Megía-Palma, Martínez and Merino2018a, Reference Megía-Palma, Martínez, Cuervo, Belliure, Jiménez-Robles, Gomes and Merino2018b), whereas host sharing is higher among intermediate hosts. Differences found in parasite prevalence and intensity between host species and differences in parasite intensity between allotopic and syntopic populations in I. horvathi shed new light on the complex connections that exist between parasites and hosts in interaction. There are effects of different directions possible; effect of parasites on interspecific competition of hosts, as well as, effects of competition in hosts on parasites (Drechsler et al., Reference Drechsler, Belliure and Megía-Palma2021; Tomé et al., Reference Tomé, Harris, Perera and Damas-Moreira2021).
It was confirmed that blood parasites belong to the genus Karyolysus and are phylogenetically close to parasites found in lacertid hosts from Europe (e.g. Haklová-Kočíková et al., Reference Haklová-Kočíková, Hižňanová, Majláth, Račka, Harris, Földvári, Tryjanowski, Kokošová, Malčeková and Majláthová2014; Karadjian et al., Reference Karadjian, Chavatte and Landau2015; Maia et al., Reference Maia, Carranza and Harris2016). Specifically, all six newly obtained haplotypes cluster with haplotypes obtained from Slovakia, Hungary, Poland and Romania (Haklová-Kočíková et al., Reference Haklová-Kočíková, Hižňanová, Majláth, Račka, Harris, Földvári, Tryjanowski, Kokošová, Malčeková and Majláthová2014). The result is also congruent with a previously reported infection by Karyolysus in both lizard species from a neighbouring country, Austria, where the determination was based only on morphological identification (Hassl, Reference Hassl2012). Molecular analysis also revealed that Karyolysus is spread across the region with the most frequent haplotype (SLO 4) present in 80% of all localities. This and an additional haplotype (SLO 2) were also shared by the two lizard host species.
The transmission of Karyolysus parasites between lizard hosts occurs, most probably, via common definitive hosts such as mites (Barnard and Upton, Reference Barnard and Upton1994). Particularly, mites of the genus Ophionyssus were postulated as potential vectors of Karyolysus (Haklová-Kočíková et al., Reference Haklová-Kočíková, Hižňanová, Majláth, Račka, Harris, Földvári, Tryjanowski, Kokošová, Malčeková and Majláthová2014). Parasite transmission can be facilitated if intermediate hosts and vectors have similar ecological requirements (Puente et al., Reference Puente, Martinez, Rivero-de Aguilar, Herrero and Merino2011), which is the case here. Both lizards are ecologically similar to the point that they come into interspecific competition in co-occurring populations with limited resources (Žagar et al., Reference Žagar, Carretero, Osojnik, Sillero and Vrezec2015b), and both lizard species from the analysed populations are infected with mites (Megía-Palma, pers. observations). Since mites have low mobility, they are more likely to contribute to the transmission of blood parasites among lizards that live close to each other (Godfrey et al., Reference Godfrey, Bull, Murray and Gardner2006). While the studied species of lizards do not aggregate in social clusters, they may interact physically (Žagar et al., Reference Žagar, Carretero, Osojnik, Sillero and Vrezec2015b) and share refuge sites and hibernacula (Žagar, pers. observation), promoting mites’ transmission between lizard hosts. The fact that parasite sharing was observed in different populations across a relatively large geographical range, suggests that parasite sharing is historical, since the two species have been living together during the Pleistocene (Salvi et al., Reference Salvi, Harris, Kaliontzopoulou, Carretero and Pinho2013; Garcia-Porta et al., Reference Garcia-Porta, Irisarri, Kirchner, Rodríguez, Kirchhof, Brown, MacLeod, Turner, Ahmadzadeh and Albaladejo2019). To fully understand the observed pattern of blood parasites in this system, further investigations targeting vectors and transmission routes are needed, as well as an additional exploration of the phylogenies of both hosts and parasites.
Furthermore, differences in prevalence and intensity of parasites between lizard species were detected. When the two species were in syntopy, the less dominant species, I. horvathi, was more commonly parasitized and had a higher intensity of blood parasites than the more dominant one. Karyolysus replicates via asexual reproduction inside infected lizards, which can rapidly increase parasitaemia in response to environmental stress without the need for reinfection from vectors (Oppliger et al., Reference Oppliger, Clobert, Lecomte, Lorenzon, Boudjemadi and John-Alder1998). Thus, under syntopy, there could be an effect of competition on parasite levels via stress due to interspecific competition including increased energy allocation budgets (e.g. higher frequency of agonistic interactions, Žagar et al., Reference Žagar, Carretero, Osojnik, Sillero and Vrezec2015b) explaining the higher levels in a less dominant competitor species, I. horvathi. To have a clearer answer about parasites’ role in the competition, parasitaemia was compared across populations. Parasite prevalence was similar across populations and did not change between allotopic and syntopic populations. Prevalence is connected with the opportunity of lizards to become infected, thus, results suggest that lizards’ chances to become infected were not increased with the presence of another species. However, other factors connected with the transmission of parasites likely also contribute to sharing and similar prevalence across populations. On the other hand, lizards in syntopic localities attained higher parasite intensities that could likely be due to subtle differences in microhabitat use (Žagar, Reference Žagar2016) and point towards a coupling of the presence of competing species and parasite intensity. For now, results showed only an increase of parasite intensity in the competitively weaker species, I. horvathi in syntopy. Common garden experiments might be used in future to further understand the connection between parasites and hosts in competition.
Although initially no difference in host susceptibility to parasites was assumed, some studies show that generalist species have lower parasite infections compared to specialist species (Barthel et al., Reference Barthel, Kopka, Vogel, Zipfel, Heckel and Groot2014; Pulgarìn et al., Reference Pulgarìn-R, Gómez, Robinson, Ricklefs and Cadena2018). Thus, the observed interspecific differences may also arise from the distinct ecological and physiological characteristics of the two species. I. horvathi has a restricted distribution and habitat use with specialized ecophysiological and behavioural traits, while P. muralis is a generalist species with a wide-range distribution, habitat use and ecophysiology and behaviour. Interspecific differences in microhabitat use might influence the exposure to parasite vectors. In particular, I. horvathi tends to move across bare rocks with scarce vegetation while P. muralis is often moving in vegetation where the exposure to vectors may be greater (Wu et al., Reference Wu, Richard, Rutschmann, Miles and Clobert2019). Accordingly, expect higher prevalence would be expected in P. muralis, which is contrary to the presented findings. Moreover, differences in parasite intensity are governed by different factors, among them by the susceptibility and potential to fight of the parasites (immune competence) of the host (Oppliger et al., Reference Oppliger, Clobert, Lecomte, Lorenzon, Boudjemadi and John-Alder1998) and immune competency to fight off infections requires energy allocation (Barrientos and Megía-Palma, Reference Barrientos and Megía-Palma2021). It is known that the two species differ in their metabolic potential activity (Žagar et al., Reference Žagar, Simčič, Carretero and Vrezec2015c), which is an estimation of enzymatic capacity for metabolism (Toth et al., Reference Toth, Szabo and Webb1995). I. horvathi exhibits a higher metabolic potential activity under the same body temperature as P. muralis, which may have evolved to cope with shorter activity seasons under climatically more restricted habitats in higher altitudes (Žagar et al., Reference Žagar, Simčič, Carretero and Vrezec2015c). Having higher metabolic activity, I. horvathi has higher energy-related budged directly related to higher metabolic rates. This higher energy cost of metabolism may pose an energetic constraint to keep Karyolysus under immune control (Rutschmann et al., Reference Rutschmann, Dupoué, Miles, Megía-Palma, Lauden, Richard, Badiane, Rozen-Rechels, Brevet, Blaimont, Meylan, Clobert and Le Galliard2021).
Sex was also an important predictor of parasite prevalence and intensity. Males of both species tended to be more commonly and heavily parasitized. These results were similar to some other findings in lizards (e.g. Álvarez-Ruiz et al., Reference Álvarez-Ruiz, Megía-Palma, Reguera, Ruiz, Zamora-Camacho, Figuerola and Moreno-Rueda2018; Arakelyan et al., Reference Arakelyan, Harutyunyan, Aghayan and Carretero2019) and could be due to behavioural differences between sexes, with males exhibiting riskier behaviour, thus encountering more parasite vectors and infected conspecifics (Zuk and McKean, Reference Zuk and McKean1996; Barrientos and Megía-Palma, Reference Barrientos and Megía-Palma2021). Besides that, male lacertids have larger home ranges, which will make them more exposed to parasite vectors (Wieczorek et al., Reference Wieczorek, Rektor, Najbar and Morelli2020; Sillero et al., Reference Sillero, Dos Santos, Teodoro and Carretero2021). Males also have higher energetic costs due to preforming territory-defence behaviour, which may cause less available energy resources for the defence against parasites (Veiga et al., Reference Veiga, Salvador, Merino and Puerta1998). Moreover, testosterone is considered as an immune suppressor (Salvador et al., Reference Salvador, Veiga, Martin, Lopez, Abelenda and Puertac1996; Belliure et al., Reference Belliure, Smith and Sorci2004), although its influence on the susceptibility to blood parasites remains puzzling in lizards (reviewed in Roberts et al., Reference Roberts, Buchanan and Evans2004, but also see Veiga et al., Reference Veiga, Salvador, Merino and Puerta1998).
In conclusion, this study confirmed the presence of parasites of the genus Karyolysus in I. horvathi and P. muralis while also demonstrating that both lizard species shared particular haplotypes of Karyolysus. The higher prevalence in I. horvathi suggested a higher susceptibility to the infection of this endemic host lizard species. Importantly, intensity (but not prevalence) was higher in I. horvathi in locations syntopic with P. muralis, suggesting a potential coupling between competition and parasitaemia. These findings open a new research avenue on the linkage between blood parasites and ecological interactions in lizards. In the future, the focus should be on investigating vectors and transmission routes, the immune response of the different host species and phylogenies of both hosts and parasites, to fully understand the observed pattern of blood parasites in host−parasite systems.
Supplementary material
The supplementary material for this article can be found at https://doi.org/10.1017/S0031182021001645
Data
All new sequences are availible at GenBank under accession numbers OK348281-OK348286. Data supporting the findings of this study are also available within the article and its Supplementary Materials or per request from the authors.
Acknowledgements
We are grateful to all the friends and colleagues who helped us in the field during the collection campaigns and laboratory preparation of samples: Emiliya Vacheva, Tajda Gredar and Senda Regueira.
Author contributions
UD, RMP and AZ contributed to tissue collection. UD, AP and RK contributed to the molecular and laboratory analyses of samples. UD, RMP, AP, MAC and AZ contributed to the data analyses. UD, RK, MAC, AP and AZ conceived and designed the study. UD and AZ wrote the manuscript and all authors contributed to the writing and revision of the manuscript.
Financial support
AŽ was supported by the Slovenian Research Agency (ARRS, Programme P1-0255) and grant J1-2466, as well as by the project 28014 02/SAICT/2017 granted by Fundaçao para a Ciencia e a Tecnologia (Portugal). RMP has a postdoctoral contract (CEECIND/04084/2017) by ICETA – Instituto de Ciências, Tecnologias e Agroambiente da Universidade do Porto and Fundação da Ciência e Tecnologia. AP was supported by FCT through the IF contract IF/01257/2012 and a contract associated to the project PTDC/BIA-EVL/28090/2017. MAC is supported by the project PTDC/BIA-CBI/28014/2017 funded by FCT.
Conflict of interest
The authors declare no competing interests and we confirm that we all abide by the ethical guidelines of the journal.
Ethical standards
All fieldwork was carried out with accordance to the permit issued by the Slovene environmental agency (ARSO), permit number 35601-11/2019-4.