I. INTRODUCTION
Titanium alloys, particularly Ti–6Al–4V, are widely found in the aerospace, chemical engineering, and biomedical industries.Reference Czyrska-Filemonowicz, Buffat and Wierzchon1–Reference Rie, Stucky, Silva, Leitão, Bordji, Jouzeau and Mainard3 However, their application is hindered by their relatively low hardness and wear resistance, as well as low corrosion resistance in some reducing acids and halide solutions, such as concentrated HCl.Reference Galvanetto, Galliano, Fossati and Borgioli4, Reference Zhecheva, Sha, Malinov and Long5 Since both wear and corrosion behaviors of an alloy are controlled by the microstructure and composition of the near-surface region, the application of hard transition metal nitride (MeN) films on titanium alloys has been shown to be an economical and effective way to improve their surface properties. Among various MeN films, TiN film remains the most commonly applied type to enhance the wear and corrosion resistance of these alloys.Reference Yao, Su, Kao and Cheng6 However, more evidence has shown that CrN films have advantages over TiN films due to their good oxidation resistance, which is desirable for high-temperature applications, e.g., pressure die casting moulds and cold forming of copper and titanium.Reference NavinŠek, Panjan and MiloŠev7 Chiba et al.Reference Chiba, Omura and Ichimura8 reported that although both films have similar hardness, CrN films possess superior wear resistance as compared to TiN films under dry wear conditions, resulting from their intrinsic properties, such as lower friction coefficient and higher toughness. Also, compared to TiN films, CrN films usually possess a low compressive stress, which is desirable for deposition of thicker films.Reference Fu, Loh, Batchelor, Zhu, Xu and He9, Reference Barshilia, Deepthi and Rajam10
The principal disadvantage of CrN is its relatively low hardness (i.e., 12–18 GPa), which is unfavorable for abrasive wear resistance.Reference Martinez, Sanjinés, Banakh and Lévy11–Reference Benkahoul, Robin, Martinu and Klemberg-Sapieha13 Recently, the addition of other elements, such as silicon (Si) in MeN systems has been actively explored.Reference Shah, Jayaganthan and Kaur14, Reference Guo, Lee and Chen15 One of those ternary film systems, Cr–Si–N, has shown promising mechanical properties such as high microhardness and good wear resistance due to its nanocomposite microstructure comprising nanocrystalline CrN and amorphous silicon nitride.Reference Kim, Kang, Kim, Kim, Shin and Je16–Reference Lee, Jung, Han, Seo, Kim and Bae18 Shin et al.Reference Shin, Kim, Kang, Kim, Kwon and Kim19 studied the variation of hardness of the Cr–Si–N films as a function of Si content. The results showed that the hardness of the resultant Cr–Si–N films was noted to increase to 34 GPa when the Si content reached 9.3 at.%, and then rapidly decreased with a further increase in Si content. The similar phenomenon had also been reported by Mercs et al.Reference Mercs, Bonasso, Naamane, Bordes and Coddet20 The influence of Si content on wear properties of Cr–Si–N films at ambient temperature and relative humidity (25–30% RH) condition was investigated by Park et al.Reference Park, Chung, Cho and Kim21 The results indicated that the average friction coefficient of Cr–Si–N films gradually decreased with an increase of Si content in the CrN films due to the fact that the formation of a self-lubricant SiOx tribolayer caused by tribochemical reaction between Si and ambient humidity. Yoo et al.Reference Yoo, Hong, Kim, Lee and Han22 verified that the corrosion resistance of CrN film was improved by incorporation of Si, which was attributed to the phase transformation of Cr2N (111) into the fine and dense CrN (200) microstructure as the Si concentration increased.
As is well known, a widespread application of thin, hard films on the soft substrates is extremely limited because low hardness and flow strength of the substrate are unsuitable to support the film without plastic deformation when subjected to a high-intensity loading.Reference Heras, Egidi, Corengia, Gonzales-Santamaria, Garcia-Luis, Brizuela, Lopez and Flores Martinez23 To overcome this limitation, the duplex surface treatment involving a combination of two or more surface modification methods is commonly used. In such a duplex treatment, an intermediate layer formed on the substrate surface is produced generally prior to the deposition of a hard surface film. Several studies applying various duplex surface treatments show that the presence of an intermediate layer was beneficial not only to the improvements the load carrying capacity of the coating-substrate system but also to the enhancement in the wear resistance and corrosion resistance.Reference Yetim, Celik and Alsaran24–Reference La Vecchia and Lecis26
Although there are many prior studies on the mechanical and tribological properties of Cr–Si–N films, to date, little effort has been devoted to the corrosion behavior of Cr–Si–N films. In our previous works,Reference Xu27, Reference Xu, Sun and Jiang28 a nanocrystalline Cr3Si film with a grain size of <5 nm was successfully synthesized using the double glow sputtering technique to improve the mechanical properties and oxidation resistance of a titanium alloy. In the present work, the nanocomposite Cr–Si–N film was deposited on to a Ti–6Al–4V substrate by a novel duplex surface treatment, consisting of a Cr3Si intermediate layer deposited by double cathode glow plasma and subsequent plasma nitriding. The mechanical properties, adhesion strength, and wear and corrosion behaviors of the duplex treatment nanocomposite Cr–Si–N film were investigated.
II. EXPERIMENTAL METHOD
A. Sample preparation
The substrate material was Ti–6Al–4V with a diameter of 40 mm and a thickness of 3 mm. The nominal composition in wt% was: Al, 6.04%; V, 4.03%; Fe, 0.3%; C, 0.1%; H, 0.015%; N, 0.05%; O, 0.15%; and the balance, Ti. Before deposition, the Ti–6Al–4V substrates were polished using silicon carbide abrasive paper of 2400 grit and then cleaned in pure alcohol using an ultrasonic cleaner. A duplex surface treatment was carried out, involving the predeposition Cr3Si interlayer followed by plasma nitriding in a double cathode glow discharge apparatus described in a previous article.Reference Xu, Xu, Tao, Liu, Chen and Zhu29 In the pretreatment process of sputter deposition of the Cr3Si layer, the glow-discharge sputtering conditions were: base pressure, 4 × 10⁻⁴ Pa; target electron bias voltage, −900 V; substrate bias voltage, −350 V; working pressure of pure Ar, 35 Pa; parallel distance between the source electron and the substrate, 15 mm; and treatment time, 3 h. The Cr–Si alloys with a Cr:Si molar ratio of 3:2 was used as the target material. Plasma nitriding was performed in a mixture of Ar and N2 atmosphere with different ratios of Ar/N2 at a pressure of 35 Pa. The nitriding process was run at 700 and 800 °C by adjusting direct current bias voltage, and the nitriding time was set as 2 h.
B. Surface and subsurface characterization
The crystalline structure, grain size, and preferential orientation of the films were determined by x-ray diffraction (XRD) (D8ADVANCE, BRUKER AXS GMBH Company, Karlsruhe, Germany) with CuKα radiation. The degree of preferred orientation of the Cr–Si–N films was defined by the texture coefficient, Thkl, expressed asReference Jones, McColl and Gran30:

where I m(hkl) is the measured relative intensity of the reflection from the (hkl) plane of the film, I 0(hkl) is the relative intensity from the same plane in a standard reference sample, and n is the total number of reflection peaks from the film. The value of the texture coefficient for the peak under investigation may range from unity for a sample with randomly oriented grains to n for a sample having a complete preferential orientation. The surface and cross-section features of the samples were observed using scanning electron microscopy (SEM, Quanta200, FEI Company, Hillsboro, OR) equipped with energy dispersive x-ray spectroscopy (EDXS). The microstructure of the surface layer was examined by transmission electron microscope (TEM, Tecnai G220, FEI Company) at an accelerating voltage of 200 kV. Thin foils samples for TEM observation were cut from as-deposited film and were prepared by single jet electropolishing from the untreated side of the substrate.
C. Mechanical testing of the films
The hardness and the Young’s modulus of the as-deposited films were obtained by the nanoindentation tester (MTS Corporation, Knoxville, TN) equipped with a Berkovich tip. This system, developed by CSEM Instruments, comprises two distinct components: a measuring head for performing nanoindentation and an optical microscope for selecting a specific sample site prior to indentation and for checking the location of the imprint after indentation. The system has the load and displacement resolutions of 10 mN and 1 nm, respectively. Fused silica was used as a standard sample for the initial tip calibration. The indentation was worked by driving the indenter at a constant loading rate of 40 mN/min into the materials with the maximum applied load of 20 mN. The standard analysis procedure proposed by Oliver and PharrReference Oliver and Pharr31 was used to determine the hardness of the specimens from the unloading curve. For each indentation displacement, nanoindentation tests were conducted at five different locations to ensure repeatability of the experimental data. Adhesion strength of the films on Ti–6Al–4V alloys was evaluated by a scratch tester (WS-97) equipped with an acoustic emission (AE) detector. During scratch testing, a 200 μm radius Rockwell C diamond stylus was drawn across the coated surfaces at a loading rate of 20 Nmin−1. The AE sensor was attached onto the diamond stylus to detect the acoustic signals emitted due to the film fracture. Critical scratch loads (L c), at which the film damage was initiated, were thus derived.
D. Wear tests
Dry wear tests were performed using a HT-500 tribometer with a ball-on-disk configuration at room temperature. The specimens were tested against a GCr15 steel ball of 4 mm in diameter (nominal hardness 65 HRC). The tests were carried out at the normal load of 2.8 and 4.3 N, and the sliding speed of the ball was 0.22 m/s. The total sliding distance for the tests was 792 m. The profile of the wear tracks on the specimens was measured by a profilometer (MicroXAM, ADE phase-shift, Tuscon, AZ) to determine the worn volume. The specific wear rate of the films, W, was calculated:

where V is the volume of worn material, F is normal load, and S is the sliding distance.
E. Corrosion tests
Before corrosion tests, the specimens were coated with epoxy resin, having an exposed surface area of 1 cm2. A CHI660D electrochemical analyzer (Shanghai Chenhua Company, Shanghai, China) was used to evaluate the corrosion performance in a three-electrode cell including a platinum counter electrode and a saturated calomel reference electrode. The electrolyte used was 5 wt% HCl solution open to air. Potentiodynamic anodic polarization curves were measured at room temperature with a sweep rate of 0.5 mV·S−1, when the open circuit potential (OCP) reached a steady state after immersing the specimens in the electrolyte for about 10 min. An electrochemical impedance spectroscopy (EIS) analysis was performed at OCPs, with a sinusoidal voltage of ±5 mV applied over the frequency in a range between 100 kHz and 0.01 Hz. The experimental results were interpreted on the basis of an equivalent circuit.
III. RESULTS AND DISCUSSION
A. Microstructure and phase analysis
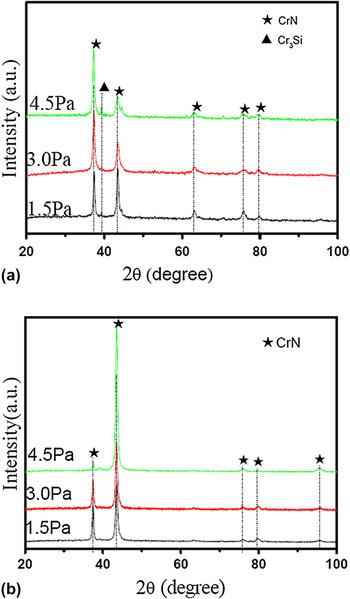
XRD patterns of the Cr–Si–N films synthesized at different nitrogen partial pressures and nitriding temperatures are given in Fig. 1. For the films produced at the nitriding temperature of 700 °C [Fig. 1(a)], the diffraction patterns are characterized by two sets of x-ray reflections, namely a weaker set for the Cr3Si phase and a stronger set corresponding to the B1-NaCl crystal structured CrN phase (JCPDS Card No. 11-0065). As the nitrogen partial pressure increases from 1.5 to 4.5 Pa, the intensity of CrN (200) peak decreases and the intensity of CrN (111) peak increases. In comparison, for the films made at the nitriding temperature of 800 °C [Fig. 1(b)], only the peaks corresponding to CrN phase are observed, and the CrN (111) reflection is weakened and the CrN (200) reflection is intensified with increasing nitrogen partial pressure. Notably, neither SiNx diffraction peaks nor chromium silicide peaks are detected in the XRD patterns, which suggest that Si may exist either in an amorphous form or as solute atoms in the CrN lattice.
X-ray diffraction patterns of the as-deposited Cr–Si–N films obtained at nitriding temperature of (a) 700 °C and (b) 800 °C with different nitrogen partial pressures.

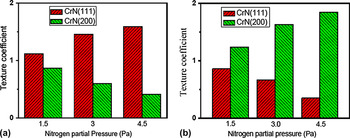
The calculated texture coefficients of the Cr–Si–N films as a function of preparation conditions are summarized in Fig. 2. As noted above, both the nitrogen partial pressure and nitriding temperature have a distinct effect on the preferred orientation of the Cr–Si–N films. At the nitriding temperature of 700 °C [Fig. 2(a)], the Cr–Si–N films show a preferred (111) orientation; with increasing nitrogen partial pressure, the intensity of the (111) peak increases, whereas the intensity of the (200) peak decreases accordingly. In contrast, at a high nitriding temperature of 800 °C, the Cr–Si–N films show a strong preferred (200) orientation [Fig. 2(b)], and the influence of the nitrogen partial pressure on the texture coefficients shows a reverse trend as that at low nitriding temperature. Further, at the same nitrogen partial pressure, a transition of preferred orientation from the (111) to (200) occurs when the nitriding temperature is increased. In general, Cr–Si–N films prepared by a variety of deposition techniques have displayed either the preferred (111) or (200) orientation.Reference Martinez, Sanjinés, Banakh and Lévy11, Reference Mercs, Bonasso, Naamane, Bordes and Coddet20 The evolution of preferred orientation for the films has been widely investigated by many researchers in recent years.Reference Pelleg, Zevin, Lungo and Croitoru32–Reference Lin and Duh34 Pelleg et al.Reference Pelleg, Zevin, Lungo and Croitoru32 have developed a thermodynamic model to describe the preferred orientation in films, in which the change in the preferred orientation is considered as a result of the competition between surface and strain energy. They also found that the strain energy is closely related to film thickness. For example, for the thinner TiN film, the stress can be neglected, and the film growth is determined by the surface energy and thus a (001) orientation should be observed, while for the thicker TiN film, the stress contribution predominates and a preferred growth of (111) lattice planes is expected. Su et al.Reference Su, Hu, Wang, Wen, Liu and Zheng33 also have investigated the preferred orientation evolution in ternary WCxNy thin films using the density functional theory calculations based on first-principles. The calculated results show that the preferred orientation is dependent on the competition between strain energy and surface energy. Lin and DuhReference Lin and Duh34 have studied the evolution preferred orientation of CrAlSixN coatings. The results show that the CrAlN coatings tend to grow along (111) direction due to the smallest strain energy. The change in preferred orientation from (111) to (200) for the CrAlSixN coatings is directly related to the incorporation of amorphous Si3N4 phase in CrAlSiN coatings. Thus, the evolution of preferred orientation for the films can be explained in terms of the competition between surface and strain energy. When accumulated intrinsic stress and strain energy dominates the preferred orientation, the face-centered cubic (fcc) structure of CrN films tends to grow at the (111) direction, which has the lowest strain energy. The change in preferred orientation from (111) to (200) for the Cr–Si–N films is directly related to the formation of amorphous Si3N4 matrix in the films at high nitriding temperature. While the growth along the (111) direction is interrupted by the formation of amorphous Si3N4, the surface energy becomes the dominant factor controlling the preferred orientation, and thus the films grow along the (200) plane, which has the lowest surface energy. Furthermore, at high nitriding temperature, the mobility of the atoms is increased, which helps develop an equilibrium structure, i.e., (200) plane.Reference Jones, McColl and Gran30
The calculated texture coefficients for the as-deposited Cr–Si–N films obtained at nitriding temperature of (a) 700 °C and (b) 800 °C with different nitrogen partial pressures.

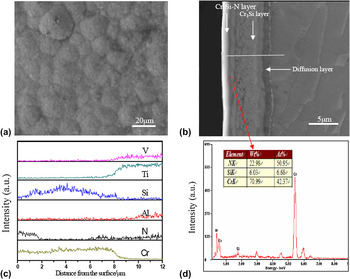
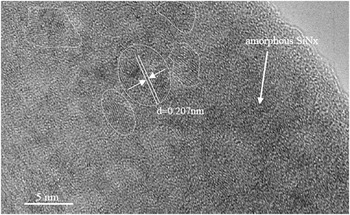
The surface topography of the Cr–Si–N film synthesized at a nitrogen partial pressure of 4.5 Pa and a nitriding temperature of 800 °C is shown in Fig. 3(a). The film shows a densely packed microstructure with a relatively smooth and even surface. The cross-section and corresponding EDXS line scan of the film are shown in Figs. 3(b) and 3(c), respectively. The surface-modified layer prepared by duplex surface treatment consists of three different sublayers: an outer nitride layer [its composition is shown in Fig. 3(d)], an intermediate Cr3Si layer, and an inner diffusion layer. Each sublayer is uniform and continuous without visible microcracks or pores. Notably, the diffusion layer shows a gradient distribution of alloying elements, which can increase the interfacial toughness and help reduce stress concentration between the film and substrate when the film is subjected to external loading. High-resolution TEM image of the film produced at the nitrogen partial pressure of 4.5 Pa and the nitriding temperature of 800 °C shows that the average grain size of crystallites is ∼5 nm and the crystallites are encapsulated by an amorphous matrix. Further, the crystalline/amorphous interfaces appear to be atomically sharp (Fig. 4). In addition, the lattice fringes visible in Fig. 4 show a lattice spacing of 0.207 nm, which corresponds to the (200) plane spacing of the CrN phase. Based on these experimental results, it can be inferred that during the plasma nitriding process, nitrogen reacts with Cr3Si to form nanocrystallite CrN embedded in an amorphous SiNx. The chemical reaction may be expressed as:

(a) Surface morphology of the as-deposited Cr–Si–N film obtained at a nitrogen partial pressure of 4.5 Pa and nitriding temperature of 800 °C; (b) Cross-section scanning electron microscopic morphology of the as-deposited Cr–Si–N film; (c) the corresponding the line scan of the as-deposited Cr–Si–N film; (d) Energy dispersive x-ray spectroscopy analysis of external nitrided layer.

High-resolution transmission electron microscope image of the nitrided layer of the as-deposited Cr–Si–N film obtained at the nitrogen partial pressure of 4.5 Pa and nitriding temperature of 800 °C.

B. Mechanical properties
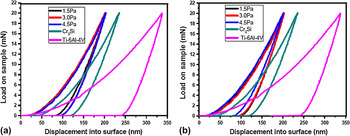
The load–displacement (P–h) curves of the Cr–Si–N films, Cr3Si films, and untreated Ti–6Al–4V under a maximum load of 20 mN are shown in Figs. 5(a) and 5(b). The indentation depth of the Cr–Si–N films at the maximum load is less than 200 nm (or 10% of the film thickness), indicating that the contribution to measured mechanical properties from its substrate might be negligible. Compared with the untreated Ti–6Al–4V and Cr3Si films, the load–displacement curves of the Cr–Si–N films show a shift toward lower penetration depths, meaning that the hardness of the films is improved by the duplex surface treatment. The hardness (H) and Young’s modulus (E) calculated from the load–displacement curves for the Cr–Si–N films are given in Table I. For the nitriding temperature of 700 °C, the hardness of the Cr–Si–N films increases from 35 to 39 GPa, as the nitrogen partial pressure is increased from 1.5 to 4.5 Pa. However, the Young’s modulus shows a reverse trend as that of the hardness. For the higher nitriding temperature (800 °C), similar results are obtained, although the hardness and Young’s modulus of the films are slightly higher than that of the films obtained at lower nitriding temperature (700 °C), which might be attributed to a change in preferential orientation growth.Reference Martinez, Sanjinés, Banakh and Lévy11 Martinez et al.Reference Martinez, Sanjinés, Banakh and Lévy11 have investigated the mechanical properties of CrNy and Cr1−xSixN1.02 films as a function of N and Si contents near the fcc-CrN stoichiometric composition. The experimental results suggest that the hardness and Young’s modulus for the CrNy films are strongly dependent on the texture of film but are not sensitive to the variation of their chemical composition. They found that the hardness and Young’s modulus values of (200) textured CrN films are higher than those of (111) textured CrN films. Usually, the hardness of the Cr–Si–N films is controlled by their microstructure and changes in preferred orientation. As is well known, when the grain size is reduced to smaller than 6 nm, dislocations are absent in the grains and the grain boundary sliding plays a decisive role in the material deformation.Reference Veprek35 The high binding energy of Si–N and Si–Cr bonds in the grain boundary impedes the grain sliding, resulting in the high hardness of the Cr–Si–N films. As can be seen from Fig. 4, the average crystallite separation in an amorphous region is about 3–4 nm, which is favorable to the enhancement of hardness due to the coherence strain effect at the interfaces between nc-CrN and a-SiNx.Reference Veprek35 Moreover, the relatively low hardness of Cr–Si–N films with a preferred (111) orientation is considered to be due to the fact that the (111) orientation coincides with the primary slip planes for the fcc-NaCl structure.Reference Barret and Massalski36 However, at nitriding temperature of 700 °C, the hardness of the Cr–Si–N films increases with increasing (111) preferred orientation. This relationship between orientation and hardness requires further investigation.
The load–displacement (P–h) curves for the as-deposited Cr–Si–N films obtained at nitriding temperature of (a) 700 °C and (b) 800 °C with different nitrogen partial pressures.

Hardness (H), Young’s modulus (E), resistance against elastic strain to failure (H/E) and resistance to plastic deformation (H 3/E*2) for the as-deposited Cr–Si–N films with different nitrogen partial pressure.

Reports in the literature suggest that the wear resistance of a hard film is found to be determined by the H/E or H 3/E*2 ratio, where E* = E/(1−ν 2) is the effective Young’s modulus and ν is the Poisson’s ratio.Reference Musil, Kunc, Zeman and Poláková37 With increasing nitrogen partial pressure and nitriding temperature, the H/E ratio and H 3/E*2 ratio are increased as shown in the Table I. The measured H 3/E*2 ratios for the Cr–Si–N films are higher than those reported by Benkahoul et al.,Reference Benkahoul, Robin, Martinu and Klemberg-Sapieha13 implying that the Cr–Si–N films prepared by duplex surface treatment exhibit a higher wear resistance.
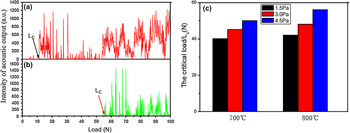
The AE curves and critical load (L c) for the Cr–Si–N film directly deposited on Ti–6Al–4V without a Cr3Si interlayer and the Cr–Si–N films prepared by duplex surface treatment are shown in Fig. 6. For the Cr–Si–N film directly deposited on Ti–6Al–4V, AE peak with continuous fluctuation emerges at the applied load ∼12 N, which represents the critical load (L c) for the film delamination. In the case of the Cr–Si–N films by duplex surface treatment, all critical loads (L c) are higher than 30 N, which is believed to be sufficient for sliding contact applications.Reference Hogmark, Jacobson and Larsson38 Thus, the Cr3Si interlayer is considered to be responsible for the increased adhesion strength of the Cr–Si–N films.Reference Rodrigo and Ichimura39
Acoustic emission signal peaks versus normal load curve for the Cr–Si–N film directly deposited on Ti–6Al–4V (a) without Cr3Si interlayer and (b) with the Cr3Si interlayer, and the corresponding critical load values (c) of Cr–Si–N films on Ti–6Al–4V with interlayer.

C. Sliding wear behavior
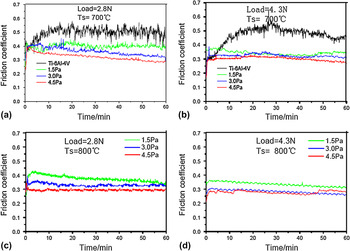
The variation of friction coefficients for the as-deposited Cr–Si–N films and untreated Ti–6Al–4V sliding against GCr15 steel balls at different loads are shown Fig. 7. The mean friction coefficients are determined from the steady-state stage. The mean friction coefficient of untreated Ti–6Al–4V under the normal load of 4.3 N is higher than that under the normal load of 2.8 N. In our previous study,Reference Xu, Liu and Lu40 we found that the increase of the friction coefficients with the increase of the normal load is due to the increase of actual contact area, the generation of wear debris, as well as surface softening arising from the thermal effect under dry friction conditions. For the duplex surface treated sample, at the same nitriding temperature, the mean friction coefficients are independent of the normal load, but decrease with increasing nitrogen partial pressure, and are reduced by 0.2–0.3 as compared to the untreated substrate.
The variation of friction coefficients for the as-deposited Cr–Si–N film and Ti–6Al–4V sliding against a GCr15 steel ball at different applied loads.

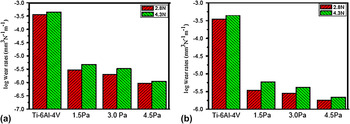
The specific wear rates for the duplex surface modified and untreated Ti–6Al–4V are shown in Fig. 8 as a function of normal load. For untreated Ti–6Al–4V, the specific wear rate increases from 3.5 × 10⁻⁴ to 4.4 × 10⁻⁴ mm3N−1m−1 when the load increases from 2.8 to 4.3 N. In the case of the Cr–Si–N coated samples, however, the specific wear rates are about or slightly lower than 10−7 mm3N−1m−1 under both loads, which are three orders of magnitude less than that of untreated Ti–6Al–4V. Moreover, under a given nitriding temperature, the specific wear rate of the treated sample decreases with increasing nitrogen partial pressure; under a given nitrogen partial pressure, the specific wear rates decrease with increasing nitriding temperature. Consequently, the surface-treated sample synthesized at the nitrogen partial pressure of 4.5 Pa and 800 °C shows the lowest specific wear rate and mean friction coefficients, which can be justified by the values of H 3/E* 2 and H/E.
Specific wear rate of Ti–6Al–4V and the as-deposited Cr–Si–N film obtained at nitriding temperature (a) 700 °C and (b) 800 °C with different nitrogen partial pressures after wear time of 60 min at the different applied normal loads.

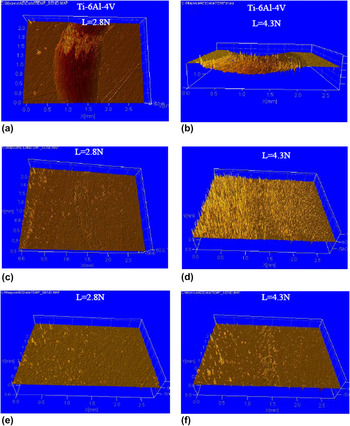
The three-dimensional visualization of the worn surfaces of untreated Ti–6Al–4V alloys and the surface treated under the normal loads of 2.8 and 4.3 N are shown in Fig. 9. The worn surface of Ti–6Al–4V is rough with deep grooves, and the wear track becomes wider and deeper under a higher normal load (4.3 N), as shown in Figs. 9(a) and 9(b), indicating that abrasive wear is the predominant wear mechanism. Conversely, the worn surface of the treated sample is smooth and shows negligible wear damage under the normal load of 2.8 and 4.3 N [Figs. 9(c)–9(f)]. Because the hardness of the Ti–6Al–4V is much lower than that of the GCr15 ball, the hard asperities on the surface of GCr15 steel ball penetrate into the surface of untreated Ti–6Al–4V, which results in the deep grooves on the worn surface of the Ti–6Al–4V. The excellent wear resistance of the surface treated sample is largely related to high H 3/E* 2 and H/E of the films, which promotes elastic deformation and reduces adhesion wear.Reference Xu27 Additionally, the wear behavior of the treated sample may also be affected by the tribochemical reactions in contact area, which have been detected in wear tests of ceramics, e.g., SiNx reacted with H2O to produce SiOx tribofilms.Reference Kim, Kang, Kim, Kim, Shin and Je16, Reference Lee and Chang17 These tribofilms act as a self-lubricating layer, which reduces the mean friction coefficients and the specific wear rates.
Three-dimensional image of worn surface of Ti–6Al–4V and the as-deposited Cr–Si–N film after wear time of 60 min at different applied normal loads: (a) Ti–6Al–4V under the applied normal loads of 2.8 N, (b) Ti–6Al–4V under the applied normal loads of 4.3 N, (c) the as-deposited Cr–Si–N film obtained at nitriding temperature of 700 °C under the applied normal loads of 2.8 N, (d) the as-deposited Cr–Si–N film obtained at nitriding temperature of 700 °C under the applied normal loads of 4.3 N, (e) the as-deposited Cr–Si–N film obtained at nitriding temperature of 800 °C under the applied normal loads of 2.8 N, and (f) the as-deposited Cr–Si–N film obtained at nitriding temperature of 800 °C under the applied normal loads of 4.3 N.

D. Electrochemical measurements
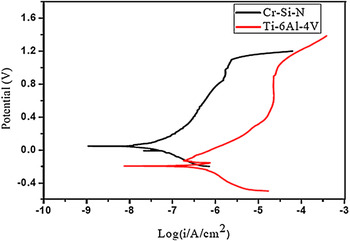
As shown above, the alloy surface treated at nitrogen partial pressure of 4.5 Pa and 800 °C shows a good combination of mechanical properties and wear resistance and is thus chosen to further investigate its corrosion behaviors. Typical potentiodynamic polarization curves of treated and untreated Ti–6Al–4V in 5 wt% HCl solution are shown in Fig. 10. The anodic polarization curve of the treated alloy is characterized by a wide passive region without any distinctive active-passivation transition region, suggesting that the coated alloy is passivated in 5 wt% HCl solution. Apparently, the corrosion potential (E corr) of the coated alloy is greater than that of untreated Ti–6Al–4V. The corrosion-current density (I corr) of the treated alloy is two orders of magnitude lower than that of untreated Ti–6Al–4V, indicating that the coated alloy possesses a lower corrosion rate in the solution.
The polarization curves of the as-deposited Cr–Si–N film obtained at nitrogen partial pressure of 4.5 Pa and 800 °C and untreated Ti–6Al–4V alloy in 5 wt% HCl solution.

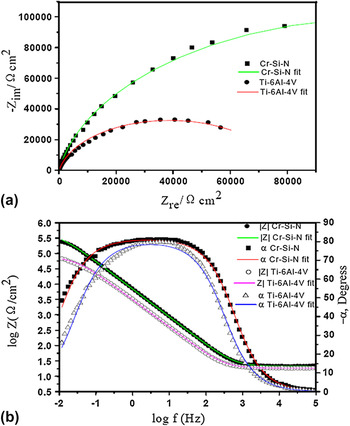
EIS analysis is carried out also in the 5 wt% HCl solution to provide a mechanistic insight into film degradation and corrosion development in the surface treated alloy. Nyquist and Bode plots obtained from the coated and untreated Ti–6Al–4V in 5 wt% HCl solution at their respective OCPs are shown in Figs. 11(a) and 11(b). The Nyquist plots of both the treated alloy and the untreated material exhibit only one single capacitance loop, the characteristic of one time constant. The formation of these semicircles is attributed to the charge transfer process at the electrode/electrolyte interface.Reference Ye, Li and Wang41 The radius of semicircle of the treated alloy is larger than that of the untreated Ti–6Al–4V, indicative of a better corrosion resistance for the coated alloy. According to Bode-phase plots [Fig. 11(b)], the phase angle approaches 0° at high frequencies, indicating that the impedance is dominated by solution resistance in this frequency range (no phase shift between current and potential results due to the presence of a resistor in AC circuit). Moreover, the phase angle shifts toward lower values in the low frequency region, reflecting the contribution of polarization resistance to the impedance. Meanwhile, from medium to low frequencies (0.1Hz–100Hz), the Bode-phase plots exhibit a “plateau” where the phase angle was close to 90°, suggesting that a highly stable passive film is formed on both alloys in the electrolyte used.Reference de Assis, Wolynec and Costa42 For the Bode-modulus plots [log |Z| versus log(f)] [Fig. 11(b)], two distinct regions are observed. In the higher frequency region (103–105 Hz), the Bode-modulus plots exhibit constant log |Z| values over log(f) with a phase angle near 0° due to the response of the electrolyte resistance R s (resistive region). In the low and middle frequency range (0.01–1000 Hz), the spectra display a slope of about −1, which reflects the capacitive behavior of the surface film. The corrosion rate can also be estimated by the absolute values of the impedance at low frequency |Z|f→0. The higher value of |Z|f→0 implies a lower corrosion rate of the materials. It is evident from the Bode-modulus plots that the |Z|f→0 value of the coated alloy is much higher than that of Ti–6Al–4V, providing further evidence that the treated alloy has superior corrosion resistance in 5 wt% HCl solution, compared to Ti–6Al–4V.
(a) Nyquist plot and (b) Bode plot for the as-deposited Cr–Si–N film and untreated Ti–6Al–4V in 5 wt% HCl solution: (symbols) experimental data; (lines) model data.

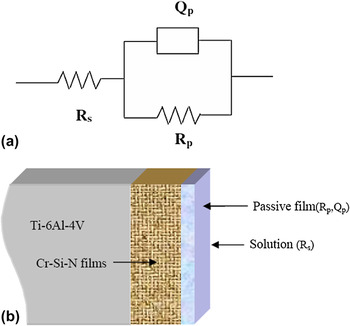
The equivalent circuit model, as shown in Fig. 12(a), is used for curve fitting and quantitative studies. This model is given as a simple R s(Q PR P) circuit, wherein R s is the solution resistance, R P is the passive film resistance, and Q P is the constant phase element (CPE) for the passive film. The physical model of this equivalent circuit R s(Q PR P) has also been shown in Fig. 12(b). According to this physical model, a single passive film has formed on a metal surface, which possesses resistance as well as capacitance.Reference Shukla and Balasubramaniam43 The CPE is used instead of an ideal capacitance element to improve the fit quality. In the case of solid materials, CPE is controlled by distributed surface reactivity, surface heterogeneity, roughness or fractal geometry, electrode porosity, and to current and potential distributions related with electrode geometry.Reference Fekry44 The impedance of the CPE is defined as:

(a) Equivalent circuit used to fit the experimental impedance data of the as-deposited Cr–Si–N film and untreated Ti–6Al–4V alloy in 5 wt% HCl solution; (b) the physical model for this equivalent circuit R s(Q PR P).

where Q is the frequency independent parameter, which usually depends on temperature. CPE describes an ideal capacitor as n = 1, an ideal resistor as n = 0, and a pure inductor n = −1. The value of n is associated with the nonuniform distribution of current as a result of roughness and surface defects. The values of solution resistance (R s), the passive film resistance (R P), total capacitance (Q P) of the constant phase angle element (CPE), and n are calculated by simulating the experimental data using R s(Q PR P) circuit with Zview software, and the results are listed in Table II. A small chi-squared (χ2) and low percentage error in these parameters indicate that an excellent agreement is achieved between the experimental data and the simulation.
Electrochemical parameters obtained by equivalent circuit simulation.

The error percentage resulting from fitting for each component of the equivalent circuit proposed is indicated in parentheses.
Generally speaking, CrN itself is inert to chemical attacks due to their higher position in the electrochemical series. However, in practice, galvanic and crevice corrosion is often seen occurring between the CrN film and the substrate because of the presence of surface defects (e.g., growth defects and pores) in the films. These defects provide pathways for the electrolytes to reach the film/substrate interface, and are, thus, detrimental to the corrosion resistance of the coated alloys. As shown in Fig. 3, the Cr–Si–N films produced here have a dense and compact microstructure without visible microcracks or pores, which act as a physical barrier to acid attack. Another reason for the excellent corrosion resistance of the treated alloy is attributed to the formation of the protective passive film and its nanocrystalline/amorphous composite structure. The as-deposited Cr–Si–N films are composed of a large amount of chromium and silicon, which are considered to be strong passive elements in corrosive environments. Moreover, the Cr–Si–N films have dense grain boundaries, which enable the fast diffusion of atoms and thus accelerate either passivation or formation of a protective film to block further corrosion reaction. The reduced electrical conductivity of the amorphous SiNx phase also makes an important contribution to the excellent corrosion resistance of the Cr–Si–N films.Reference Barshilia, Deepthi and Rajam45
IV. CONCLUSION
In the present study, nanocomposite Cr–Si–N films are prepared onto a Ti–6Al–4V substrate by a novel duplex surface treatment technique, together with a Cr3Si interlayer. The results show that the films have a dense and compact microstructure and consist of three different sublayers, namely, a nitriding layer, an interlayer, and a diffusion layer. The microstructure of the nitriding layer is characterized by nanocrystallite CrN grains embedded in an amorphous SiNx matrix. The nanoindentation tests show that the hardness of the Cr–Si–N films increases with the nitrogen partial pressure. However, their Young’s modulus shows a reverse trend as that of the hardness. The critical load values of the Cr–Si–N films prepared by duplex surface treatment are higher than those of the Cr–Si–N film directly deposited on Ti–6Al–4V without Cr3Si interlayer, revealing that duplex surface treatment can help improve the adhesion strength between the films and the substrates. The dry wear test results show that the specific wear rates of the coated alloy are about or slightly lower than 10−7 mm3N−1m−1, which are three orders of magnitude lower than that of untreated Ti–6Al–4V. The electrochemical experiments demonstrate that the Cr–Si–N films serves as an effective physical barrier against the corrosion of Ti–6Al–4V.
ACKNOWLEDGMENTS
The authors gratefully acknowledge the financial support of the National Natural Science Foundation of China under Grant No. 51175245 and the Key Program of Jiangsu province Natural Science foundation of China under project No.BK2010073. Z. Xie also acknowledges the financial support provided by Edith Cowan University (ECU) through the ECU-Industry Scheme.