


Surveyed Area
During the German Antarctic Expeditions of 1983–84 and 1985–86 more than 9700 km of flight lines in western Neuschwabenland, especially Ekström Ice Shelf, the Kottas Mountains [Heimefrontfjella] and the Kraul Mountains [Vestfjella] were digitally recorded by the electromagnetic reflection (EMR) method by the Dornier-228 research aircraft Polar 2 (Reference Thyssen and KahntThyssen and Kahnt 1984, Reference Thyssen and KohnenThyssen 1985a and b, Reference Hoppe and ThyssenHoppe and Thyssen 1987). Georg von Neumayer Station served as the base for these flights.
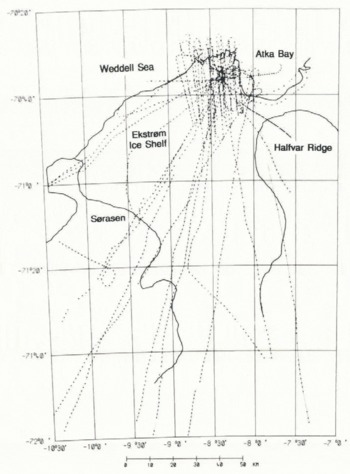
Eighteen tracks totalling about 3100 km were flown over Ekström Ice Shelf. The data are sufficient for mapping the ice thickness, the surface elevation and other characteristics of the 6000 km1 ice shelf. A general view of the flight lines is given in Figure 1.
Ice Thickness and Freeboard
During the flight the EMR data were collected at the rate of four records per second. To obtain the results presented in this paper we used every eightieth data point. This corresponds to a distance of 1.8–2.0 km, depending on the speed of the aircraft. By this means the essential features of the ice shelf can be shown. The complete data set will permit a more detailed evaluation of special Structures.
Taking the velocity-depth function derived from the area close to Georg von Neumayer Station (Reference BlindowBlindow, unpublished), ice thicknesses were calculated from the reflection travel time. The same velocity–depth function was applied over the whole ice shelf, because a comparison with results from Filchner–Ronne Ice Shelf shows that variations between different regions are small.
The maximum error due to any uncertainty in the velocity—depth function represents less than 3 m in ice thickness. Owing to errors in navigation and selection of the reflection signals, this error in the ice thickness is considered to be negligible.
Reflection horizons were determined in the EMR field record to an accuracy of 60 ns. This corresponds to an error in ice thickness of 5.5 m. The error may seem large, as digital techniques of processing allow a precision of nearly 10 ns. However, for the areal evaluation of ice thickness an accuracy of 5.5 m is sufficient, because the distance between single flight lines was too great (up to 20 km in places) to justify more detailed analysis.
Fig. 1. Map of flight lines on Ekström Ice Shelf (grounding line and ice front from maps of the Institut für Angewandte Geodäsie (1984a, b, 1985a, b, c)).
In addition to the EMR measurement, the radar altitude, the pressure altitude and the actual navigation data of the aircraft were digitally recorded.
From the radar altitude, at a constant pressure altitude, the surface elevation (freeboard) of the ice shelf can be determined. For this it is important to record the radar and pressure altitude above sea-level at the beginning and end of each flight and, if possible, also during the flight.
Changes in altitude and in the pitch and roll of the aircraft influence both altimeters. The high-frequency element in the changes in altitude was reduced by averaging the data with a 5-point running mean filter. In addition, changes in barometric pressure influence the pressure altimeter. These changes can be checked by taking into account the buoyancy of the ice shelf. Therefore the freeboard of the ice shelf is plotted as a function of the ice thickness at each measuring point (Fig. 2).
Freeboard as a function of ice thickness (dashed line: least-square fit from measurements; straight line: theoretical model, using a depth–density function of Reference Herron and LangwayHerron and Langway (1980)).

Grounded areas of the ice shelf or an unrecognized basal ice layer show higher surface elevations than those of ice in hydrostatic equilibrium. We have therefore only used data from clear and undisturbed specular-reflection signals. The coefficient of correlation between freeboard and ice thickness is calculated to be r = 0.963, indicating a functional coherence of high quality. From a linear regression analysis using least squares we derive a straight-line model

(dashed line in Fig. 2) for ice thicknesses greater than 100 m. Using this model it is possible to check the surface elevation at each measuring point from the ice thickness recorded by the EMR. This allows us to reduce the effect of changes in barometric pressure on the elevation measurement in areas with clean specular reflections from the bottom of the ice shelf. The mean error in surface elevation is calculated to be 2.5 m and in ice thickness to be 10 m at track intersections.
The equilibrium of a floating ice shelf can be calculated (Reference Coslett, Guyatt and ThomasCoslett and others 1975) by

where ρw is the density of sea-water, ρi the density of pure ice, H the ice thickness, h the freeboard, and C the equivalent length of air contained in a unit vertical column of the ice shelf.
Assuming that ρi = 0.917 Mg m−3, ρw can be calculated from Equation (equ.1) and (2) to 1.0305 ± 0.002 Mg m−3. Within the limit of error this value is equal to sea-water density of 1.0279 Mg m−3, which was calculated from the salinity and potential temperature of the Weddell Sea north-west of Kapp Norvegia. According to Reference Foldvi, Gammelsrød and TørresenFoldvik and others (1985), the salinity of this region is 34.68‰ and the potential temperature is 0.2°C. Where ρw = 1.0305 Mg m −3, C can also be calculated by this equation to be 13.94 ± 0.45. This value is slightly higher than was found to apply to Brunt Ice Shelf (Coslett and others 1975).
An isostatic curve can also be estimated from a depth–density function. For this calculation a semi-empirical model by Herron and Langway (1980) was used. The model was derived for densities up to 0.8 Mg m−3, but an extrapolation to the density of pure ice (ρi = 0.917 Mg m−3) is still a useful approach. The values for the accumulation rate a, the initial snow density ρ0 and the mean annual temperature Τ are given by Reference ReinwarthReinwarth (1982), estimated from a snow-pit near Georg von Neumayer Station (a = 0.35 m/a (water equivalent), ρ0 = 0.446 Mg m−3, Τ = −17°C). In Figure 2 the isostatic curve determined from the Herron and Langway model is plotted as a straight line, using a water density of ρw = 1.0279 Mg m−3.
The relatively small but systematic difference between the linear fit and the model curve amounts to 1.0–1.5 m.
Surface elevation of Ekström Ice Shelf (dashed line: insufficient data)

The reason can be insufficient accuracy in the mean density of sea-water and/or too high a density for the ice shelf. The difference can be analysed in more detail if glaciological parameters for the whole ice shelf are known. Relevant data have been measured during the German Antarctic Expedition 1986–87 (personal communication from O. Reinwarth), but the results are not yet available.
Surface elevations and ice thicknesses with their coordinates have formed the data base for a contour programme. In addition, ice-front data were taken from the maps compiled by the Institut für Angewandte Geodäsie (1984b, 1985a, b, c). For the map of the surface elevation we chose a 10 m contour interval for the ice shelf and 100 m for the inland ice sheet (Fig. 3). For the map of the ice thicknesses we chose isopleths with 50 m intervals (Fig. 4).
Ekström Ice Shelf, which lies between Halfvar Ridge in the east and Sørȧsen in the west, drains ice from the inland ice sheet of western Neuschwabenland. The ice shelf reaches thicknesses of up to 900 m. The main direction of flow is deflected to the north-north-west, probably due to locally grounded areas in Atka Bay. The grounding line can be estimated mainly by its strong gradient of elevation. On the eastern side of Sørȧsen an ice stream can be seen.
On the basis of these results a three-dimensional model of the surface elevation of Ekström Ice Shelf was compiled (Fig, 5). We have no information about the surface elevation from the northern part of Halfvar Ridge. This region (A) is insignificant in the three-dimensional model.
Isostatic Anomalies of EkstrÖm Ice Shelf
From the compilation of surface elevation and ice thickness, fundamental features of Ekström Ice Shelf can be deduced:
Ice thickness of Ekström Ice Shelf (dashed line: insufficient data).

Three-dimensional model of the surface elevation of Ekström Ice Shelf (vertical exaggeration ×58) (region A: no data).

By means of the equilibrium formula (Equation (1)), a theoretical freeboard can be calculated from the ice thickness at every measuring point. The difference between the measured and calculated freeboard represents the deviation from hydrostatic equilibrium (according to Equation (1)). The limit of proof for a deviation amounts to ±4 m. For ice shelves a deviation of zero is expected. For grounded regions the ice shelf is not in equilibrium, so the surface elevation is higher than for a floating ice shelf. Then the difference between the measured and calculated freeboard is a so-called positive isostatic anomaly. However, for floating ice shelves an apparent positive anomaly is possible. This is the case if saline sea ice freezes on to the base of the ice shelf. Since the absorption of electromagnetic waves is too great to obtain a bottom-reflection signal, the internal reflection signal may be interpreted as the bottom of the ice shelf. A positive anomaly results from the calculation of buoyancy (cf. Reference Thyssen and KohnenThyssen 1986, 1987).
Map of isostatic anomalies on Ekström Ice Shelf (dashed line: boundary between areas of different bottom-echo characteristics).

On the basis of this concept, we calculated a contour-line map for the isostatic anomaly (Fig. 6) in order to investigate the possibility of saline ice freezing on to the base of Ekström Ice Shelf.
Figure 6 shows that there is no area on the whole of Ekström Ice Shelf which gives a positive anomaly within the error limit. However, over large areas of Ekström Ice Shelf a negative isostatic anomaly is recognizable. This deviation from buoyancy is at the most −12 m. It can only be explained by an increase in the mean density of the ice shelf. A detailed examination of EMR records from this area reveals steplike features in the bottom reflection (Fig. 7). The travel times differ by more than 500 ns at places only 1 km apart. These local structures are difficult to explain as normal bottom reflections, because a variation in the ice thickness of 45 m must at least influence the equilibrium of the ice shelf and thus the surface elevation.
These structures and the negative anomaly may possibly be interpreted as sedimentary debris in the lower part of the ice shelf, which may be transported from inland. This was suggested by Reference RobinRobin (1958) from reflection-seismic measurements in the same area. Electromagnetic reflections at different depths can be due to an inhomogeneous distribution or a varying concentration of debris. Where ρw = 1.0279 Mg m−3, ρi = 0.917 Mg m−3 and the density for the sediments is 2.6 Mg m−3 the volume of the sedimentary debris in this layer can be estimated. The density of the 45 m thick layer of debris-loaded ice is equal to 1.1375 Mg m−3 with 4.6% by volume of debris. By this hypothesis an anomaly of −10 m can be explained. However, we cannot exclude the possibility that a part of the negative anomaly is caused by a local area of more rapid snow densification (and hence lower values of C), perhaps associated with wind erosion.
EMR field record from the negative-anomaly area in the south of Ekström Ice Shelf.

These hypotheses suggest a possible cause of the negative anomaly in the southern part of the ice shelf. At the present time it is not possible to achieve the same accuracy in the north-western part of the ice shelf because the bottom-reflection signals cannot be measured so accurately. The decrease in the negative anomaly from the grounded area in the direction of flow implies a decrease in the mean density of the ice shelf. It may be caused by bottom melting, with a loss of the sedimentary debris. Figure 6 shows a dashed boundary which separates areas with different bottom-echo characteristics. In the north the electromagnetic reflections are strong and well defined, whereas in the south the reflector is characterized by rough and weak signals.
A flow-line model of Ekström Ice Shelf which uses these data is in preparation.
Acknowledgements
This work has been supported by the Bundesministerium für Forschung und Technologie, the Deutsche Forschungsgemeinschaft and the Ministerium für Wissenschaft und Forschung Nordrhein-Westfalen.
Maps
Institut für Angewandte Geodäsie. 1984a. Bildmittenübersicht, Antarktis-Expedition 1983/84. Ekström Schelfeis, 1 : 500 000. 1. Ausgabe. Frankfurt am Main, Institut für Angewandte Geodäsie (IfAG).
Institut für Angewandte Geodäsie. 1984b. Luftbildkarle, Antarktis-Expedition 1983/84, Georg-von-Neumayer-Station, 1 : 25 000. 1. Ausgabe. Frankfurt am Main, Institut für Angewandte Geodäsie (IfAG).
Institut für Angewandte Geodäsie. 1985a. Luftbildkarte, Antarktis-Expedition 1983/84, Atkabucht, 1 : 50 000. Frankfurt am Main, Institut für Angewandte Geodäsie (IfAG).
Institut für Angewandte Geodäsie. 1985b. Luftbildkarte, Antarktis-Expedition 1983/84. Georg-von-Neumayer-Station, 1 :50 000. Frankfurt am Main, Institut für Angewandte Geodäsie (IfAG).
Institut für Angewandte Geodäsie. 1985c. Luftbildkarte, Antarktis-Expedition 1983/84. Georg-von-Neumayer-Station (West), 1 : 50 000. Frankfurt am Main, Institut für Angewandte Geodäsie (IfAG).



