Introduction
This study marks a significant advancement in the archaeology of the Prut-Dniester Barbaricum, introducing the first systematic application of radiocarbon (14C) dating to materials from the Roman Imperial Period. By analyzing 11 human bone samples, this research establishes a robust dataset that not only complements but also enhances traditional typological dating methods.
The application of Bayesian modeling has further refined the radiocarbon data, structuring it into distinct chronological phases. This approach significantly improves the precision of Sarmatian periodization, reducing chronological uncertainties and offering a more reliable temporal framework for understanding cultural dynamics in the region.
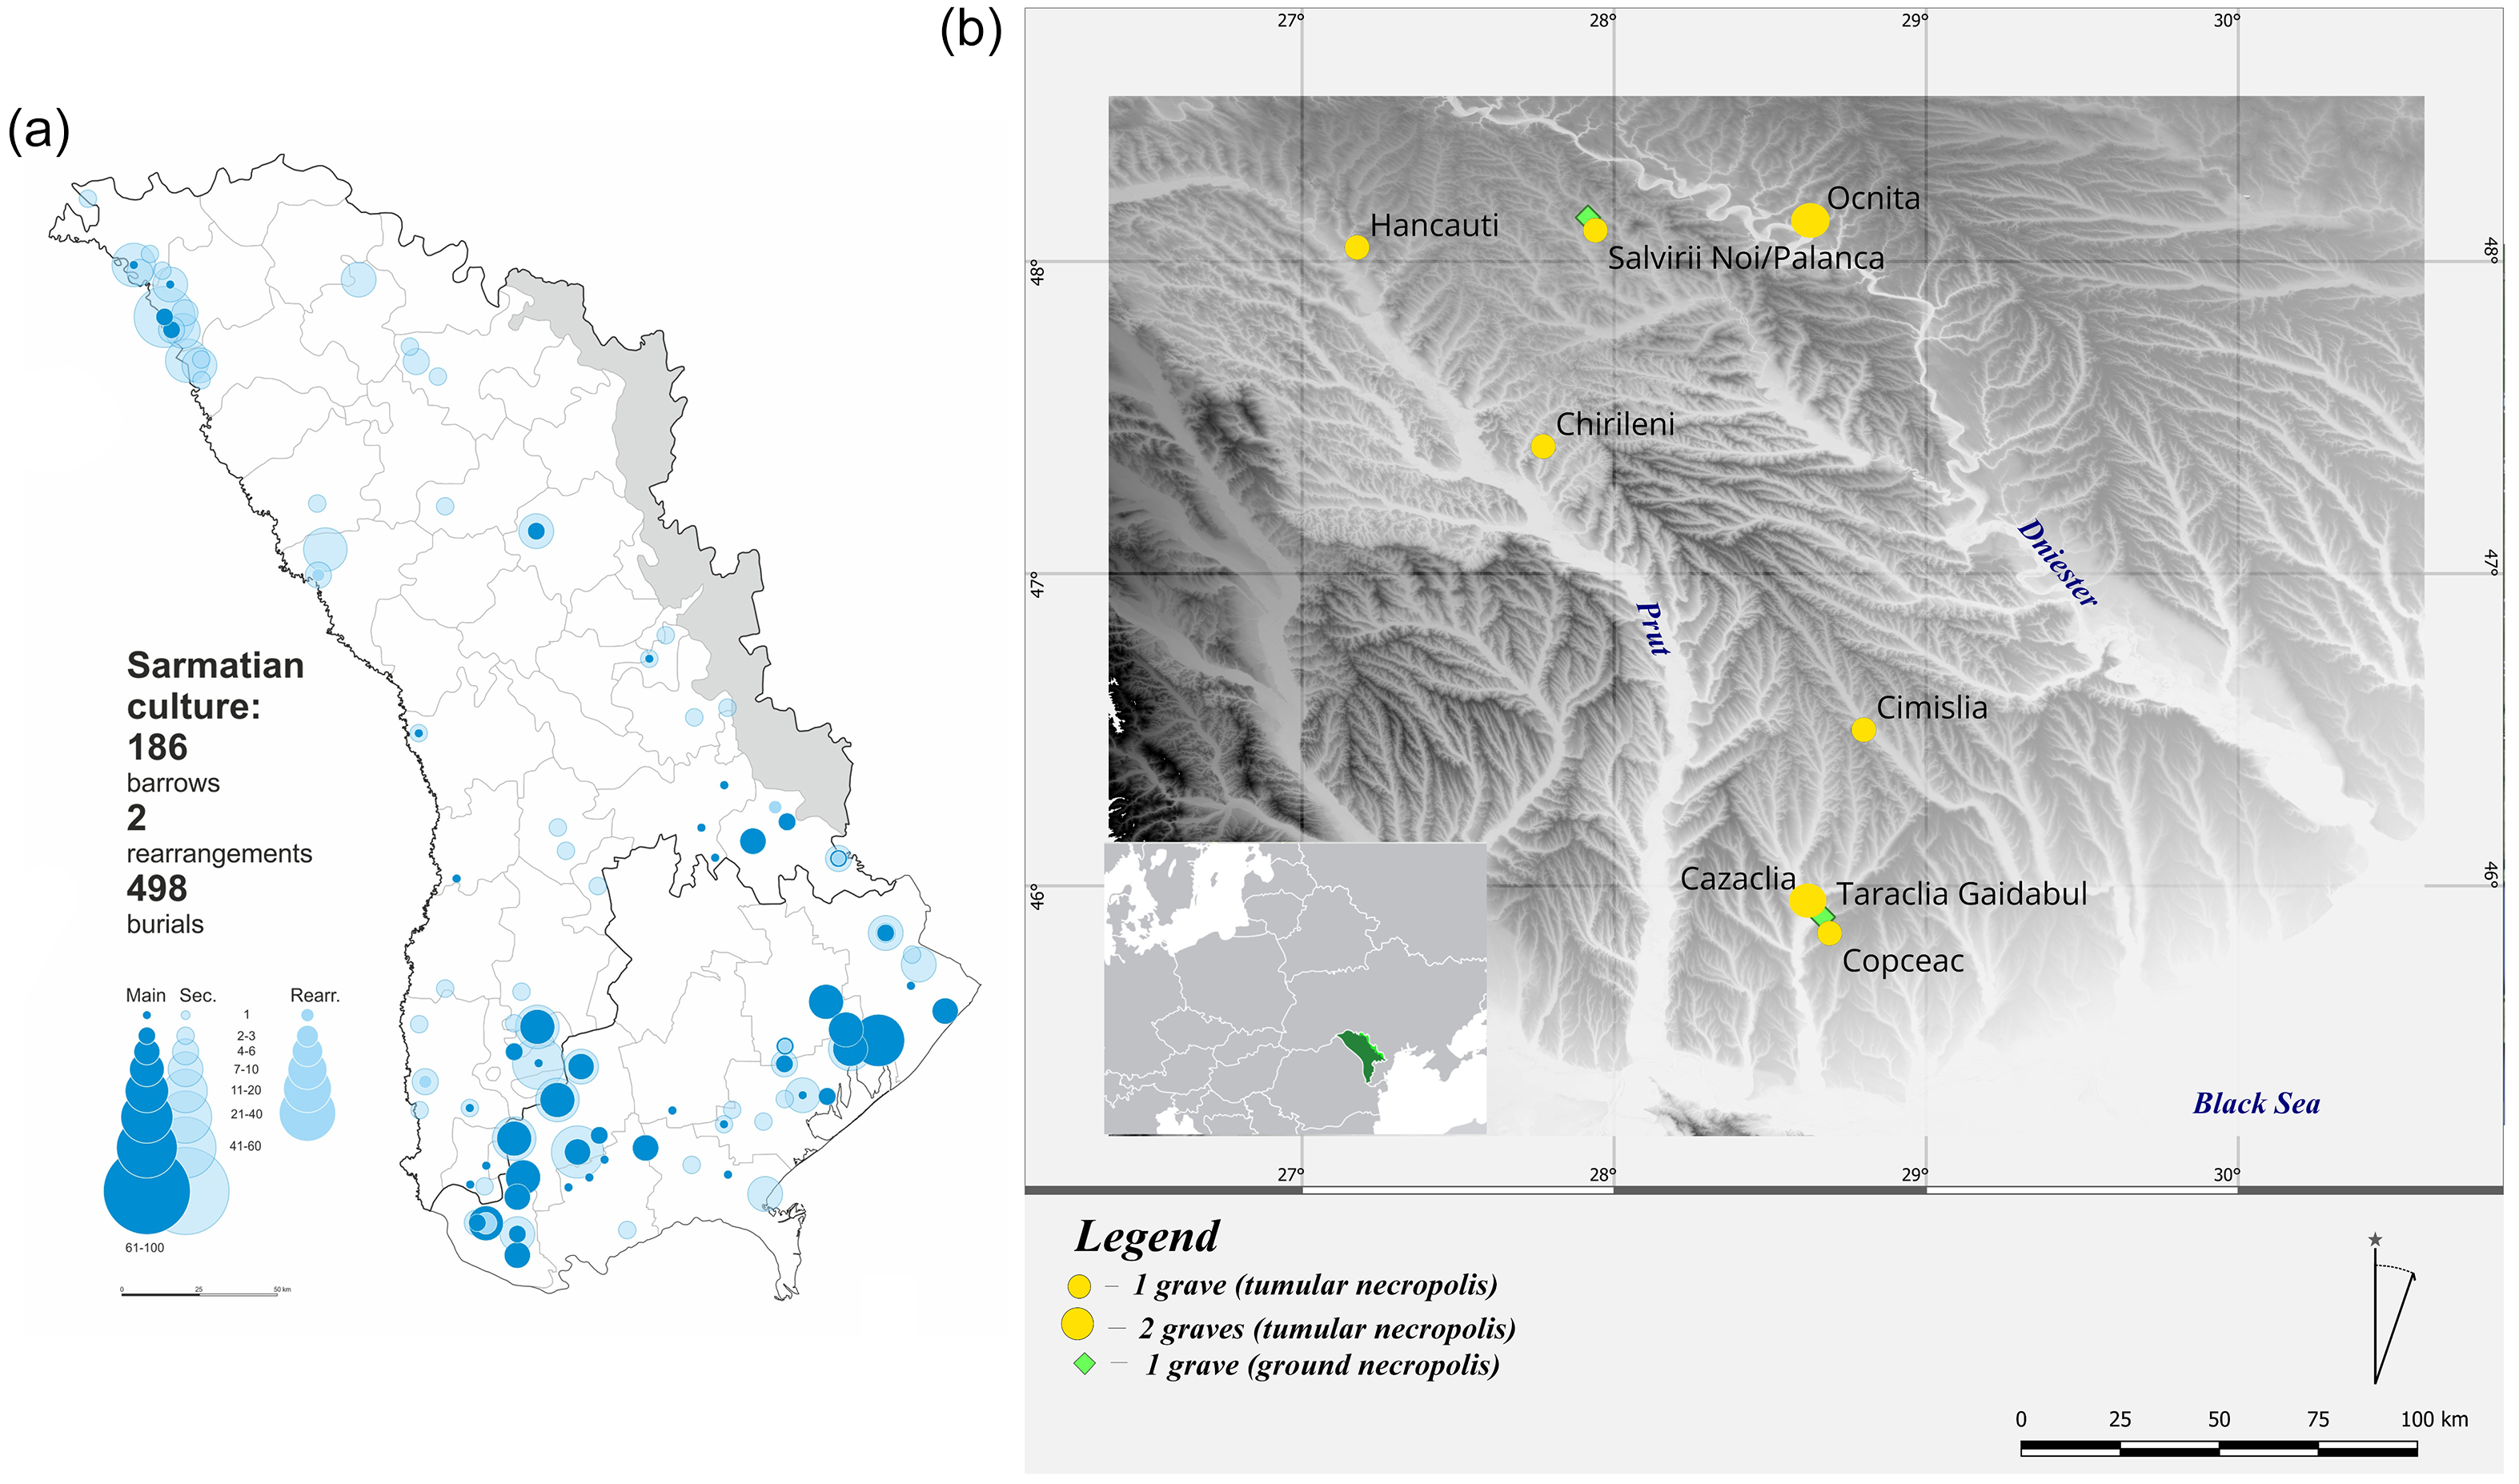
The Prut-Dniester interfluve, strategically positioned between the two rivers, has historically served as a crucial zone of cultural and socio-economic interaction. During the Roman Imperial Period, the region was home to diverse populations, including the Dacians and later the so-called Free Dacians, as well as the cultural group associated with the Etulia horizon (Fyodorov Reference Fyodorov1960; Matveev et al. Reference Matveev, Vornic and Corobcean2023; Vornic et al. Reference Vornic, Bubulici and Ciobanu2006; Vornic et al. Reference Vornic, Telnov, Bubulici and Ciobanu2007). Concurrently, it also hosted communities associated with the Sarmatian culture (Bârcă Reference Bârcă2006; Bârcă and Symonenko Reference Bârcă and Symonenko2009). This study specifically focuses on the Sarmatian cultural presence, represented by funerary remains predominantly found in tumular and ground necropolises across the region. Recent research by D. Topal and V. Bubulici (Topal and Bubulici Reference Topal, Bubulici, Grumeza and Cojocaru Tica2024, 217) has identified 186 tumuli containing 498 Sarmatian graves (Figure 1a), underscoring the prominence of these communities in the Prut-Dniester interfluve.
(a) Map of Sarmatian culture barrow graves (after Topal and Bubulici Reference Topal, Bubulici, Grumeza and Cojocaru Tica2024) and (b) map of provenance of 14C samples from the Prut-Dniester region.

Figure 1 Long description
The image consists of two maps. The first map (a) displays the distribution of Sarmatian culture barrow graves across a region, with different sizes of circles representing the number of burials, rearrangements, and barrows. The legend indicates the main, secondary, and rearranged burials. The second map (b) shows the specific locations within the Prut-Dniester region where 14C samples were collected, marked with yellow dots. Key locations such as Hancauti, Ocnita, Chirileni, Cimislia, Cazaclia, Taraclia, Gaidabul, and Copcac are labeled. The map also includes a smaller inset map showing the broader geographical context within Europe. The Prut and Dniester rivers are highlighted, emphasizing the strategic position of the region between these two rivers. The Black Sea is also marked for geographical reference.
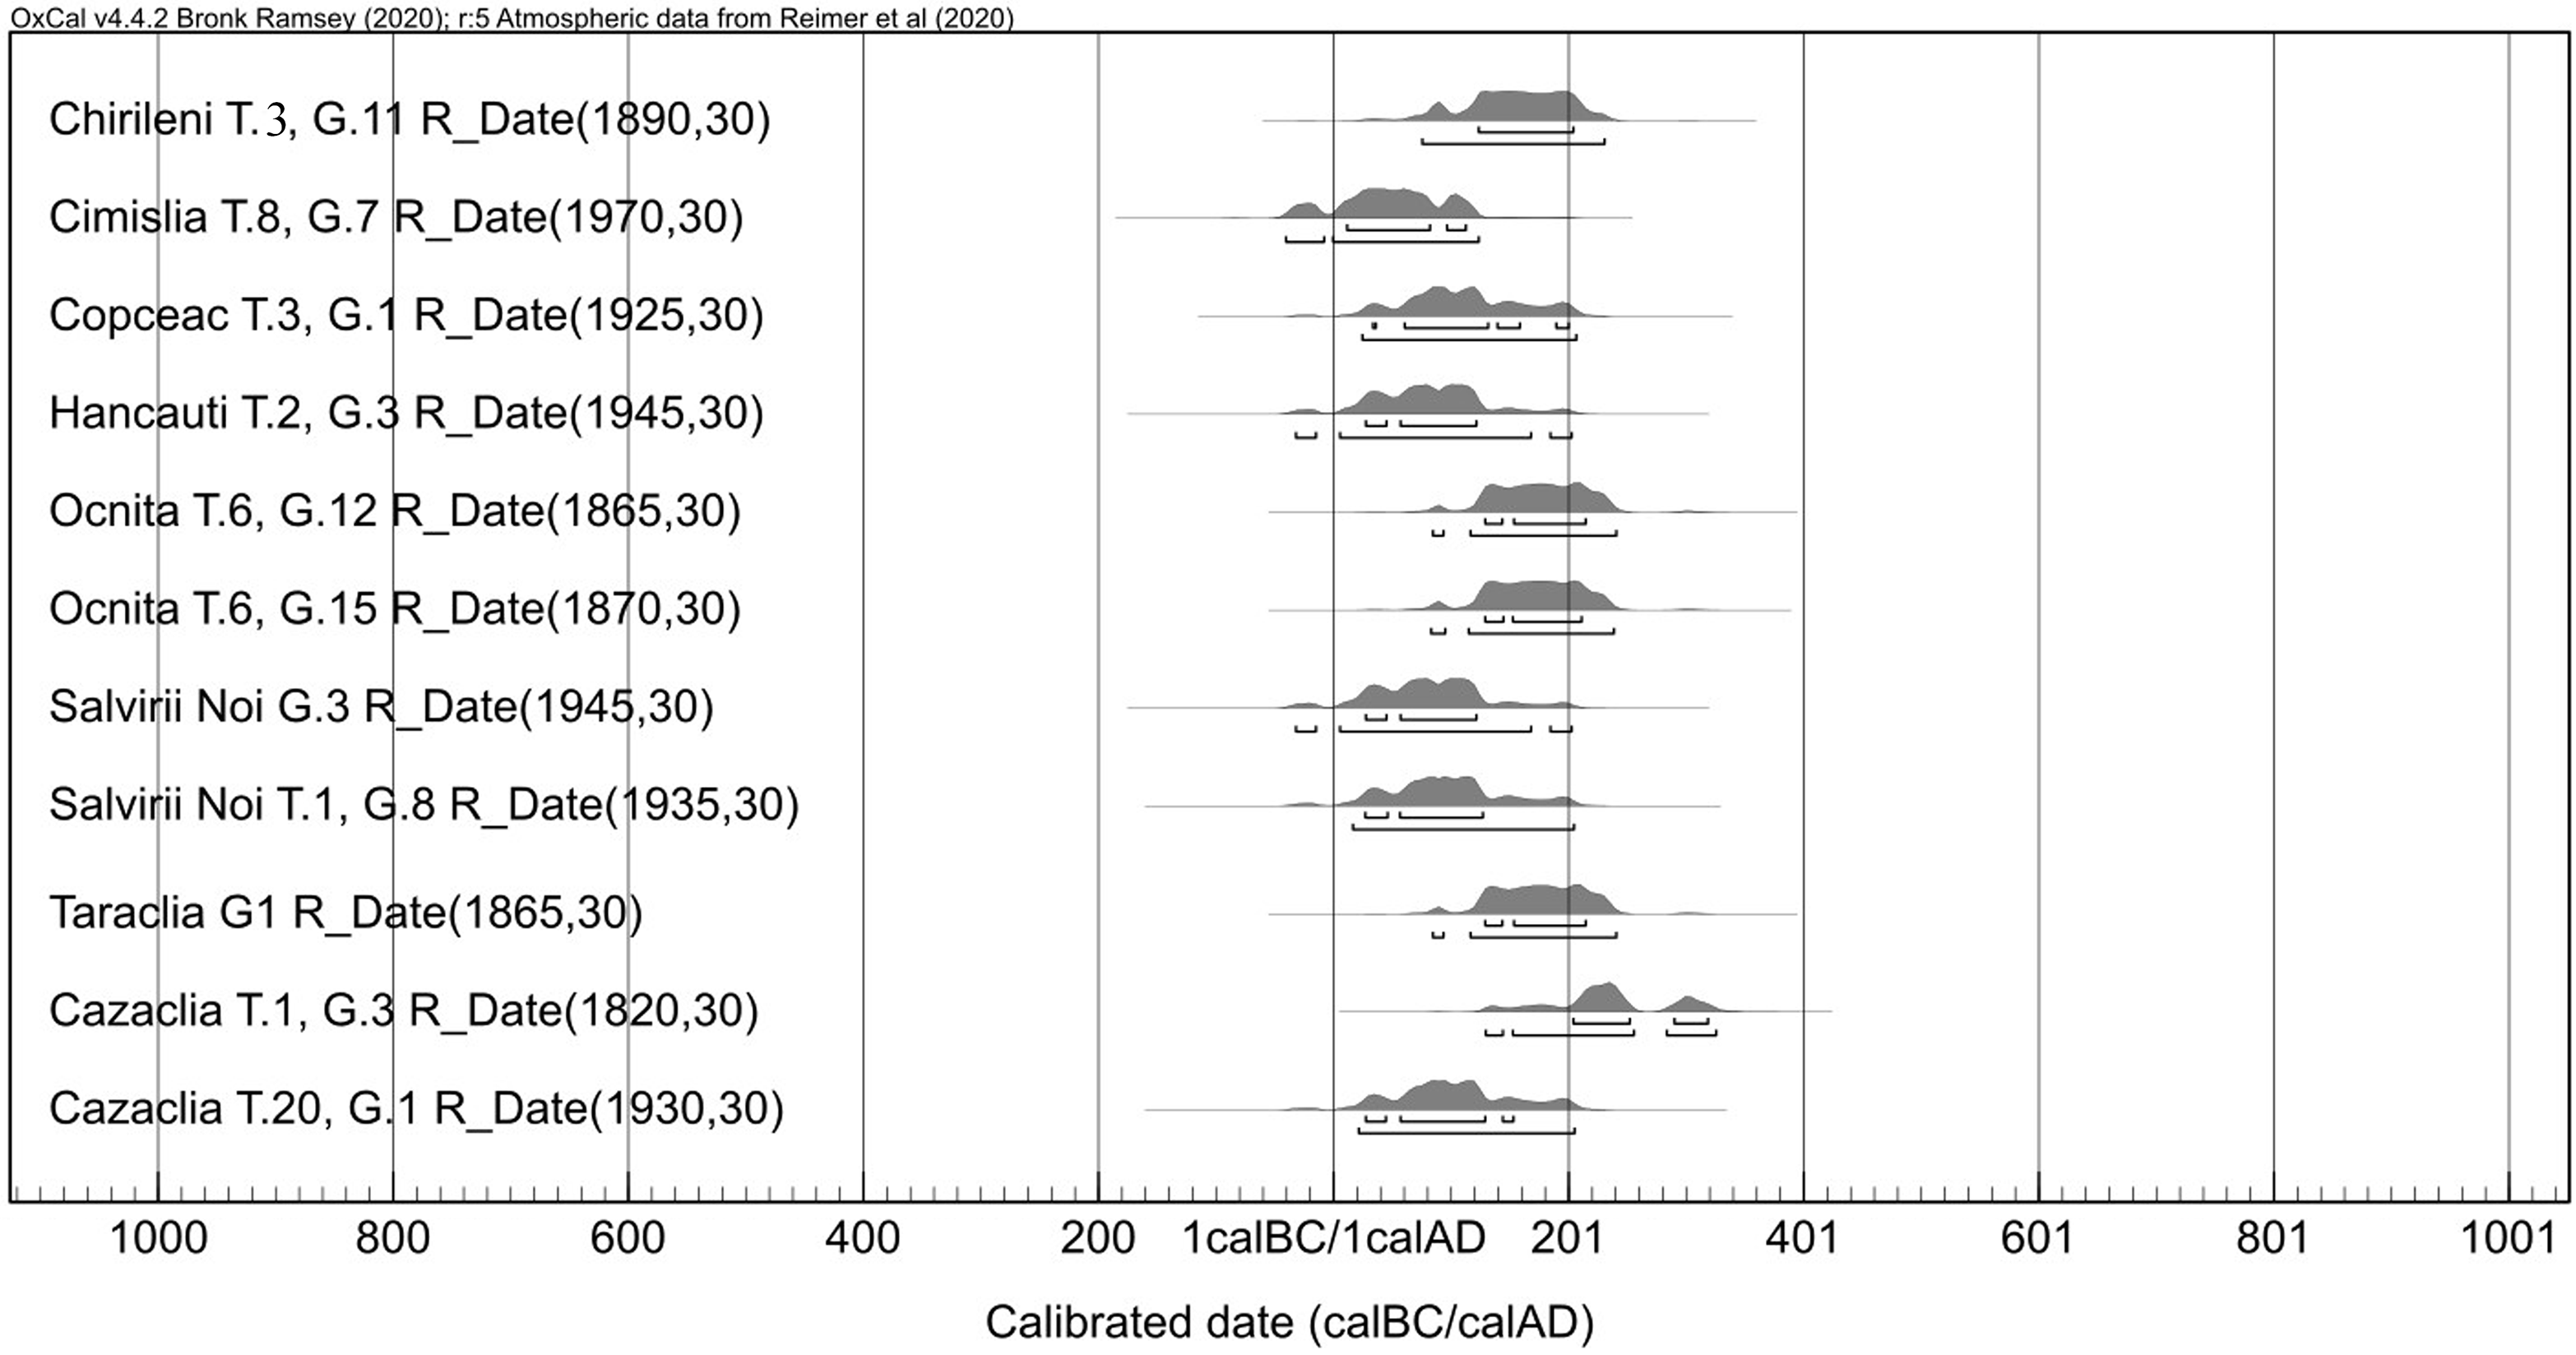
To refine the chronology of the Sarmatian culture in this region and its periphery within the Barbaricum, 11 human bone samples were collected from key archaeological sites dating to the Roman Imperial PeriodFootnote 1 . These sites include Cazaclia (Tumulus (T) 1, Grave (G) 3; T20G1), Chirileni (T3G11), Cimișlia (T8G7), Copceac (T3G1), Hancăuți (T2G3), Șalvirii Noi/Palanca (ground necropolis—G3 and T1G8), Ocnița (T6G12 and G15), and Taraclia Gaidabul (ground necropolis—G1) (Figure 1/b, 2).
14C data calibration graph: laboratory calibration (after AMS 14C Laboratory, Poznań).

Figure 2 Long description
A line graph displays calibrated dates for various archaeological sites. The x-axis represents the calibrated date ranging from 1000 BC to 1000 AD. The y-axis lists different sites with their respective tomb numbers and groups. Each site has a corresponding date range represented by shaded areas and horizontal lines. The sites include Chirileni, Cimislia, Copceac, Hancauti, Ocnita, Salvirii Noi, Taraclia, and Cazaclia, with dates spanning from 1890 to 1970 AD. All values are approximated.
Despite extensive prior research that has significantly contributed to the understanding of the Sarmatian culture, its chronological framework in the Prut-Dniester region remains a subject of ongoing debate and reassessment (Bârcă Reference Bârcă2006; Bârcă and Symonenko Reference Bârcă and Symonenko2009; Dzygovskij Reference Dzygovskij1993, Reference Dzygovskij2013; Fyodorov Reference Fyodorov1960; Grosu Reference Grosu1990, Reference Grosu1995; Rikman Reference Rikman1975a, Reference Rikman1975b). This issue is not limited to the Prut-Dniester area but extends to the broader East-Carpathian region, where similar chronological challenges persist (Bichir Reference Gh1993, Reference Gh1996; Moshkova Reference Moshkova, Rybakov, Munchaev, Bashilov and Gaydukov1989, Reference Moshkova, Davis-Kimball, Bashilov and Yablonsky1995; Symonenko Reference Symonenko1993).
Methodology
This study employs a multidisciplinary methodological framework to refine the chronology of the Sarmatian culture in the Prut–Dniester region during the Roman Imperial Period. The approach integrates traditional typological dating with radiocarbon (14C) analysis and Bayesian statistical modeling, offering a robust reevaluation of temporal frameworks associated with this cultural horizon.
The research began with a typological analysis of grave goods, which provided initial relative dating markers rooted in established archaeological classifications. The 11 samples selected for radiocarbon dating were chosen based on their secure archaeological contexts and unambiguous attribution to the Sarmatian cultural tradition. These included nine inhumation graves from tumuli and two from a flat-ground necropolis, all situated in the eastern Carpathian cultural landscape. The sampled contexts were characterized by stylistically homogeneous material culture, reinforcing their suitability for high-precision radiocarbon analysis.
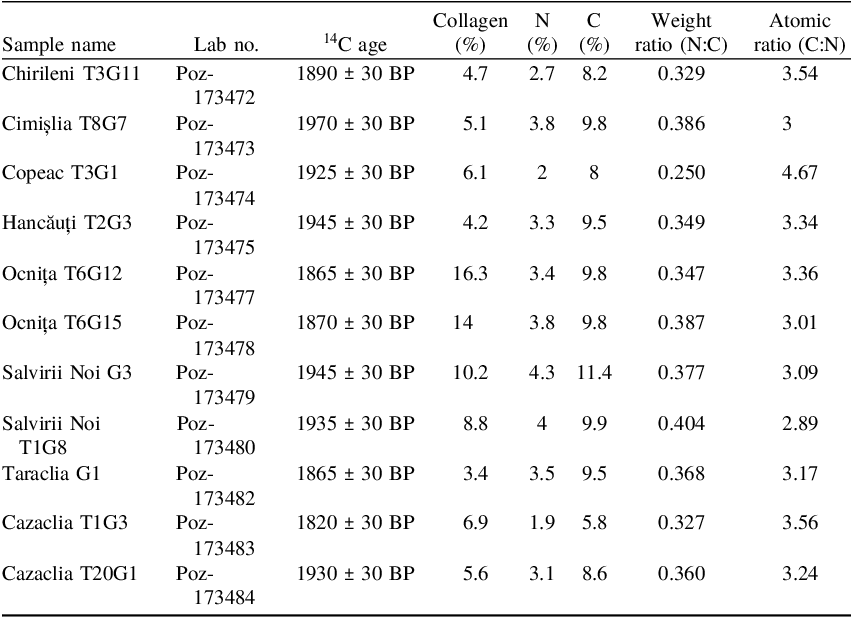
The methodological protocol included a comprehensive evaluation of collagen preservation to confirm the reliability of the results. Parameters such as collagen yield, carbon-to-nitrogen (C:N) ratio, and elemental composition (carbon and nitrogen content) were assessed (Table 1).
The dataset presented above reflects the atomic nitrogen-to-carbon (N:C) ratios in human bone collagen from a selection of archaeological contexts in Republic of Moldova. These values are pivotal in assessing collagen preservation and, by extension, the reliability of isotopic data for paleodietary and chronological analysis. A commonly accepted threshold for well-preserved collagen is an N:C atomic ratio between 0.29 and 0.44 (DeNiro Reference DeNiro1985). All the samples analyzed—except for Copceac T3G1, which falls below the minimum at 0.250—meet this criterion, indicating overall good collagen preservation. This reinforces the interpretive value of isotopic results from these samples. Of note is Șalvii Noi/Palanca T1G8, with N:C ratios exceeding 0.400, suggesting especially well-preserved sample, potentially reflecting good burial conditions or prompt post-mortem treatment. In contrast, Cazaclia T1G3 and Chirileni T3G11, while still within acceptable limits, hover near the lower bound and may merit cautious interpretation.

Table 1 Long description
The table presents data on collagen preservation in human bone samples from various archaeological sites in Republic of Moldova. It includes columns for sample name, lab number, radiocarbon age, collagen percentage, nitrogen percentage, carbon percentage, weight ratio of nitrogen to carbon, and atomic ratio of carbon to nitrogen. The table has twelve rows, each representing a different sample. Notable trends include the overall good collagen preservation, with most samples meeting the accepted threshold for well-preserved collagen, except for Copceac T3G1. Samples like Salvirii Noi T1G8 show especially well-preserved collagen, while Cazaclia T1G3 and Chirileni T3G11 are near the lower bound of acceptable limits.
While elevated collagen yields in ancient samples may suggest minor diagenetic alterations (e.g., exogenous organic contamination), this interpretation is mitigated by the C:N ratio, which in this case falls within the optimal range of 2.9–3.6, thereby confirming the reliability of the collagen (Ambrose Reference Ambrose1990, 431–451).
However, two samples slightly deviate from this range: Copceac T3G1 exhibits a higher C:N value of 4.67—exceeding the upper threshold by 1.07—while the sample from Salvii Noi T1G8 registers a value just 0.01 below the lower limit. Despite these minor deviations, both samples still indicate overall good collagen preservation.
The radiocarbon ages of the analyzed samples range from 1970 ± 30 BP (Cimişlia T8G7) to 1820 ± 30 BP (Cazaclia T1G3), aligning with the established chronological framework of the Sarmatian culture in the Prut-Dniester region. While minor variations are present, these results remain consistent with previous archaeological and chronological assessments (Dzygovskij Reference Dzygovskij2013; Grosu Reference Grosu1990; Symonenko Reference Symonenko, Marchenko, Moshkova, Raev and Raev2004).
To further refine these results, Bayesian statistical modeling was employed using the OxCal platform. This probabilistic approach integrates radiocarbon dates with stratigraphic and typological information, enabling the identification of distinct chronological phases and reducing the uncertainty often inherent in conventional dating methods.
The Bayesian models allowed for a contextual re-evaluation of the data, situating the dated events within broader cultural and chronological frameworks. These were then compared with established Sarmatian periodizations and adjacent Barbaricum sequences. This comparative perspective illuminated patterns of cultural interaction, socio-economic transformation, and regional synchronicity.
The increasing availability of radiocarbon dates, paired with advances in statistical modeling, has transformed chronological research in Southeastern Europe. The creation and continuous expansion of 14C databases have laid the foundation for robust, multi-scalar periodization frameworks, especially relevant to cultures such as the Sarmatians, where typological dating alone has often proven insufficient.
The present research has enabled a series of radiocarbon dating analyses on materials retrieved from well-defined archaeological contexts. The accuracy of these dates is often subject to discussion, particularly regarding discrepancies between human and animal bone samples and the potential reservoir effects resulting from dietary variations (Higham et al. Reference Higham, Warren, Belinskij, Härke and Wood2010, 653–670).
The methodological approach included a thorough assessment of collagen preservation parameters to ensure the reliability of the results. Collagen yield, C:N ratio, and other indicators were meticulously examined (see Table 1), as these factors are crucial in evaluating sample integrity and potential diagenetic alterations. This rigorous quality control enhances the accuracy and reliability of the obtained radiocarbon dates, thereby contributing to a more refined chronological framework for the studied period (Higham et al. Reference Higham, Ramsey, Karavanić, Smith and Trinkaus2006, 553–557).
The radiocarbon dating of samples listed in Table 1 was conducted using accelerator mass spectrometry (AMS), a method renowned for its high precision in dating archaeological materials. The results, expressed in radiocarbon years before present (BP), show a narrow range of dating errors (±30 BP), underscoring reliability. This methodology has been successfully applied to Stone Age contexts (Cook et al. 2001, 453–460), reinforcing its robustness in archaeological research.
By combining traditional, and modern scientific dating methods, this study constructs a refined and scientifically validated chronology for the Sarmatian presence in the Prut-Dniester interfluve. Beyond improving periodization, this approach offers new insights into settlement dynamics, funerary practices, and intercultural exchanges during the Roman Imperial Period. The integration of traditional archaeological knowledge with advanced radiometric techniques underscores the value of interdisciplinary research in addressing long-standing chronological uncertainties in the archaeology of Southeastern Europe.
A brief note on the periodization of Sarmatian culture in the Prut-Dniester area
The periodization of Sarmatian culture in the North Pontic region has been a topic of extensive scholarly debate. For the Prut-Dniester area, this study adopts a nuanced framework that reflects local adaptations and archaeological findings. The proposed chronology is divided into three primary phases:
-
Early Sarmatian Period: late 1st century BC–first half of the 1st century AD
-
Middle Sarmatian Period: second half of the 1st century–first half of the 2nd century AD
-
Late Sarmatian Period: second half of the 2nd century–4th century AD
The Late Sarmatian period is further subdivided into early and late sub-phases, reflecting detailed chronological refinements.
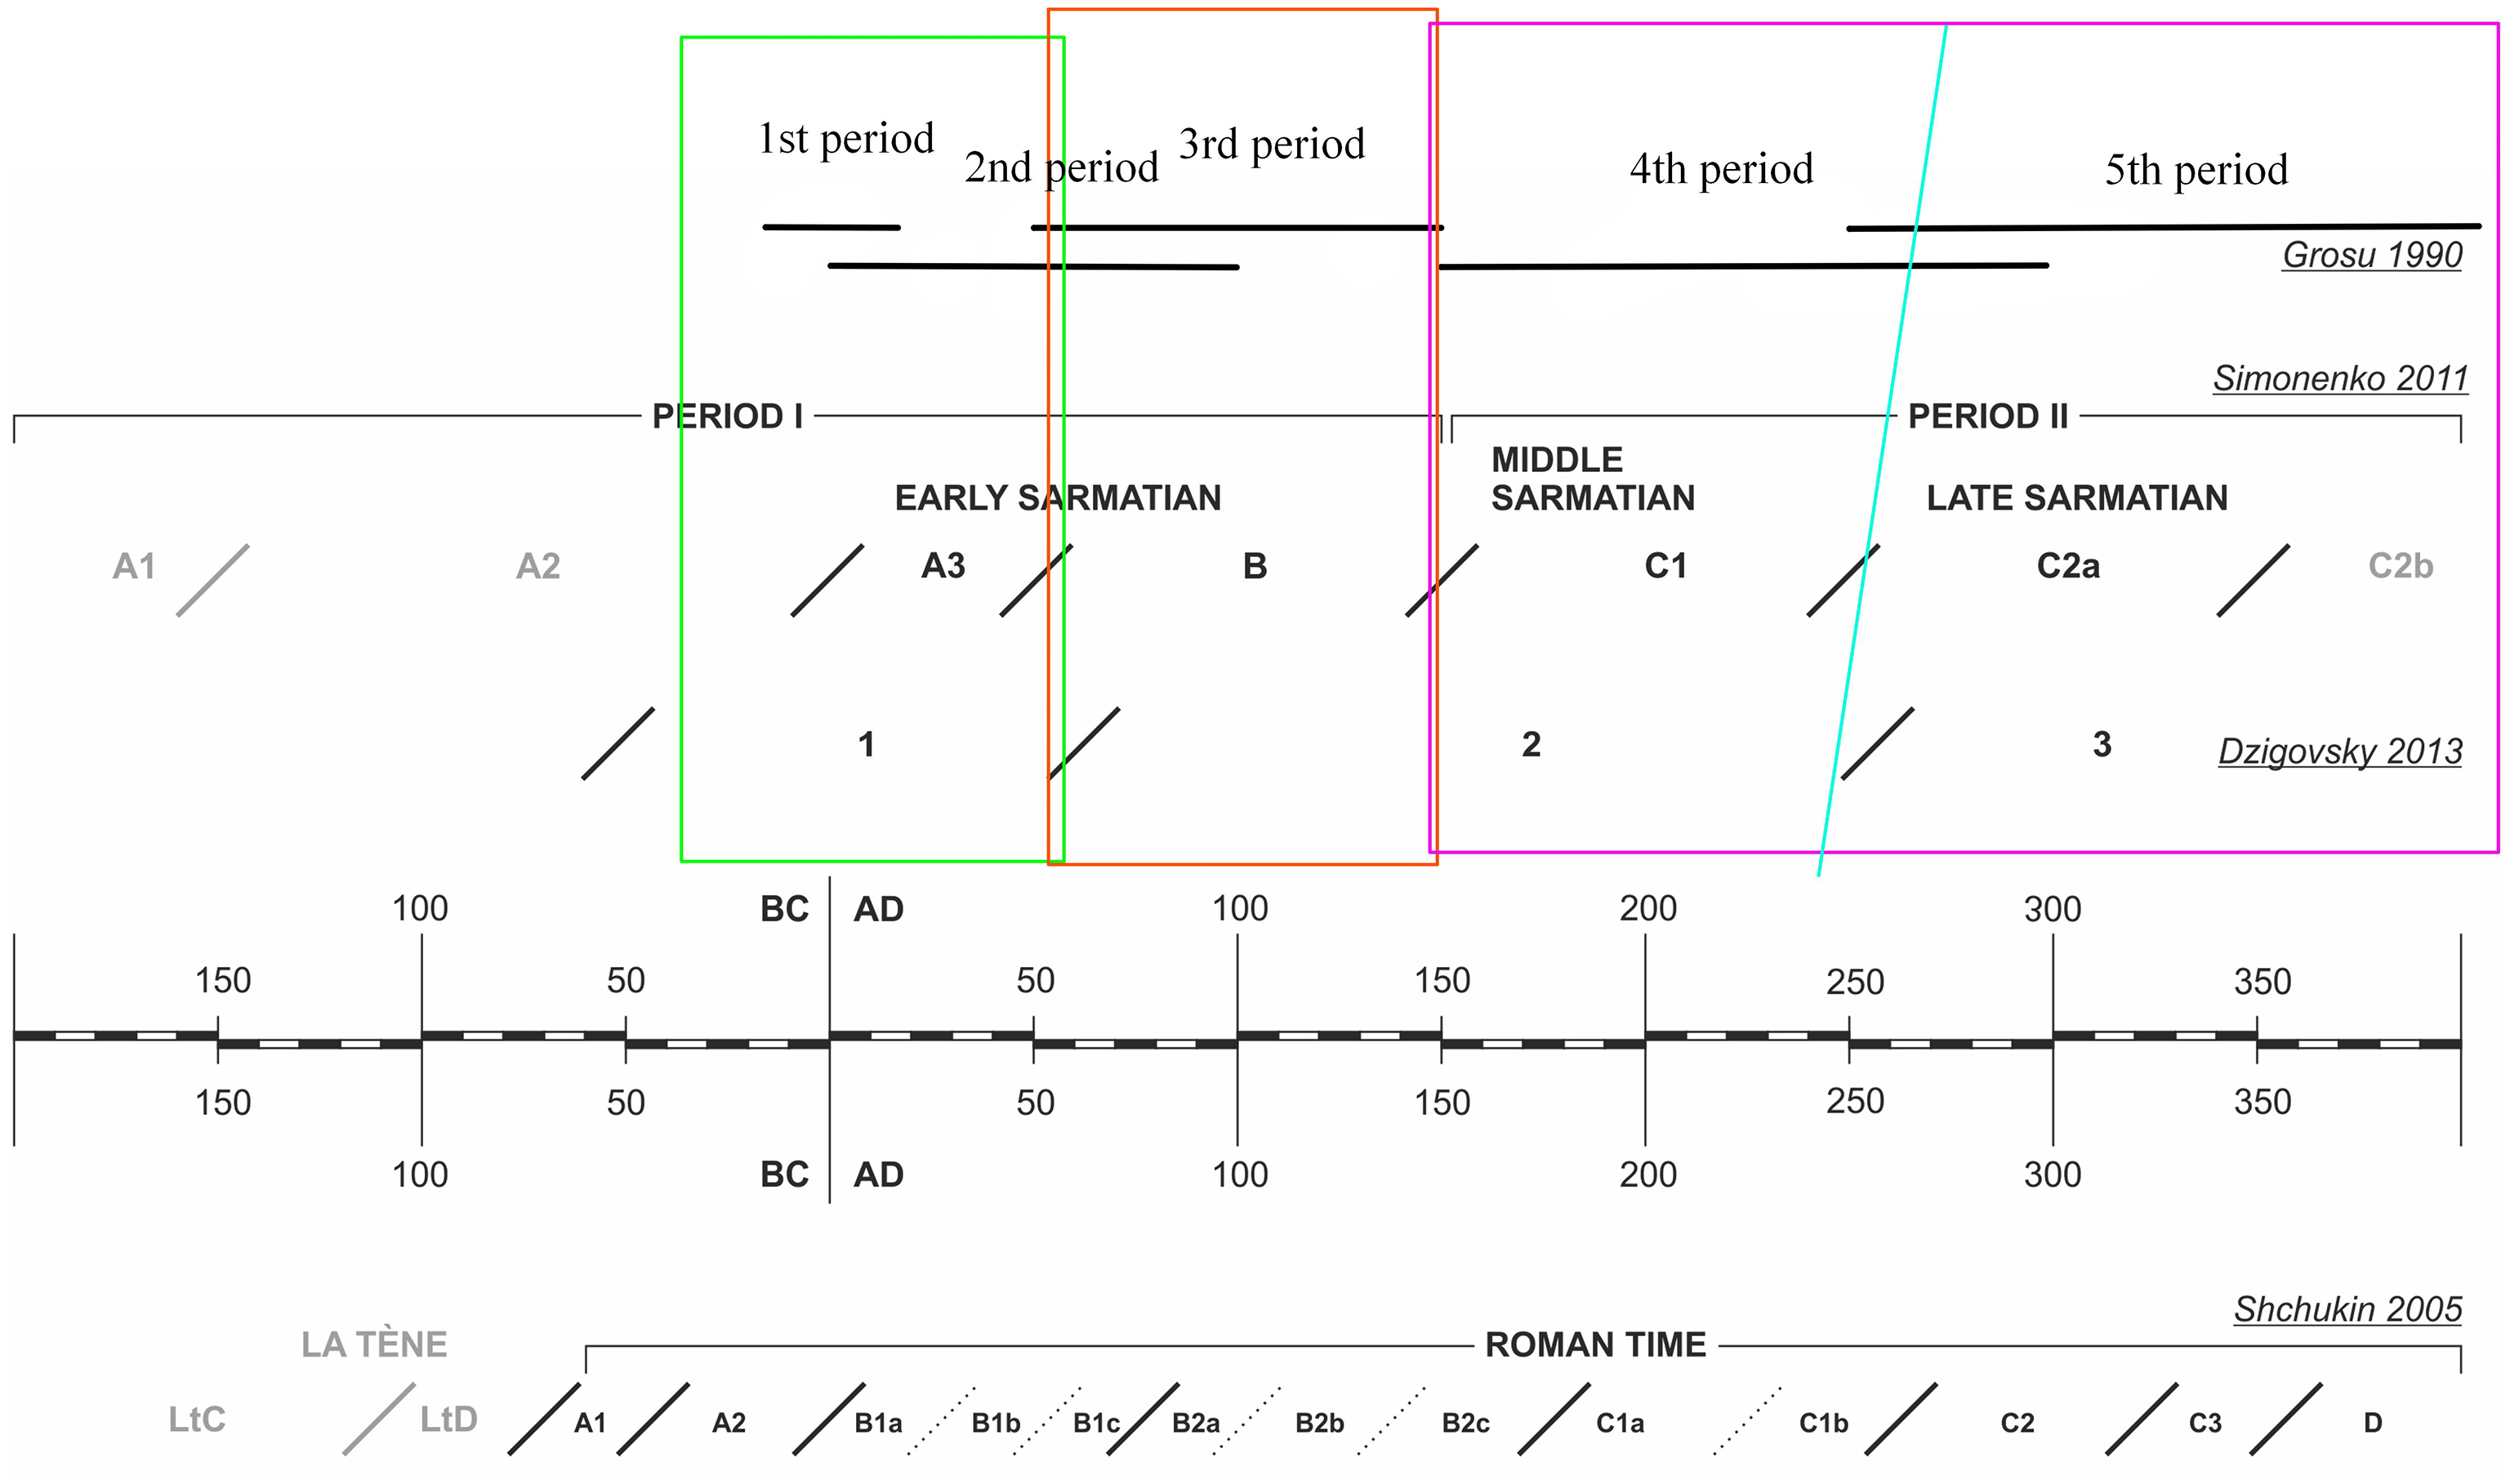
The periodizations proposed by V. Grosu (Reference Grosu1990), A. Symonenko (Reference Symonenko, Marchenko, Moshkova, Raev and Raev2004), and A. Dzygovskij (Reference Dzygovskij2013)—based on archaeological data—exhibit notable correlations (Figure 3). Although differences exist in the number of subdivisions, these chronological frameworks converge on the major temporal boundaries of the Sarmatian culture in the Prut-Dniester region. For instance:
-
The Early Sarmatian Period corresponds to the first two periods in Grosu’s system and overlaps with the late A2 and A3 phases in Symonenko’s framework.
-
Grosu’s third period aligns with Symonenko’s phase B and is associated with the Middle Sarmatian Period.
-
The Late Sarmatian Period corresponds to Grosu’s fourth and fifth periods and Symonenko’s phase C, which is further divided into sub-phases C2a and C2b.
Chronological periodization of Sarmatian culture and Roman time, by different authors and their correlations (after Topal and Batog).

Figure 3 Long description
The timeline illustrates the periodization of Sarmatian culture and Roman time as proposed by various authors. It spans from 150 BC to 350 AD, divided into five periods. The first period includes Early Sarmatian phases A3 and B, while the second period covers Early Sarmatian phase B. The third period encompasses Middle Sarmatian phase C1, the fourth period includes Late Sarmatian phase C2a, and the fifth period features Late Sarmatian phase C2b. The timeline also correlates these periods with La Tène and Roman time, marked by phases A1, A2, B1a, B1b, B1c, B2a, B2b, B2c, C1a, C1b, C2, C3, and D. Different authors' interpretations are highlighted with distinct color-coded boxes and labels.
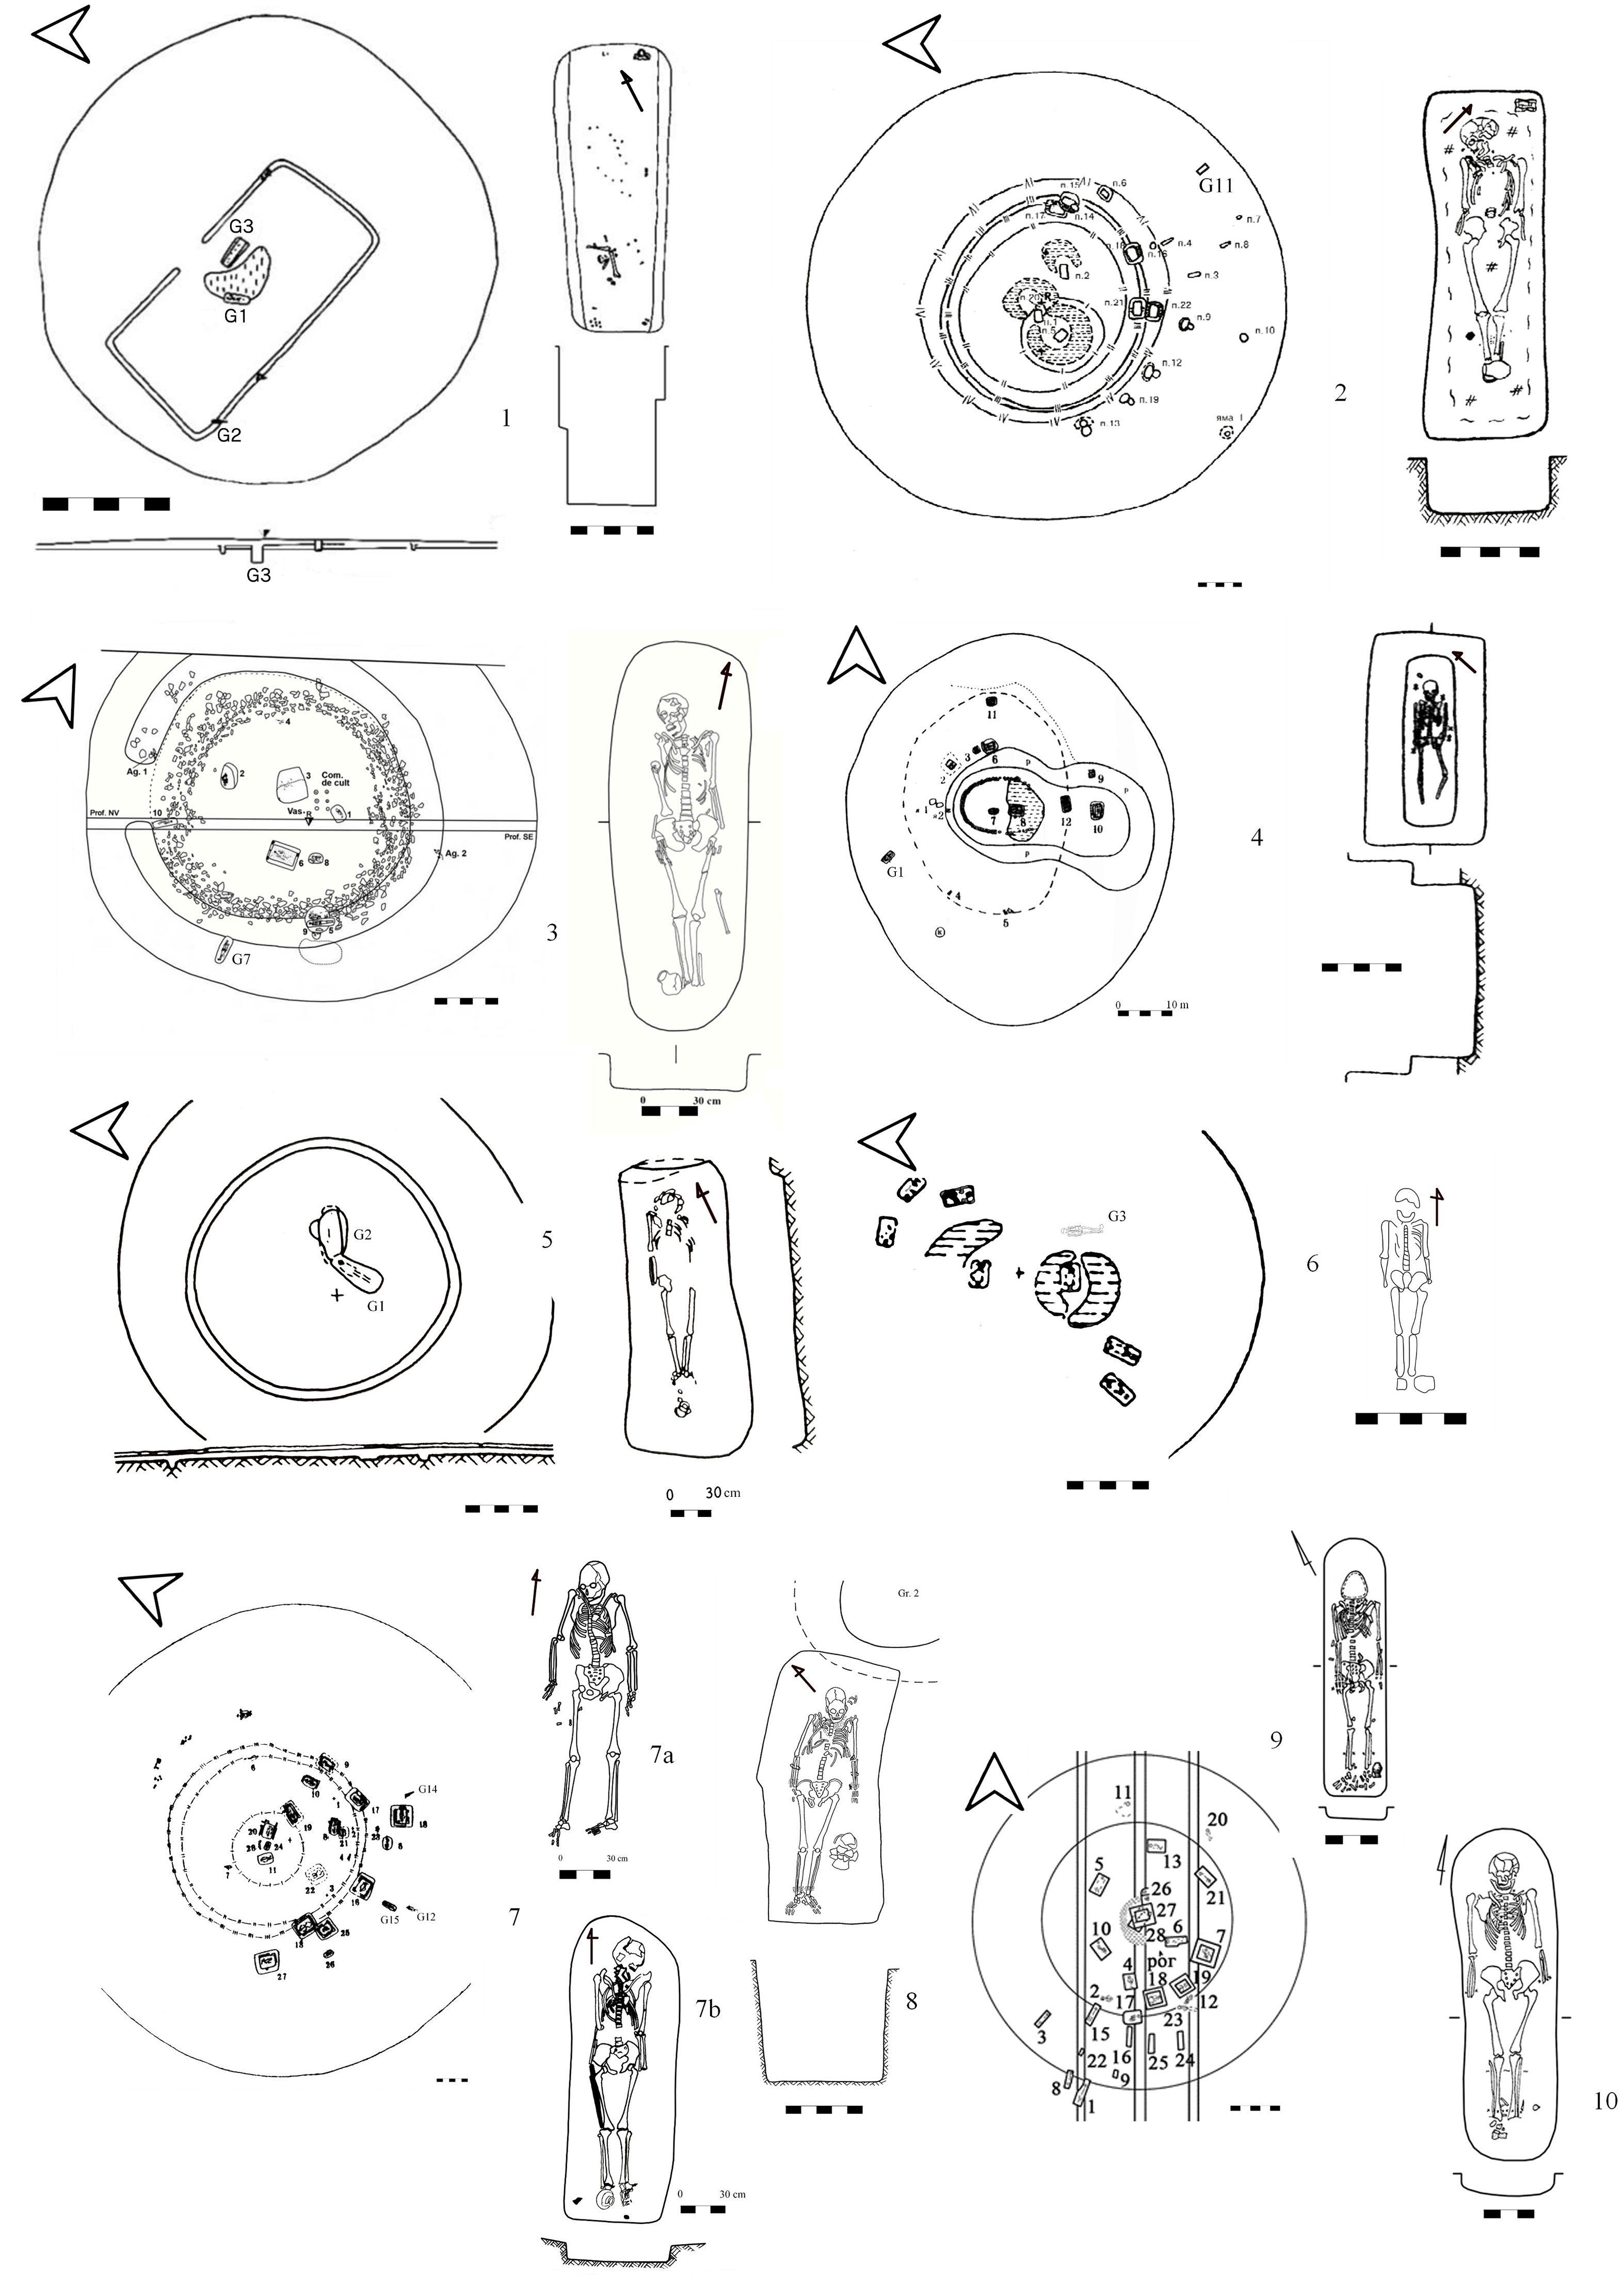
Plan of the barrows and graves: 1. Cazaclia T1G3 (after Agul’nikov, Kurchatov Reference Agul’nikov and Kurchatov2013); 2. Chirileni T3G11 (after Abyzova, Klochko Reference Abyzova and Klochko2005); 3. Cimișlia T8G7 (after Popovici and Ciobanu Reference Popovici and Ciobanu2021); 4. Copceac T3G1 (after Bejlekchi Reference Bejlekchi1990); 5. Cazaclia T20G1 (after Sava et al. 2019); 6. Hancăuți T2G3 (after Dergachev Reference Dergachev1982); 7. Ocnița T6G12 and Ocnița T6G15 (after Manzura and Klochko 1989); 8. Taraclia Gaidabul G1 (after Sava et al. Reference Sava, Kaiser, Sîrbu, Mistreanu, Bubulici and Sîrbu2020); 9. Șalvirii Noi/Palanca T1G8 and G3 (after Kurchatov Reference Kurchatov1991).

Figure 4 Long description
The image presents a detailed diagram of cross-sectional views of various barrows and graves, each labeled with specific identifiers. The sections include Cazaclia T1G3, Chirileni T3G11, Cimilia T8G7, Copceac T3G1, Cazaclia T20G1, Hancui T2G3, Ocnia T6G12 and Ocnia T6G15, Taraclia Gaidabul G1, and alvirii Noi/Palanca T1G8 and G3. Each cross-section shows the internal structure and layout of the graves, with various labeled parts indicating different features and components. The diagram includes annotations and arrows pointing to specific areas, providing a clear and detailed representation of the archaeological findings.
Figure 2 synthesizes these chronological systems and situates them within the broader European framework for Eastern Europe developed by Shchukin (Reference Shchukin2005). This comparative analysis provides a cohesive framework for understanding the Sarmatian culture in the Prut-Dniester region.
Funerary rite and ritual
To better characterize the graves of this culture, we analyzed them based on these chronological divisions. The studied sites predominantly fit into the last two periods—the Middle Sarmatian period, spanning the 1st century to the first half of the 2nd century AD. Examples include the following graves:
-
Cazaclia T20G1 (Figure 3/5)—published by S. Agul’nikov, S. Kurchatov (Reference Agul’nikov and Kurchatov2013).
-
Cimișlia T8G7 (Figure 3/3)—published by S. Popovici, I. Ciobanu (Reference Popovici and Ciobanu2021)
-
Copceac T3G1 (Figure 3/4)—published by V. Bejlekchi (Reference Bejlekchi1990)
-
Hancăuți T2G3 (Figure 3/6)—published by V. Dergachev (Reference Dergachev1982)
-
Șalvirii Noi/Palanca T1G8 (Figure 3/9)—unpublished report by S. Kurchatov (Reference Kurchatov1991) (see Annex 1)
-
Șalvirii Noi/Palanca G3 (Figure 3/10)—unpublished report by S. Kurchatov (Reference Kurchatov1991) (see Annex 2)
From this period onward, Sarmatian funerary discoveries in the Prut-Dniester region become more numerous. These graves are usually secondary, found in older tumuli, particularly those from the Bronze Age, though they also appear in barrows from other periods. An interesting example is the grave at Cazaclia T20G1, placed in a Scythian mound, a relatively “rare practice.” It is assumed that the bearers of Sarmatian culture recognized Scythian tumuli due to their relative chronological proximity, generally avoiding burials in these, favoring instead those from the Yamnaya culture. However, a few exceptions are known, such as in Alcalia T19G2 (Subbotin and Dzigovskij Reference Subbotin and Dzigovskij1990, 10–11); Lencăuți/Lencovcy T1 (Melyukova Reference Melyukova1953, 65–66); Hlinaia T12G1 (Symonenko Reference Symonenko2019, 173–178) etc. A possible explanation for this particular case could be that the tumulus in Cazaclia no longer displayed defining Scythian features. Reflections by V. Bârcă and O. Symonenko (Reference Bârcă and Symonenko2009, 99) suggest that this choice might also be attributed to the greater abundance of Bronze Age tumuli in the region.
Regarding location, according to V. Bârcă and O. Symonenko (Reference Bârcă and Symonenko2009, 99), Sarmatian graves are often placed in the center or northern section of the tumulus. However, in the case of our sites, two graves (Cimișlia T8G7 and Hancăuți T2G3) are in the southeastern sector, the grave at Șalvirii Noi/Palanca T1G8 is in the southwestern sector, the grave at Cazaclia T20G1 is centrally located, and the one at Copceac T3G1 is in the west-southwest. The absence of a northern location in these examples may indicate an overgeneralization in the literature, as both V. Dergachev (Reference Dergachev1982, 132–133) and V. Grosu (Reference Grosu1995, 27–28) observed that southern placement was common. The motivation to occupy a central position within the tumulus could be associated with a prestigious placement, while other locations may have been chosen as a precaution to avoid desecration.
Regarding grave 3 from Șalvirii Noi/Palanca, it is important to highlight that this represents a particularly significant case, given the limited number of ground necropolises attributed to the Middle Sarmatian period. Notable examples include those at Seliște (Rafalovich and Lapushnyan Reference Rafalovich, Lapushnyan, Lapushnyan, Markevich and Rafalovich1974, 110–147) and Medeleni (Vornic et al. Reference Vornic, Bubulici and Popovici2015, 59–72). Their scarcity makes them of particular interest, as none of the currently known sites exhibit the specific layout as the later-period cemeteries, which are typically arranged in rows, such as Krinichnoe (Fyodorov Reference Fyodorov1969, 248), Brînzeni (Grosu Reference Grosu1985, 129), Bocani (Fyodorov 1956, 49; Reference Fyodorov1960), Bădragii Noi, a military necropolis (Kurchatov et al. Reference Kurchatov, Simonenko and Chirkov1995, 116–117), and Taraclia Gaidabul (Sava et al. Reference Sava, Kaiser, Sîrbu, Mistreanu, Bubulici and Sîrbu2020), among others.
In the case of grave 3 at Șalvirii Noi/Palanca, the burial is part of a group but lacks a uniform orientation—all burials are directed northward but with slight deviations to the east and west. Additionally, a nearby earth ditch has been identified, which is likely associated with the ground necropolis at Șalvirii Noi/Palanca. The closest known parallel to this context is the Medeleni ground cemetery, dated to the same period (late 1st–first half of the 2nd century AD). This site features a square ditch structure near the burial area, as well as a ritual pit found within its perimeter, offering a compelling comparison to the layout and characteristics observed at Șalvirii Noi/Palanca.
The typology of graves from this period is diverse, with a predominance of simple rectangular pits. Examples of such burials include the graves from Șalvirii Noi/Palanca (T1G8 and G3). Additionally, there are graves with pits that feature side ledges, such as the Copceac T3G1 grave, which is characterized by a rectangular shape with ledges along the entire perimeter—an unusual feature in the northern Pontic region during this period (Bârcă and Symonenko Reference Bârcă and Symonenko2009, 102). Other grave forms, such as oval pits (Cimișlia T8G7) or trapezoidal pits (Cazaclia T20G1), are often classified together with rectangular ones, as the latter may have rounded corners, making their identification challenging during excavations (Bârcă, Symonenko Reference Bârcă and Symonenko2009, 102–103). In some cases, the pit’s outline is not detectable at all, as observed in the Hancăuți T2G3 burial.
Funerary arrangements are rare due to the poor preservation of the vegetal materials used. However, in the Copceac T3G1 grave, dark traces on and below the skeleton suggest the presence of a vegetal wrapping. Additionally, part of the grave may have been covered with wooden beams, particularly along the ledges, similar to other graves with such architectural features. In the case of Șalvirii Noi/Palanca G3, traces of ash and charcoal were found beneath the tibial bones—a phenomenon encountered in the Iranian cultural sphere. This may represent a ritual practice potentially associated with revisiting the grave after a certain period, with the purpose of purifying the deceased through fire—a custom deeply rooted in the Iranian cultural tradition (Bârcă Reference Bârcă2006, 54; Grosu Reference Grosu1995, 150; Nagimov Reference Nagimov2012, 179; Smirnov Reference Smirnov1964, 96–100).
The orientation and positioning of the deceased remain predominantly northern. Thus, the grave orientations vary: N-S (Hancăuți T2G3), NNW-SSE (Cimișlia T8G7, Șalvirii Noi/Palanca G3), NE-SW (Cazaclia T20G1, Șalvirii Noi/Palanca T1G8), and NNE-SSW (Copceac T3G1). The common position for the deceased is supine, with limbs extended, though variations exist. For example, in the Copceac T3G1 grave, the deceased has slightly bent arms with palms on the pelvis, and the right leg bent at the knee. Similarly, in Cimișlia T8G7, the hands rest on the pelvis, with the legs straight.
The Late Sarmatian period, spanning from the second half of the 2nd century AD to the first half of the 4th century AD, as noted in the description above, is divided into two phases, with the mid-3rd century AD serving as the dividing line. This study focuses on the first phase of this period. The following graves were analyzed in our research:
-
Cazaclia T1G3 (Figure 3/1)—published by E. Sava et al. (Reference Sava, Agul’nikov and Mazura2019)
-
Chirileni T3G11 (Figure 3/2)—published by E. Abyzova and E. Klochko (Reference Abyzova and Klochko2005)
-
Ocnița T6G12 (Figure 3/7, 3/7a)—published by I. Manzura et al. (Reference Manzura, Klochko and Savva1992)
-
Ocnița T6G15 (Figure 3/7, 3/7b)—published by I. Manzura et al. (Reference Manzura, Klochko and Savva1992)
-
Taraclia Gaidabul G1 (Figure 3/8)—unpublished report by E. Sava et al. (Reference Sava, Kaiser, Sîrbu, Mistreanu, Bubulici and Sîrbu2020) (see Annex 3)
This phase of the late Sarmatian culture marks a renewed increase in the number of funerary discoveries in the Prut-Dniester region. Principal graves within tumuli become increasingly common, with a notable example in this study being Cazaclia T1G3. At the same time, the practice of burying in older tumuli remains active (examples: Chirileni T3G11, Ocnița T6G12, and T6G15), and the number of ground cemeteries grows significantly. The cemetery at Taraclia Gaidabul G1, included in our study, is one such example.
The placement of graves within older tumuli remains similar to that in previous periods, with a predominance in the center, northern sector, and increasingly in the southern sector. For instance, the Chirileni T3G11 grave is located in the central-western sector, while the Ocnița T6G12 and T6G15 graves are in the southern sector of the tumulus. In Sarmatian culture barrows, graves are typically placed centrally, as seen in Cazaclia T1G3, though there are exceptions, such as the grave at Cazaclia T10G1 (Sava et al. Reference Sava, Agul’nikov and Mazura2019, 321), which is located in the northern sector of the tumuli. In other cases, such as at Mirnoe, Kalanceak (Gudkova and Fokeev Reference Gudkova and Fokeev1984, 50), and Taraclia T13G1 (Sava et al. Reference Sava, Agul’nikov and Mazura2019, 259), graves were found in various sectors of the tumuli, suggesting a possible intent to avoid grave desecration, an observation supported by researchers A. Gudkova and M. Fokeev (Reference Gudkova and Fokeev1984, 50).
Ground cemeteries exhibit a funerary inventory similar to that of the tumulus graves when associated with the same social group; however, primary tumulus graves are sometimes linked to elites, whereas this is less common in ground graves. Additionally, ground cemeteries tend to be organized more regularly, as observed at Bocani (Fyodorov Reference Fyodorov1956, Reference Fyodorov1960), Brînzeni (Grosu Reference Grosu1985), and Krinichnoe (Fyodorov Reference Fyodorov1969). Unfortunately, we lack sufficient information to determine whether the Taraclia Gaidabul cemetery follows such an arrangement, as only three graves have been excavated; nevertheless, all three graves are oriented in the same direction, with two aligned in a row.
Graves from this period are typically simple rectangular pits. Exceptions appear in the second phase of the late period, where catacombs become predominant in burial typology. In this study, Taraclia Gaidabul G1 displays a rectangular pit with slightly rounded corners and curved long sides. Ocnița T6G15 is characterized by a rectangular pit with sharply rounded corners and side ledges, a type that is the second most common after simple pits. The grave at Chirileni T3G11 has a trapezoidal shape, which is less commonly encountered, while at Ocnița T6G12, the outline of the pit could not be discerned.
Dimensions typically range from 1.8 × 2.3 m in length to 0.6 × 1 m in width, with smaller graves generally believed to be children’s burials. Large-sized pits, such as that at Cazaclia T1G3, which has a trapezoidal shape (3.55 m long, 1.45 × 1.10 m in width, and 1.95 m deep), are frequently associated with elites, exhibiting a complex construction and valuable grave goods. Such graves are also known in other areas, such as Cioburciu T1G1 (Fidelskij Reference Fidelskij2004, 272–277), Dzinilor T5G1 (Gudkova and Fokeev Reference Gudkova and Fokeev1984, 35–36), and Ursoaia T4G1 (Kurchatov Reference Kurchatov2015, 108–116), and are thought to belong to elite members of Sarmatian society.
The northern orientation of graves remains consistent in this period: the graves at Cazaclia T1G3 and Taraclia Gaidabul G1 are oriented NE-SW, the grave at Chirileni T3G11 is NW-SE, and those at Ocnița T6G12 and T6G15 are N-S. This reflects a Sarmatian preference for northern orientation, with slight variations toward the east or west.
Though ritual details are sparse, chalk, a feature used primarily in earlier periods, appears in the grave at Chirileni T3G11 along with charcoal, likely linked to body purification. White was considered a symbol of purity, often associated with the ritual cleansing of the body (Bârcă, Symonenko Reference Bârcă and Symonenko2009, 45).
For ledged graves, it’s likely these ledges were covered with wooden beams that have not survived, as seen at Cazaclia T1G3 and Ocnița T6G15. In both Cazaclia T1G3 and Taraclia Gaidabul G1, traces of gray organic matter, possibly bedding, were observed on the floor of the chamber. At Chirileni T3G11, beneath the skeleton, there was a layer of chernozem and clay, and a small fragment of decomposed wood was found in the northwest corner of the chamber. Charcoal was also noted in the graves at Chirileni T3G11 and Cazaclia T1G3, which some authors interpret as part of a purification ritual through fire—a practice characteristic of the Iranian cultural sphere (Bârcă Reference Bârcă2006, 54; Grosu 1990, 34–35; Reference Grosu1995, 150; Nagimov Reference Nagimov2012, 179; Smirnov Reference Smirnov1964, 94–95).
Another notable feature of funerary rituals in Sarmatian culture is the disturbance of skeletons, as observed in the grave at Cazaclia T1G3. This phenomenon, as previously suggested, may represent a ritualistic practice potentially linked to revisiting the grave after a certain period, with the purpose of purifying the deceased through fire—a custom rooted in the Iranian cultural sphere (Bârcă Reference Bârcă2006, 54; Grosu Reference Grosu1995, 150; Nagimov Reference Nagimov2012, 179; Smirnov Reference Smirnov1964, 96–100). Alternatively, it may simply indicate grave robbery (Grosu Reference Grosu1995, 150; Grumeza and Ursuțiu Reference Grumeza and Ursuțiu2016, 285).
As highlighted in the literature, this topic remains widely debated, with compelling arguments supporting both interpretations. In our opinion, these two scenarios are not mutually exclusive. Specifically, if the disturbance of the skeleton is accompanied by dislocated grave goods and traces of charcoal, we may support the hypothesis of a purification ritual. Conversely, if neither grave goods nor traces of charcoal are present, and the bones are scattered at varying depths, grave robbery appears more likely.
This nuanced analysis of the archaeological context provides a better understanding of the motivations and cultural practices underlying skeletal disturbances in Sarmatian culture burials. In the case of the Cazaclia T1G3 grave, the presence of grave goods, wood charcoal, and ash strongly suggests a ritualistic practice. If the skeletal disturbance is accompanied by the retention of archaeological goods and traces of charcoal within the grave, the hypothesis of a purification ritual holds merit. Conversely, if neither artifacts nor charcoal traces are present, and bones are scattered at various depths, it likely suggests grave desecration. Therefore, a differentiated analysis of context provides a clearer understanding of the reasons behind these disturbances in Sarmatian culture graves. In the case of Cazaclia T1G3, the presence of artifacts, charcoal, and ash encourages the interpretation that this was a ritual practice rather than desecration.
Another significant element in Sarmatian funerary rites during this period is the presence of funerary ditches around or near the graves. These constructions display a range of shapes, including square, circular, rectangular, and trapezoidal forms. Rectangular, square, and trapezoidal ditches are seen as chronological markers of the early phase of the Late Sarmatian culture, dating to the latter half of the 2nd century and the beginning of the 3rd century AD, while circular ditches continue to appear until the early 4th century (Bârcă Reference Bârcă2020, 341; Bârcă and Symonenko Reference Bârcă and Symonenko2009, 217; Symonenko 2003, 151; 2004, 158; Reference Symonenko2011, 171). For example, the grave at Cazaclia T1G3 was surrounded by a rectangular ditch, and this suggests that it was made in the early phase of the Late Sarmatian period.
The genesis of these structures has been a subject of extensive debate, with a general consensus pointing to an eastern origin. Some of the earliest documented examples of their use by Sarmatian tribes have been identified at the Chertovitski II and Pisarevka necropolises (situated to the left of the Middle Don), and the number of such discoveries continues to grow (Bârcă Reference Bârcă2020, 341; Medvedev Reference Medvedev1990, 71–72, 95–96; Symonenko Reference Symonenko, Baran, Pachkova, Abaiilina and Baran2003, 154).
In the ditch at Cazaclia T1G3, fragments of Roman amphorae were found in the northeast and southeast sections, similar to the ceramic fragments found in other sites such as Petrești (Kurchatov and Bubulich Reference Kurchatov and Bubulich2023, 139), Bădragii Noi (Kurchatov et al. Reference Kurchatov, Simonenko and Chirkov1995, 113), and Corpaci (Grosu Reference Grosu1979, 250–255). According to V. Grosu and others, these findings may represent remnants of funerary banquets.
Comparative-typological analysis of complexes according to chronological range
To verify the obtained chronological range a detailed comparative-typological analysis of the main inventory categories was conducted to establish their period of use. However, it should be noted that the “effective use” period of an object may not coincide with the moment it was deposited in an assemblage.
Cazaclia T1G3
Before proceeding to the typological analysis of the material from this burial, I will draw attention to a few additional chronological indicators. Firstly, during the Late Sarmatian period, the number of principal tumulus constructions among Sarmatian populations increased; secondly, the presence of a rectangular structure is characteristic of the first phase of the Late Sarmatian period as we noted above, as well as the presence of amphora fragments within the fill. These fragments resemble an amphora (Figure 5/A/2)—according to S. Vnukov’s typology, this belongs to the later C-IVB variant, used from the last quarter of the 1st century to the mid-2nd century AD (2003, 125; 2006, 167). The pink amphora (Figure 5/A/1) belongs to the C-IVC variant, dated to the second quarter of the 2nd century AD (2006, 124, 166–167). A similar amphora fragment, like the one in the construction fill, was also discovered within the grave (Figure 5/A/10). Similar amphorae have been discovered at Petrești, in trench no. 18 of the necropolis (Kurchatov and Bubulich Reference Kurchatov and Bubulich2023, 34, Figure 16), dated to the Late Sarmatian period, and at Corpaci (Grosu Reference Grosu1979, 253). Regarding their origin, V. Grosu (Reference Grosu1979, 253) suggested that they were usually transported by boat from ancient centers along the Black Sea. The upper part of the amphora (Figure 5/A/16) appears to be an imitation of the Shelov C type, dated to the second half of the 2nd century to the first half of the 3rd century AD (Reference Shelov1978, 18). S. Agul’nikov and S. Kurchatov (Reference Agul’nikov and Kurchatov2013, 178) observed ribbing on this type of amphora, arguing that these suggest a later dating for the burial, beginning in the 2nd century and becoming more typical of the 3rd century AD.
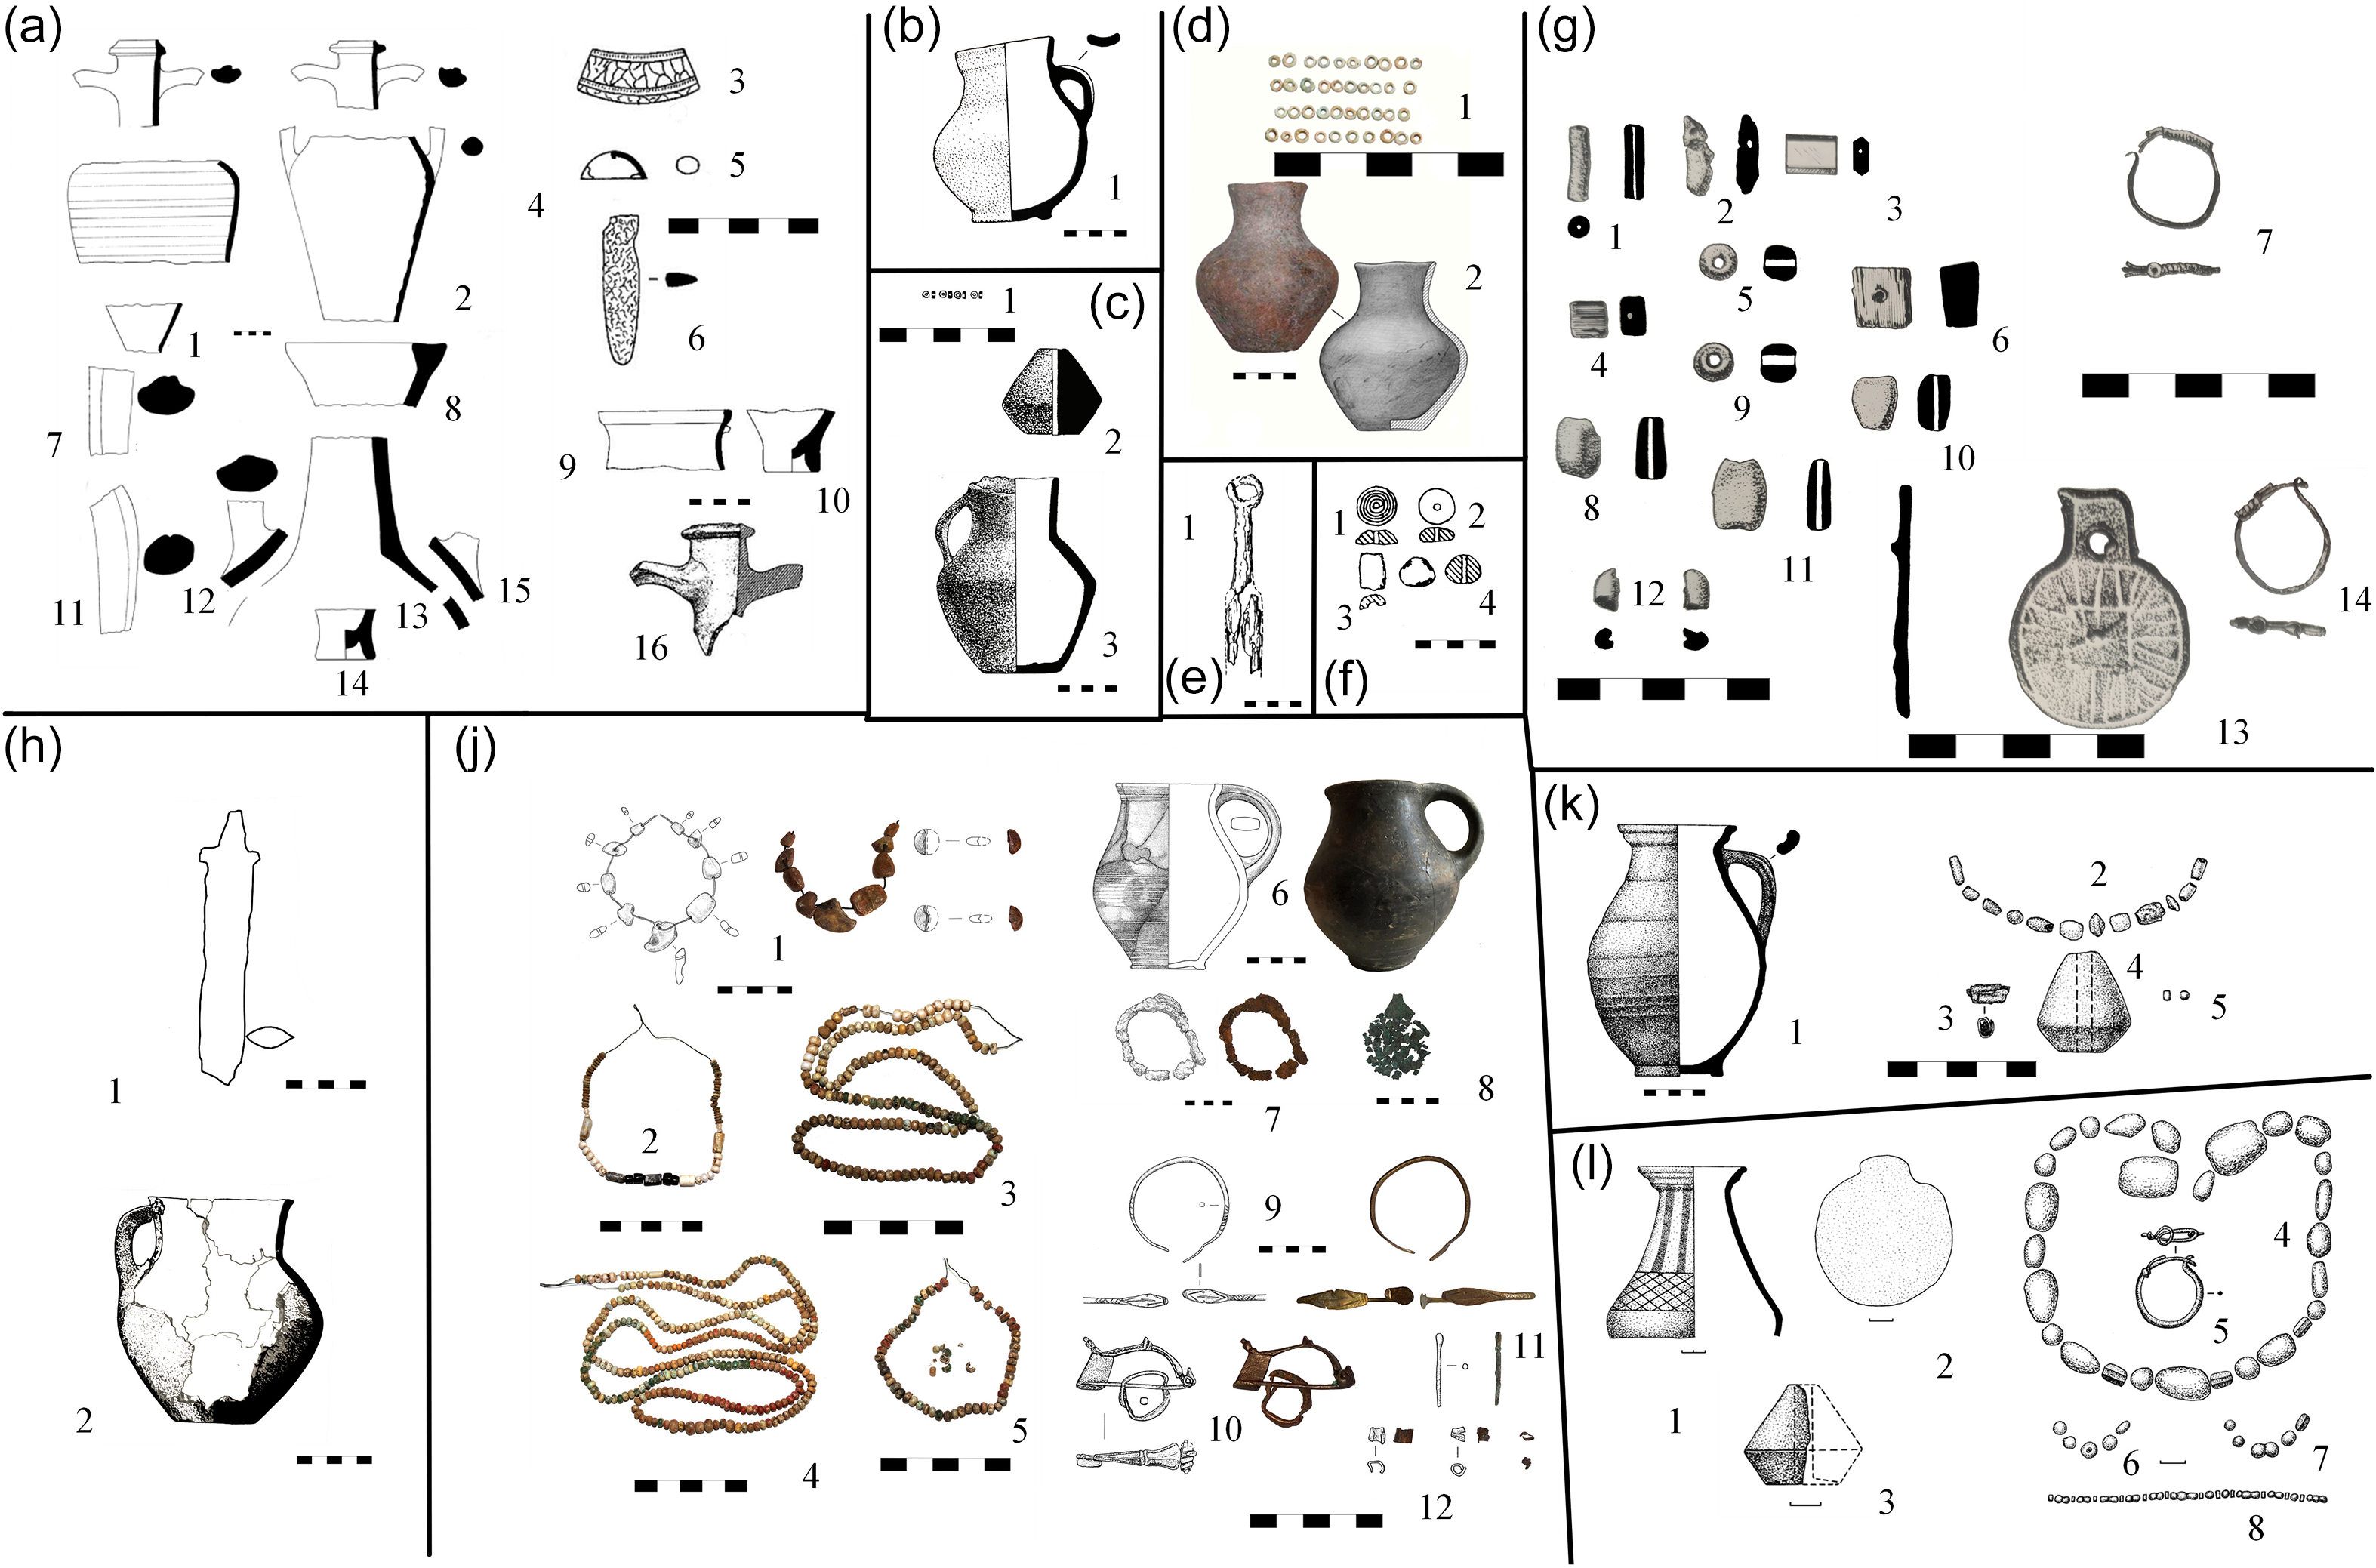
Grave goods: A. Cazaclia T1G3 (after Agul’nikov and Kurchatov Reference Agul’nikov and Kurchatov2013); B. Cazaclia T20G1 (after Sava et al. Sava et al. Reference Sava, Agul’nikov and Mazura2019); C. Chirileni T3G11 (after Abyzova and Klochko Reference Abyzova and Klochko2005); D. Cimișlia T8G7 (after Popovici and Ciobanu Reference Popovici and Ciobanu2021); E. Copceac T3G1 (after Bejlekchi Reference Bejlekchi1990); F. Hancăuți T2G3 (after Dergachev Reference Dergachev1982); G. Ocnița T6G12 (after Manzura and Klochko 1989); H. Ocnița T6G15 (after Manzura and Klochko 1989); J. Taraclia Gaidabul G1 (after Sava et al. Reference Sava, Kaiser, Sîrbu, Mistreanu, Bubulici and Sîrbu2020); K. Șalvirii Noi/Palanca T1G8 (after Kurchatov Reference Kurchatov1991); L. Șalvirii Noi/Palanca G3 (after Kurchatov Reference Kurchatov1991).

Figure 5 Long description
The illustration presents a detailed collection of archaeological artifacts and grave goods from the Prut-Dniester interfluve region, dating back to the Roman Imperial Period. It includes various items such as pottery vessels, jewelry, and tools, each labeled with specific site and grave references. The artifacts are organized into different sections, each representing findings from distinct archaeological sites like Cazaclia, Chirileni, Cimilia, Copceac, Hancui, Ocnia, Taraclia Gaidabul, and alvirii Noi/Palanca. The items are meticulously arranged to showcase the diversity and richness of the Sarmatian cultural presence in the region.
Regarding the red-glazed jug fragment of terra sigillata (Figure 5/A/9), Agul’nikov and Kurchatov (Reference Agul’nikov and Kurchatov2013, 178) found analogies in Crimea, dated to the 1st–2nd centuries AD, and at the Sovkhoz 10 necropolis, dated to the 2nd century AD. Semispherical plates have been discovered in several Sarmatian graves, including Dzinilor T5G1, Nagornoe T2 and T9, Mirnoe T1, and Kalanceak T1 (Gudkova and Fokeev Reference Gudkova and Fokeev1984, 52), all dated to the 2nd–3rd centuries AD; at Șoldănești G10 (Kurchatov Reference Kurchatov2010, 154, 156), dated to the first half of the 3rd century AD; and at Bădragii Noi—military necropolis G5 (Kurchatov et al. Reference Kurchatov, Simonenko and Chirkov1995, 116–117), dated to the second half of the 2nd century to the first half of the 3rd century AD.
For glass fragments (Figure 5/A/5), we can mention the Obileni T5G1. Gold foils (Figure 5/A/3) are predominantly found in principal burials, such as the Nagornoe T9G1. The rich material described allows for dating this grave to the second half of the 2nd century to the first half of the 3rd century AD. Previously, this grave was dated in two publications: V. Grosu (Reference Grosu1995, 156) dated it to the 2nd century AD, while S. Agul’nikov and S. Kurchatov (Reference Agul’nikov and Kurchatov2013, 175–178) placed it in the third quarter of the 2nd century AD.
Cazaclia T20G1
The small jug (Figure 5/B/1) discovered in this grave has few parallels, but S. Agul’nikov and A. Maljukevich (Reference Agul’nikov and Maljukevich2013, 188) note that these types of vessels date to the second half of the 1st century–first half of the 2nd century AD, referencing the works of Gh. Bichir (Reference Gh1972, 137–186) and V. Grosu (Reference Grosu1990, 48–83) as key sources. Based on this context and the archaeological material, E. Sava, S. Agul’nikov, and I. Manzura (Reference Sava, Agul’nikov and Mazura2019, 156) dated this grave within the 1st-3rd centuries AD, while S. Agul’nikov and A. Maljukevich (Reference Agul’nikov and Maljukevich2013, 185–190) placed it specifically in the 2nd century AD. Given the absence of a precisely datable inventory, we propose that this burial can be assigned to the end of the 1st century–2nd century AD.
Chirileni T3G11
The goods of this grave, consisting of a jug (Figure 5/C/3), a spindle whorl (Figure 5/C/2), and four beads (Figure 5/C/1), include objects with limited chronological potential. The jug found has a parallel in Bădragii Vechi T25G5 (Bârcă and Symonenko Reference Bârcă and Symonenko2009, 124), which is dated to the Middle Sarmatian period. The spindle whorl shows similarities to objects from burials such as Bădragii Vechi T27G1 (Bârcă and Symonenko Reference Bârcă and Symonenko2009, 132), Holmskoe G23 (Gudkova and Fokeev Reference Gudkova and Fokeev1984, 19), and is nearly identical to the one from Petrești T3G3 (Kurchatov and Bubulich Reference Kurchatov and Bubulich2023, 126), with the first dating to the Middle Sarmatian period and the other two to the Late Sarmatian period. The beads appear in other graves from the 1st–3rd centuries AD, such as Chirileni T1G17, T2G5, T2G16, T2G20, T3G7, T4G6 (Abyzova and Klochko Reference Abyzova and Klochko2000, 523; Abyzova and Klochko Reference Abyzova and Klochko2005, 272, 277, 282, 289, 306). In conclusion, based on the inventory, this grave can be dated approximately to the 2nd century AD.
Cimișlia T8G7
The goods of this grave, consisting of 40 beads (Figure 5/D/1) and a pot (Figure 5/D/2), include items with limited dating potential. A similar pot was discovered at Bădragii Vechi T25G1 (Bârcă and Symonenko Reference Bârcă and Symonenko2009, 113), dating to the Middle Sarmatian period. This type of vessel is also found in the Asian Sarmatia region during the same period. The beads fall under types 21, 29, and 31, according to E. Alekseeva’s typology (Alekseeva Reference Alekseeva1978, 65–66), and are dated to the beginning of our era. However, the low quality of photographs, lack of drawings, and the state of preservation of the beads complicate a clearer typological classification. Considering the analytical-typological chronology of the available artifacts, we can date this burial to the 1st century–the first half of the 2nd century AD, thus supporting the dating proposed by colleagues S. Popovici and I. Ciobanu (Reference Popovici and Ciobanu2021, 59–60).
Copceac T8G7
The handle fragment, whether from a sword or dagger (Figure 5/E/1), fits into the typology with a ring-shaped pommel. This type of weapon has been extensively discussed in scholarly literature, being chronologically placed in the second half of the 2nd century BC–first half of the 3rd century AD in the North Pontic region (Khazanov Reference Khazanov1971, 169; Nikolaev Reference Nikolaev2021, 170–174; Sadowskii Reference Sadowskii2012, 389–395; Symonenko 2010, 327; Reference Symonenko2015, 465). However, these weapons are most frequently found in the 1st–2nd centuries AD, though they also appear in later periods, sometimes accompanying simple-handled swords, which become common starting in the 2nd century AD. Initially published by V. Bejlekchi in 1990, this assemblage was dated to the 1st century BC–1st century AD. However, in the area between the Prut and Dniester, such swords or daggers are usually later, so we propose dating the burial to the 1st to 2nd centuries AD. The lack of other elements in the grave, however, suggests a possible extension of the chronological range.
Hancăuți T8G7
The grave goods consist of two spiral hemispherical beads (Figure 5/F/1–2), a spindle whorl (Figure 5/F/4), knife fragments, and a destroyed jar-type pot. According to V. Grosu’s typology (Reference Grosu1990, 154), the two hemispherical beads belong to type B22 and are dated to the second half of the 1st century–2nd century AD. Analogies for these beads exist at Lencăuți/Lencovcy T1G9 (Grosu Reference Grosu1990, 54), a burial consistently dated to the second half of the 1st century–early 2nd century AD, as well as at Chirileni T2G20 (Abyzova and Klochko Reference Abyzova and Klochko2000, 282), which is dated to the late 1st century–2nd century AD by V. Grosu (Reference Grosu1995, 160). The spindle whorl is similar to the one from the Sărăteni T3G10 grave (Leviţki et al. Reference Leviţki, Manzura and Demcenko1996, 41, 90), dated to the 1st–2nd century AD. Based on these observations, we can place the complex temporally in the second half of the 1st century–2nd century AD.
Ocnița T6G12
The inventory of this grave is significant chronologically. The first item analyzed is the silver mirror (Figure 5/G/1) with a geomorphological mark, which belongs to type 9 according to A. Khazanov is dated to the second half of the 2nd century–the first half of the 3rd century AD (Reference Khazanov1963, 58–71). This dating is also supported by A. Symonenko (Reference Symonenko, Marchenko, Moshkova, Raev and Raev2004, 152), as these mirrors are commonly found in Sarmatian cultural assemblages as well as in Carpic ones. Generally, mirrors are made of bronze, and silver examples, like the one in this grave, are a bit rarer.
The silver earrings (Figure 5/G/7, 14) fall under type V/4/A in B. Polit’s typology for Crimean barbarians in the Sarmatian period, with a general date between the 1st–4th centuries AD, though these earrings are most popular in the 2nd–3rd centuries AD (Reference Polit2022, 39–40, 150, 178). In the Pannonian Plain, they are classified as type IIIc and dated similarly to the 2nd–3rd centuries AD, according to L. Grumeza (Reference Grumeza2014, 57). In the Prut-Dniester region, earrings of this type appear in numerous 2nd–3rd century AD burials, such as Bocani G6, G8, G13 (Fyodorov Reference Fyodorov1960, 380), Brînzeni G4 (Grosu Reference Grosu1985, 129–142), Cuconeștii Vechi I G1, G17; Cuconeștii Vechi II G29 (Dergachev Reference Dergachev1982, 85–124), Petrești G12 and G15 (Kurchatov and Bubulich Reference Kurchatov and Bubulich2023, 18–50), etc.
Amber beads (Figure 5/G/8, 10–12) belong to type 4 according to L. Grumeza (Reference Grumeza2014, 103) and are dated to the 2nd–5th centuries AD in Banat. According to Alekseeva’s typology, they are classified as type 44 and dated to the 1st–4th centuries AD (Reference Alekseeva1978). Similar examples exist in numerous sites in the Prut-Dniester interfluve associated with the late Sarmatian period, such as Cuconeștii Vechi I—G5, G16, G29; Cuconeștii Vechi II—G1, G27, G30 (Dergachev Reference Dergachev1982, 85–124); Holmskoe G22 (Gudkova and Fokeev Reference Gudkova and Fokeev1984, 6–57); Seliște G62 and G72 (Rafalovich and Lapushnyan Reference Rafalovich, Lapushnyan, Lapushnyan, Markevich and Rafalovich1974, 116, 121–123); Petrești G10 (Kurchatov and Bubulich Reference Kurchatov and Bubulich2023, 18–50); Cîrnățeni T3G1 (Grosu and Demchenko Reference Grosu and Demchenko1990, 132–136); Taraclia Gaidabul G1, etc. In terms of form, the closest variant to the hexagonal jet bead (Figure 5/G/3) is that of glass, type IV.2.B, according to L. Grumeza (Reference Grumeza2014, 98), dated to the 2nd–3rd centuries AD and extending to the 4th century AD.
Based on the described material, this grave can be dated to the second half of the 2nd century– early 3rd century AD.
Ocnița T6G15
The inventory of this grave is limited but includes a relatively well-dated item. The sword or dagger with a simple hilt (Figure 5/H/1) is characteristic of the Late Sarmatian period, dated by specialists to the 2nd–4th centuries AD (Khazanov Reference Khazanov1971; Bârcă and Symonenko Reference Bârcă and Symonenko2009; Symonenko Reference Symonenko2010, Reference Symonenko2015). In the Prut-Dniester region, this type of weapon finds analogies in Krinichnoe G2 (Fyodorov Reference Fyodorov1969, 248–253), Dumeni T8G6 (Grosu Reference Grosu1988, 79–91), Bocani G1 (Fyodorov Reference Fyodorov1960, 380), Ecaterinovca T2G5 (Grosu Reference Grosu1983, 28–52), among others. Chronologically, such weapons appeared in the 2nd–1st centuries BC in Asia and became common in eastern Ukraine in the 1st–2nd centuries AD, while in the Prut-Dniester region, they date to the late 2nd–early 3rd century AD. The jug (Figure 5/H/2) exhibits similarities with items from the Middle and Late Sarmatian periods. Other elements of the inventory are less relevant for a detailed typological analysis. Thus, based on the sword, this grave can be dated to the second half of the 2nd century–3rd century AD.
Taraclia Gaidabul G1
The grave stands out due to its rich funerary inventory. The analysis begins with a highly profiled fibula with an internal loop (Figure 5/J/10). This fibula belongs to type 84 in O. Almgren’s classification (Reference Almgren1923, 34–47), and according to A. Ambroz’s typology falls within subgroup 2 of group 10, dated to the 2nd century–early 3rd century AD (Reference Ambroz1966, 36–40). In Roman Dacia, S. Cociș categorizes these fibulae as type 8b2a2, in use until the third quarter of the 2nd century AD (Reference Cociș2004, 65–66). According to V. Kropotov’s typology, the fibula falls under form 5 of group 12 of fibulae, referred to as “strongly profiled fibulae with a widened head,” and is dated to the end of the 2nd century–beginning of the 3rd century AD. (Reference Kropotov2010, 260). In the latest work on Sarmatian-period fibulae from the North Pontic region, K. Hellström classifies this fibula as variant III.2f, dated to the second half of the 2nd century–first half of the 3rd century AD (Reference Hellström2018, 88). In the Prut-Dniester region, similar examples can be found in two other graves within the same necropolis, one at Bocani G10, dated to the 2nd–3rd centuries AD (Fyodorov 1956, 55; Reference Fyodorov1960, 380) and one at Șabolat T4G1 (now Sergheevka/Serghiivka), dated by V. Grosu to the 2nd century AD and by O. Dzygovskij to the 2nd–early 3rd century AD (Grosu Reference Grosu1990, 169; Dzygovskij Reference Dzygovskij1993, 201; Samokvasov Reference Samokvasov1908, 132). The Bocani grave featured an individual with an artificially deformed skull—a significant trait for the chronology of Sarmatian assemblages, generally associated with the second half of the 2nd century–first half of the 3rd century AD; this cranial deformation is also present in the two graves from the Taraclia-Gaidabul site, suggesting a possible contemporaneity.
The bronze bracelet (Figure 5/J/9) belongs to type A/XV/5, generally dated from the 1st–4th centuries AD, with peak popularity in the 2nd century AD in the Crimean Peninsula (Polit Reference Polit2022, 98–100, 151). The closest example from the Prut-Dniester area is from Cuconeștii Vechi II G36, dated to the 2nd–3rd centuries AD (Dergachev Reference Dergachev1982, 116). The bronze mirror fragments (Figure 5/J/8) are similar in shape to those from Ocnița T6G12, with comparable dating.
The amber beads (Figure 5/J/1) are of the same type as those from Ocnița T6G12. The green disc beads (Figure 5/J/3-4), according to L. Grumeza, are part of type VII/1/A and are dated to the late 2nd–early 3rd century AD (Reference Grumeza2014, 98). The sandwich beads (Figure 5/J/2–4) are classified as type VII/2, dated to the late 2nd–early 4th century AD (Grumeza Reference Grumeza2014, 98).
Based on this inventory, we estimate the grave’s date to the late 2nd–early 3rd century AD, although E. Sava et al. proposed a more specific date in 2020, placing the assemblage in the mid-2nd century AD.
Șalvirii Noi/Palanca T1G8
For this grave, the material goods provide limited chronological information. Among the finds, there is a bronze clasp (Figure 5/K/3), which, however, has little chronological significance. A spindle whorl (Figure 5/K/4), was also discovered, with analogies found at the same site and at Bădrăgii Vechi T25G3 (Bârcă Reference Bârcă2006, 281). Additionally, a barrel-shaped bead, orange with purple stripes, was identified. According to E. Alekseeva’s typology, these beads belong to Type 19—commonly found in the 1st–2nd centuries AD (Reference Alekseeva1978, 65). The remaining beads have a broad chronological range (Figure 5/K/2,4), similar to the wheel-thrown jug (Figure 5/K/1), which, however, finds its origins in the material culture of Getae milieu.
Based on the described material, this grave can be dated to the second half of the 1st century–early 2nd century AD, in accordance with previous datings by S. Kurchatov (Reference Kurchatov1991).
Șalvirii Noi/Palanca G3
In this assemblage, several material goods have been identified, among which a mirror stands out (Figure 5/L/3). However, it has been preserved in very poor condition, making its classification challenging. Its characteristics suggest that it belongs to Type 9 according to A. Khazanov’s classification and is generally dated to the second half of the 2nd century–the first half of the 3rd century AD (Reference Khazanov1963, 58–71). This chronological attribution is supported by A. Symonenko (Reference Symonenko, Marchenko, Moshkova, Raev and Raev2004, 152). Type 9 Sarmatian mirrors were commonly found in the Prut-Dniester region. However, our mirror cannot be fully attributed to this category due to its poor preservation, which prevents a complete morphological analysis. If it were indeed a Type 9 mirror, it could have been produced even earlier than the second half of the 2nd century AD, as recent studies suggest that such mirrors appeared before this period (Kurchatov Reference Kurchatov1991). Nonetheless, this type has also been discovered at Ocnița, where it is securely dated to the second half of the 2nd century AD. However, in the case of our site, it belongs to the Middle Sarmatian period, placing it within the first half of the 2nd century AD.
Another remarkable artifact is a bronze earring (Figure 5/L/5), which finds analogies at Ocnița (T6G12) and is dated broadly to the 1st–4th centuries AD (Polit Reference Polit2022, 39–40, 150, 178). Additionally, the assemblage includes a series of beads, among which a distinctive round bead with three eye motifs is noteworthy. It is executed in a black-and-white color scheme and, according to Alekseeva’s typology, belongs to Type 25, variant K, characteristic of the 1st–early 2nd centuries AD (Reference Alekseeva1975, 59). The assemblage also contains twelve amber beads, classified in Alekseeva’s typology as Type 44, covering a broad chronological range from the 1st to the 4th century AD (Reference Alekseeva1978, 25), as well as a set of glass beads with a similarly wide chronological distribution (Figure 5/L/4-8).
Of particular interest is a ceramic vessel featuring a band with rhomboid ornamentation beneath rows of burnishing (Figure 5/L/1). Similar vessels have been found at Brăviceni (T4G6) and Sărăteni (T3G10), both attributed to the Middle Sarmatian period (Bârcă, Symonenko Reference Bârcă and Symonenko2009, 502). Another significant find is a spindle whorl (Figure 5/L/3), which has analogies in three other graves from the same necropolis, all dated to the Middle Sarmatian period.
Based on the described material, this grave can be dated to the second half of the 1st century–early 2nd century AD, consistent with the dating proposed by S. Kurchatov (Reference Kurchatov1991).
Results and Discussion
For a more precise interpretation of the results and to refine the chronological intervals of the studied complexes, Bayesian statistics (Bronk Ramsey 2017, 1809–1833) and summed probability distribution (SPD) methods were applied (Figures 6–7). These approaches allow for the construction of statistical models that adjust the standard summation of radiocarbon probability distributions—essentially an overlay of all individually calibrated dates (Bronk Ramsey 2017, 1810). These models rely on agreement indices and convergence parameters, where A (individual agreement indices), Amodel (model agreement index), and Aoverall (overall agreement index) must be at least 60%, while the convergence parameter C (convergence integral) should not fall below 95% in outlier analyses.
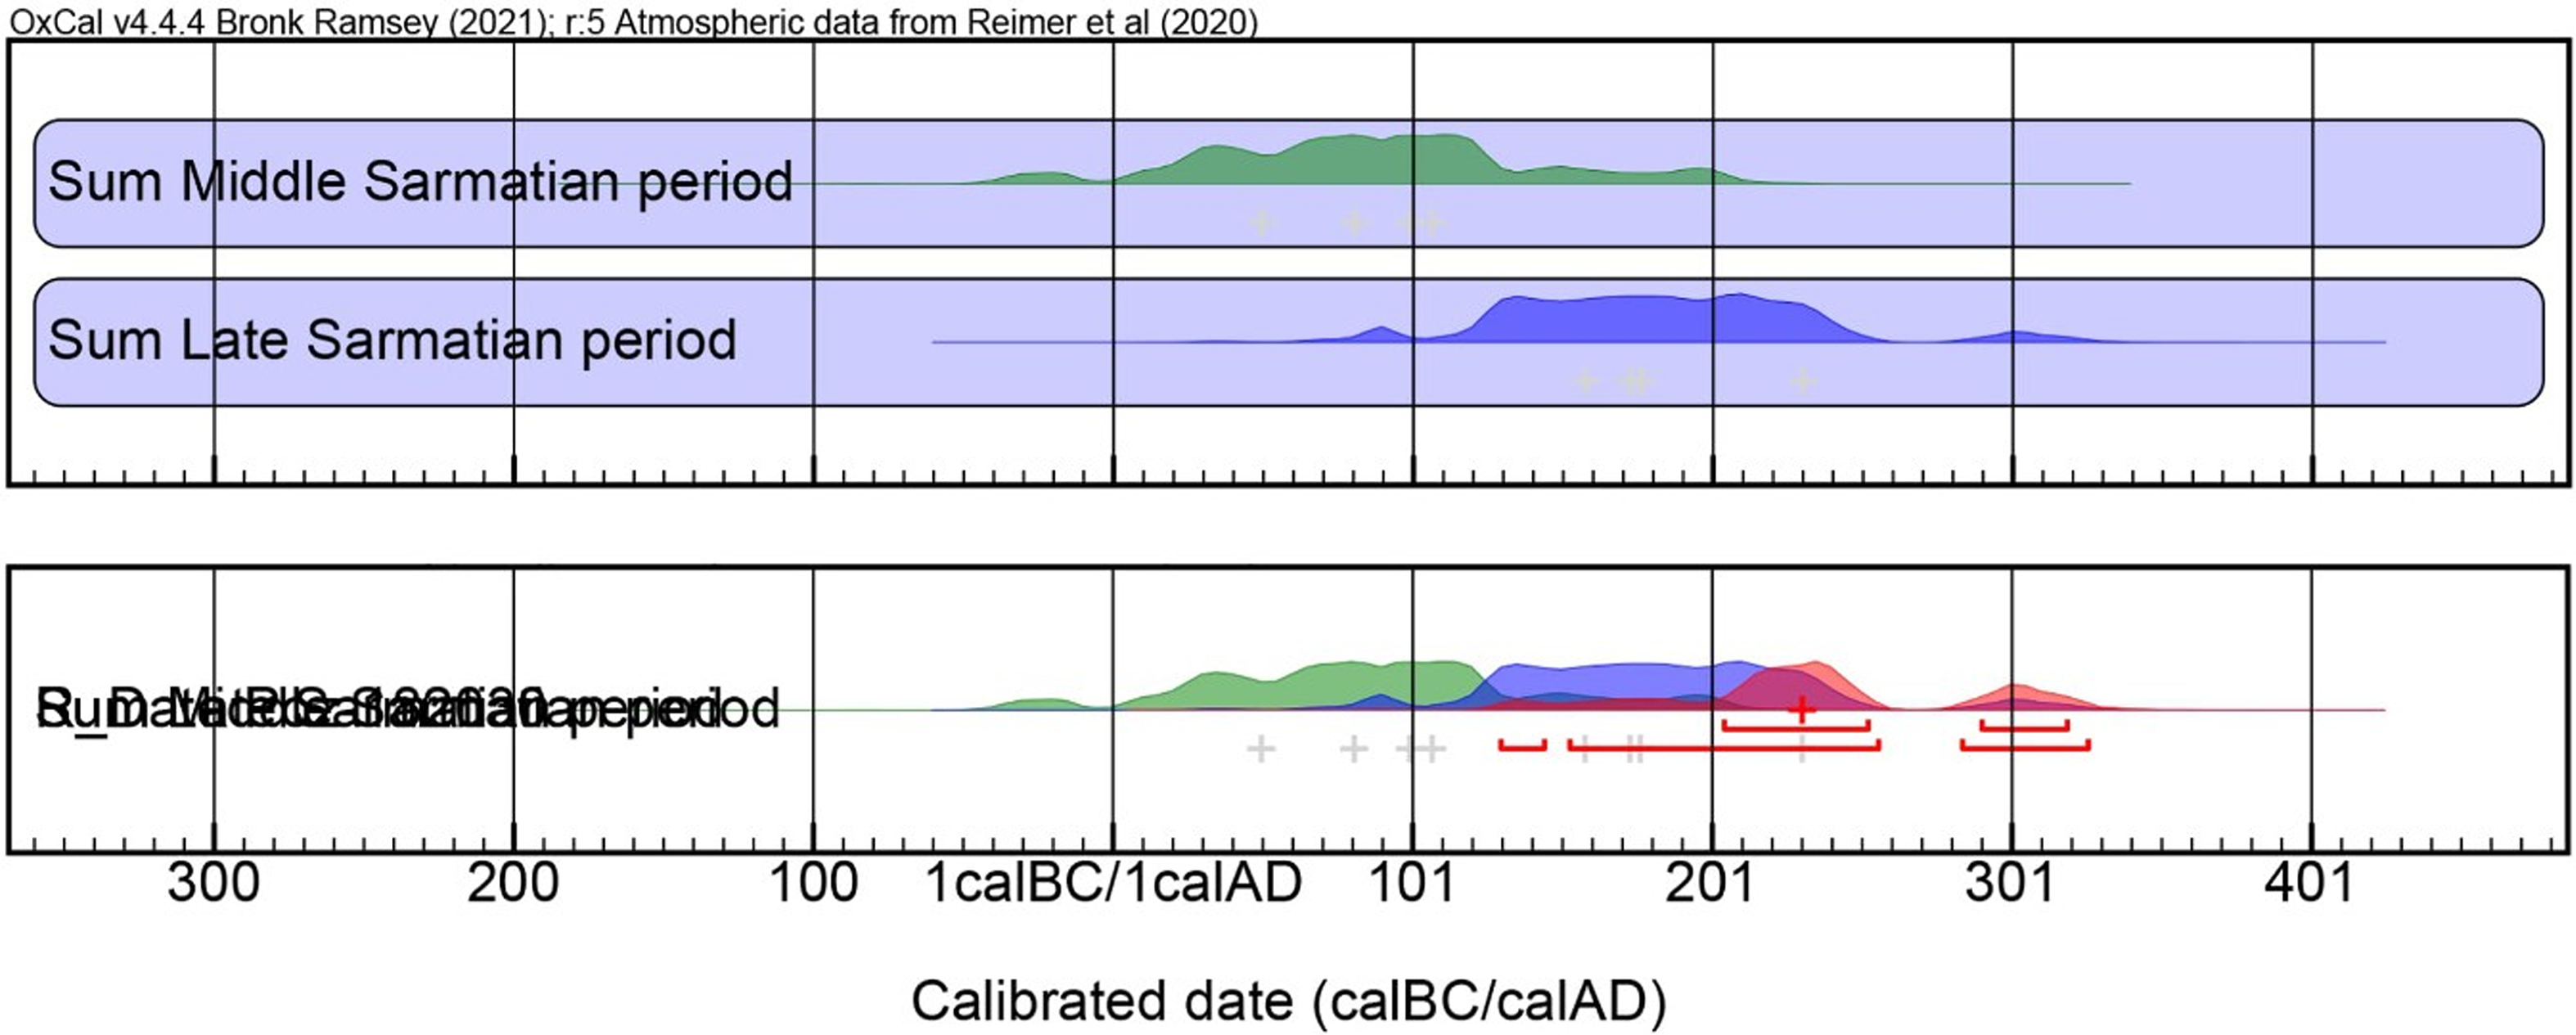
Summation (SUM) of radiocarbon date probabilities.

Figure 6 Long description
The line graph displays the summation of radiocarbon date probabilities for the Middle and Late Sarmatian periods. The x-axis represents the calibrated date ranging from 300 BC to 400 AD, while the y-axis shows the probability distribution. The graph includes two data lines: one for the Middle Sarmatian period in green and another for the Late Sarmatian period in blue. The Middle Sarmatian period shows peaks around 100 BC to 100 AD, while the Late Sarmatian period has peaks from 100 BC to 300 AD. The lower section of the graph includes an additional data line in red, representing the Roman period, with peaks around 100 AD to 300 AD. All values are approximated.
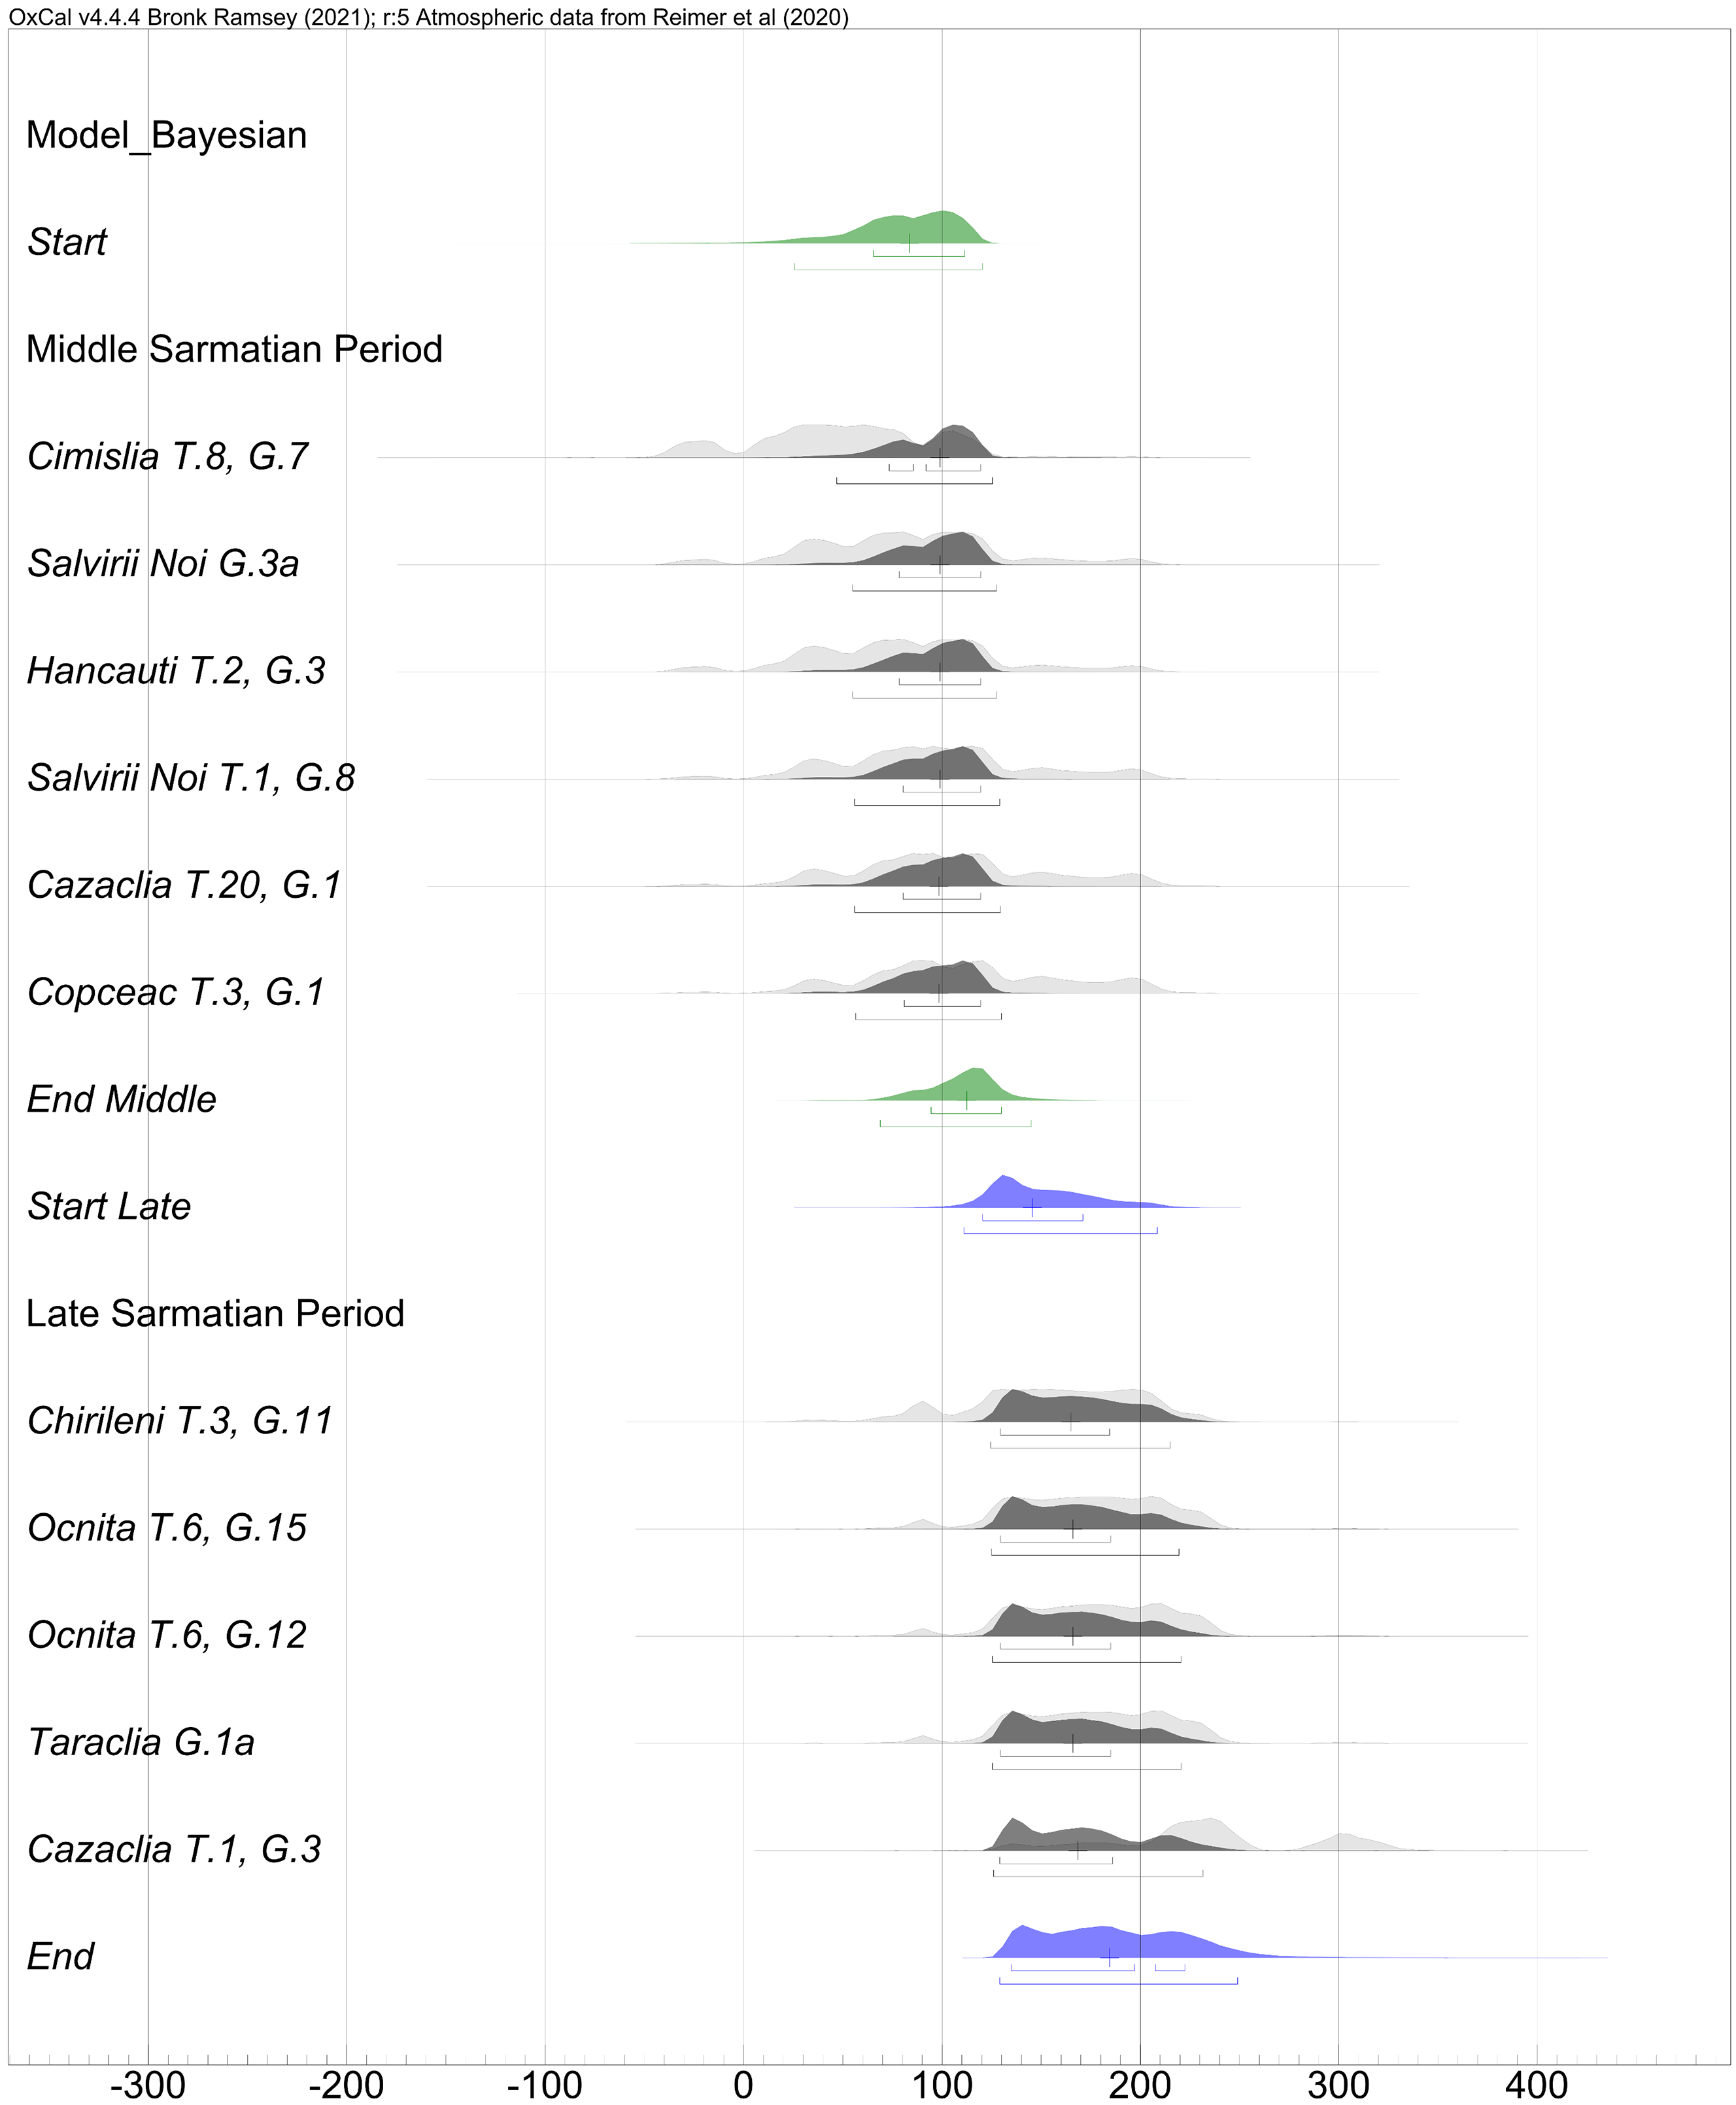
Bayesian model for delimiting the evolutionary phases of the Sarmatian culture.

Figure 7 Long description
A line graph titled 'Bayesian model for delimiting the evolutionary phases of the Sarmatian culture' displays the chronological framework of the Sarmatian culture in the Prut-Dniester region. The x-axis ranges from -300 to 400, representing time in years, while the y-axis lists different periods and data points. The graph includes several key periods: the Start, Middle Sarmatian Period, End Middle, Start Late, and Late Sarmatian Period. Each period is marked with specific data points such as Cimislia T 8, G 7; Salvirii Noi G 3a; Hancauti T 2, G 3; Salvirii Noi T 1, G 8; Cazaclia T 20, G 1; Copceac T 3, G 1; Chirileni T 3, G 11; Ocnita T 6, G 15; Ocnita T 6, G 12; Taraclia G 1a; and Cazaclia T 1, G 3. The graph uses different colors to distinguish between the Middle Sarmatian Period in green and the Late Sarmatian Period in blue. Each data point is represented by a distribution curve, indicating the probability of the date range for each period. The graph aims to provide a clearer understanding of the chronological framework of the Sarmatian culture, addressing ongoing debates and reassessments in the field. All values are approximated.
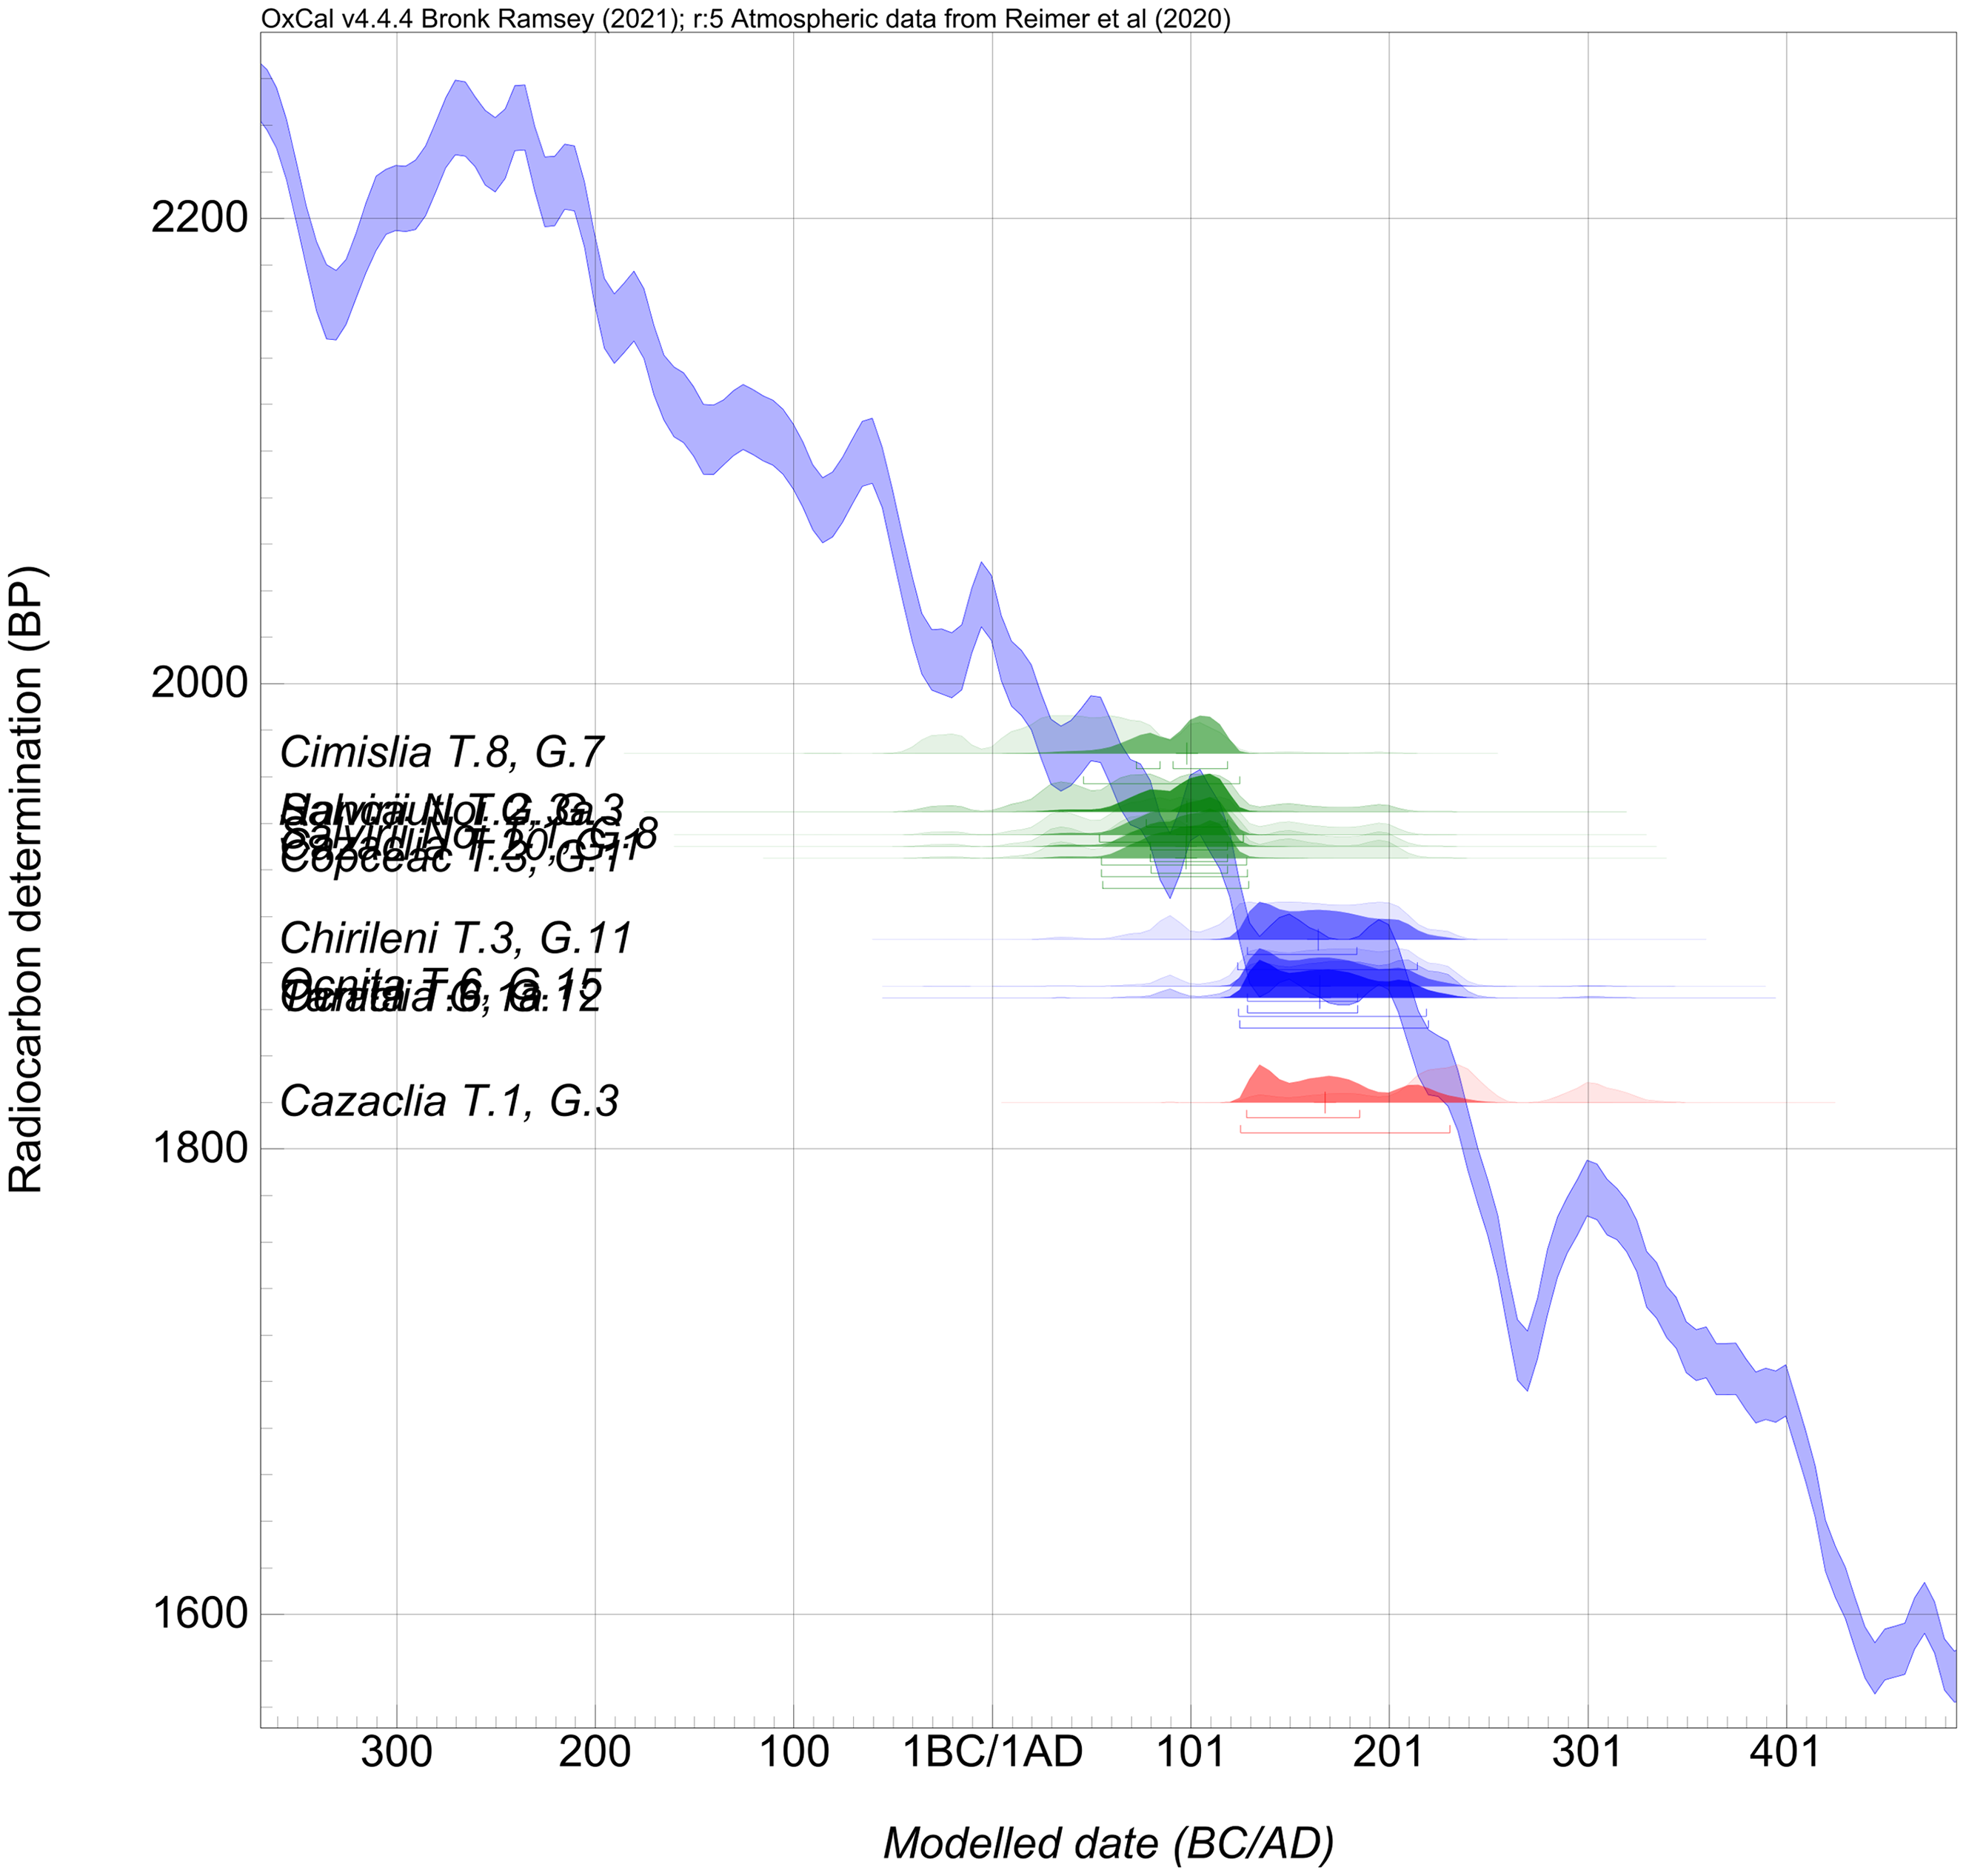
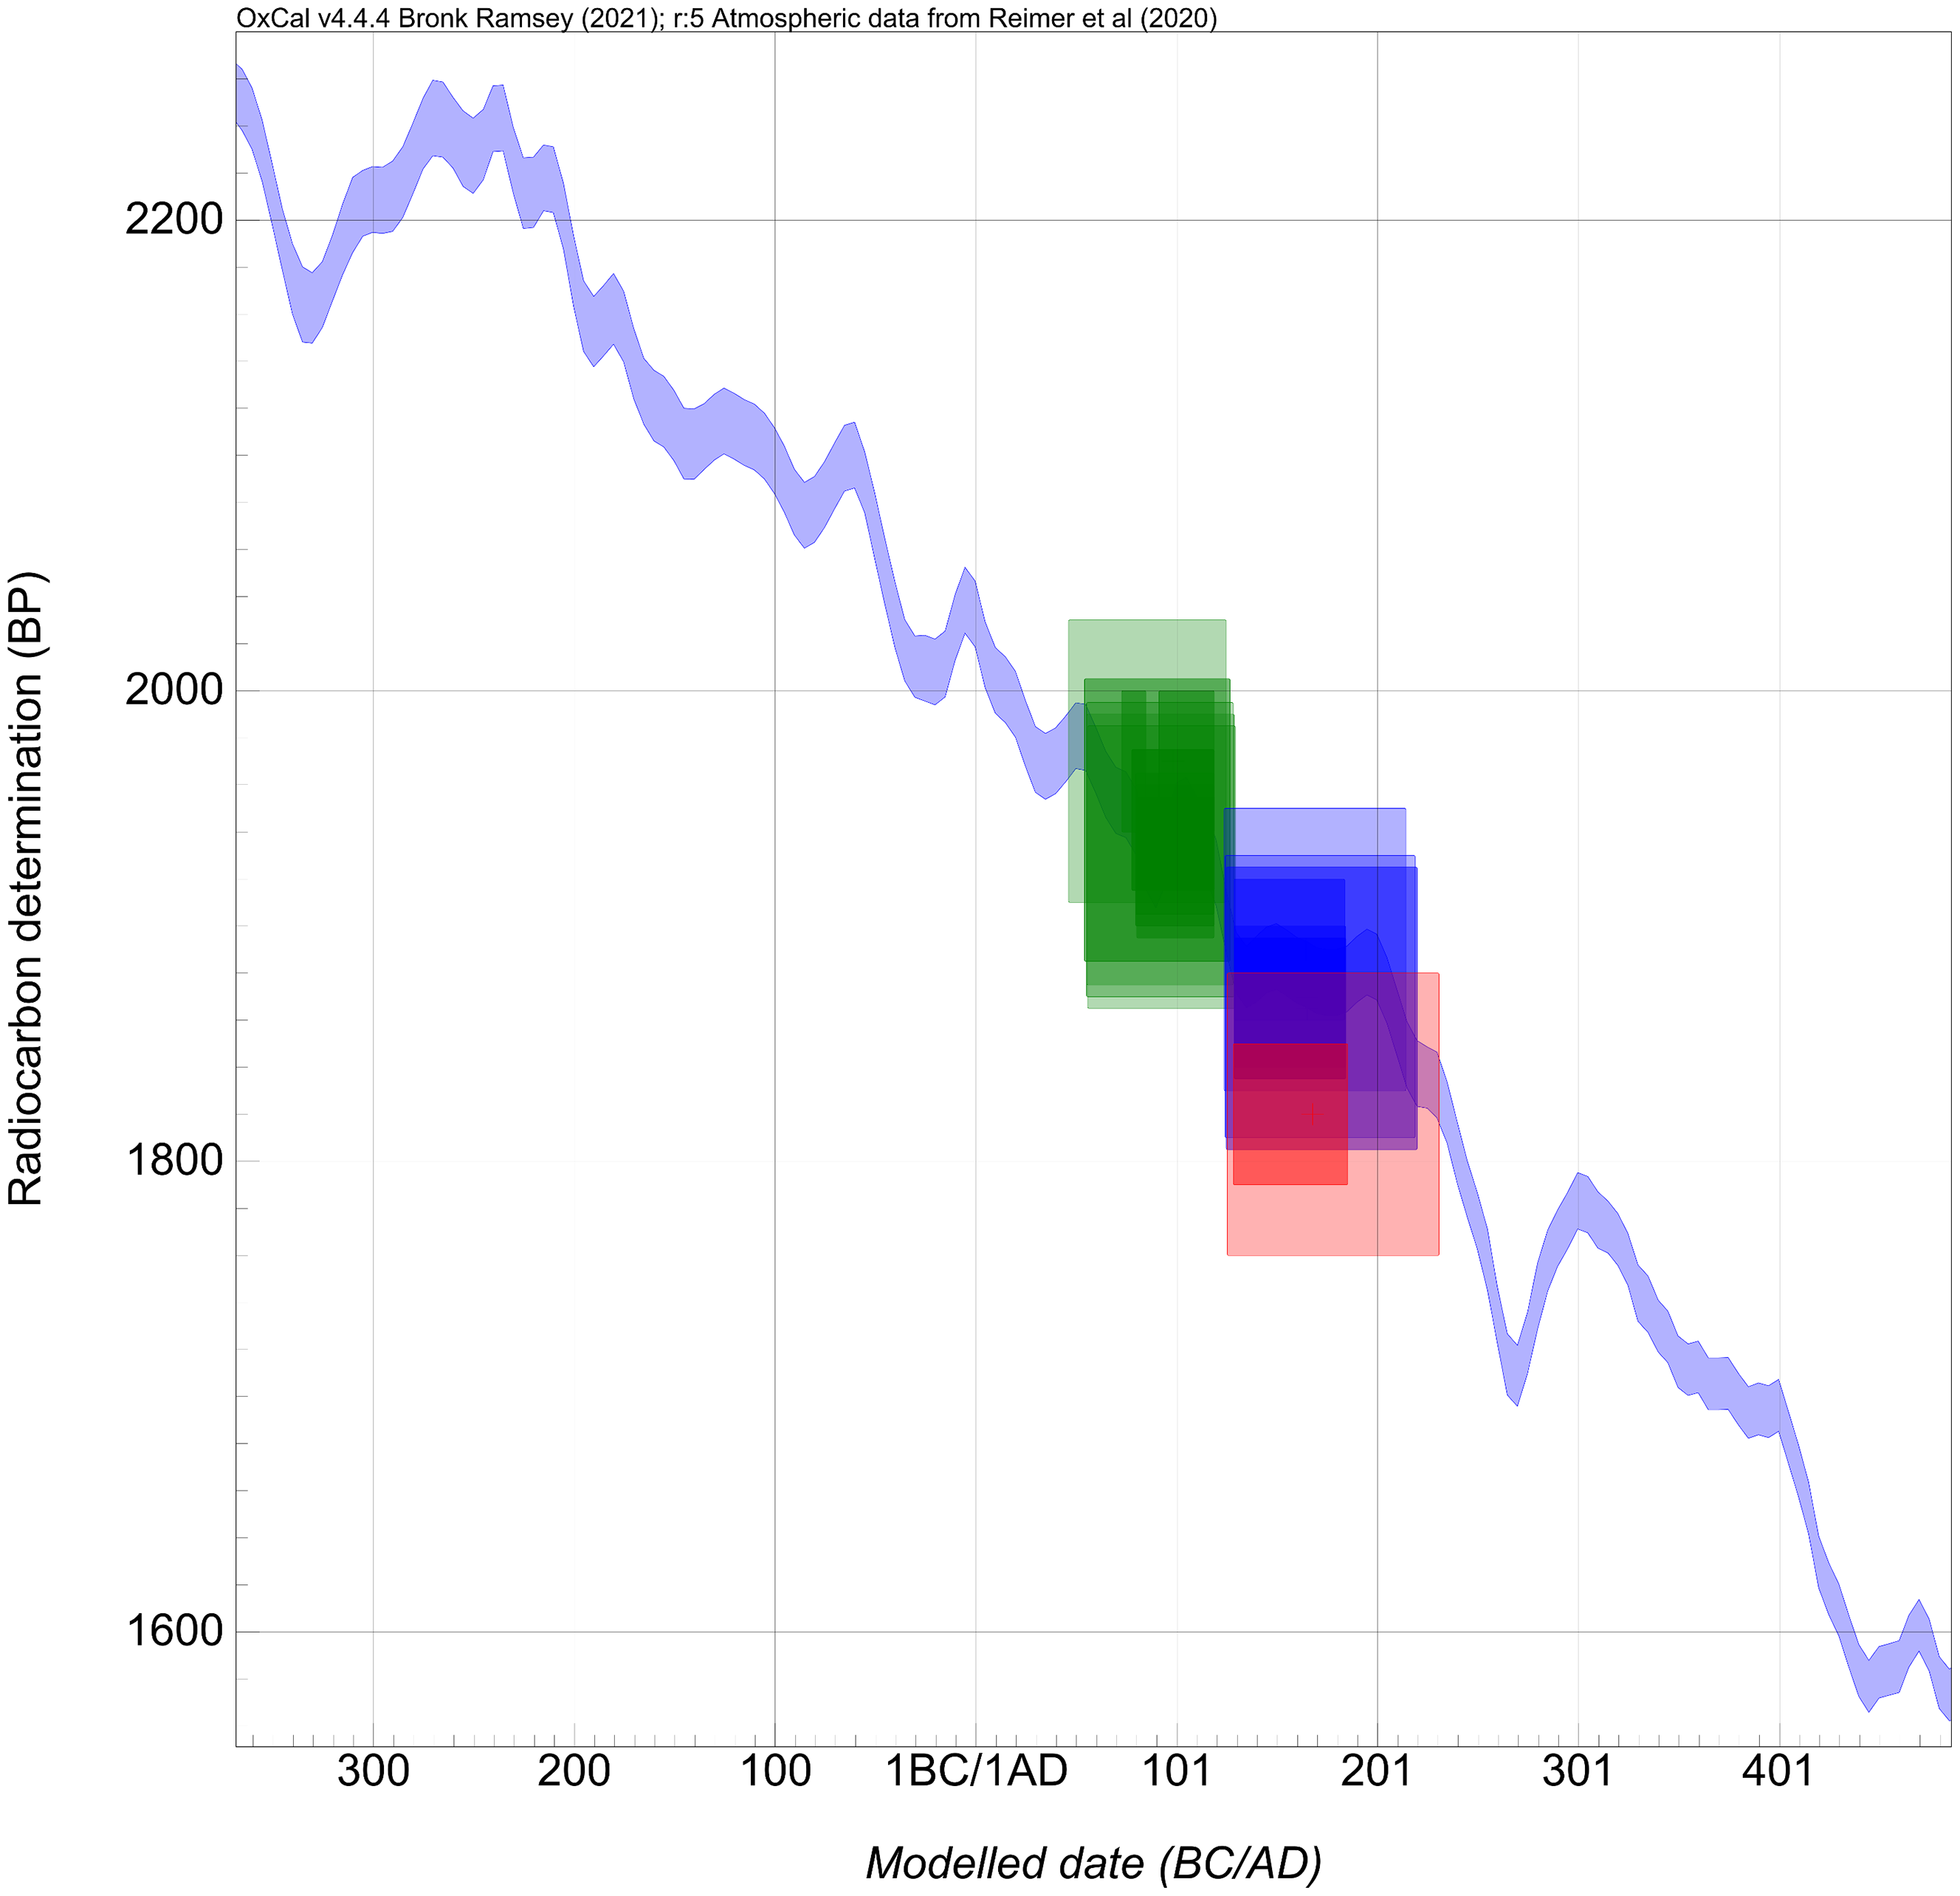
The Bayesian modeling applied in this study (Jones and Nicholls Reference Jones and Nicholls2002, 663–674) is based on the principle of phase construction, using the OxCal v.4.3.2 online software. The resulting model exhibits acceptable statistical agreement coefficients (Amodel = 139.4%; Aoverall = 141.5%). The sequencing of different data groups was plotted and compared against the calibration curve, with probability density distributions (Figures 8–9). Although the use of sequential grouping in radiocarbon datasets can influence outcomes due to prior assumptions, this potential bias was mitigated by treating each dataset as an independent unit within a one-phase modeling framework.
Individual calibrated radiocarbon dates plotted against the IntCal20 calibration curve.

Figure 8 Long description
A line graph displays radiocarbon determination in before present (BP) on the y-axis against modeled dates in BC and AD on the x-axis. The graph includes a primary data line in blue, representing the IntCal20 calibration curve, with shaded areas indicating uncertainty ranges. Multiple colored data points and ranges are plotted across the graph, each representing different archaeological sites and their respective radiocarbon dates. The data points are labeled with site names and specific identifiers. The graph spans from approximately 400 BC to 400 AD on the x-axis and from 1600 to 2200 BP on the y-axis. All values are approximated.
Bayesian modeling of grouped radiocarbon dates into chronological phases.

Figure 9 Long description
A line graph titled 'OxCal v4.4 Bronk Ramsey (2021); r:5 Atmospheric data from Reimer et al (2020)' displays radiocarbon determination in BP on the y-axis and modeled date in BC/AD on the x-axis. The graph features a blue line representing radiocarbon data points, with values ranging from approximately 2200 BP to 1600 BP. The x-axis spans from 401 BC to 401 AD. Multiple colored shaded regions, including green, blue, purple, red, and light blue, indicate different chronological phases. These regions overlap and vary in width, suggesting different time periods and their respective uncertainties. All values are approximated.
The 11 radiocarbon dates were grouped into two phases, tentatively defined as distinct chronological periods. Most samples align with the proposed model, except for one instance of inconsistency.
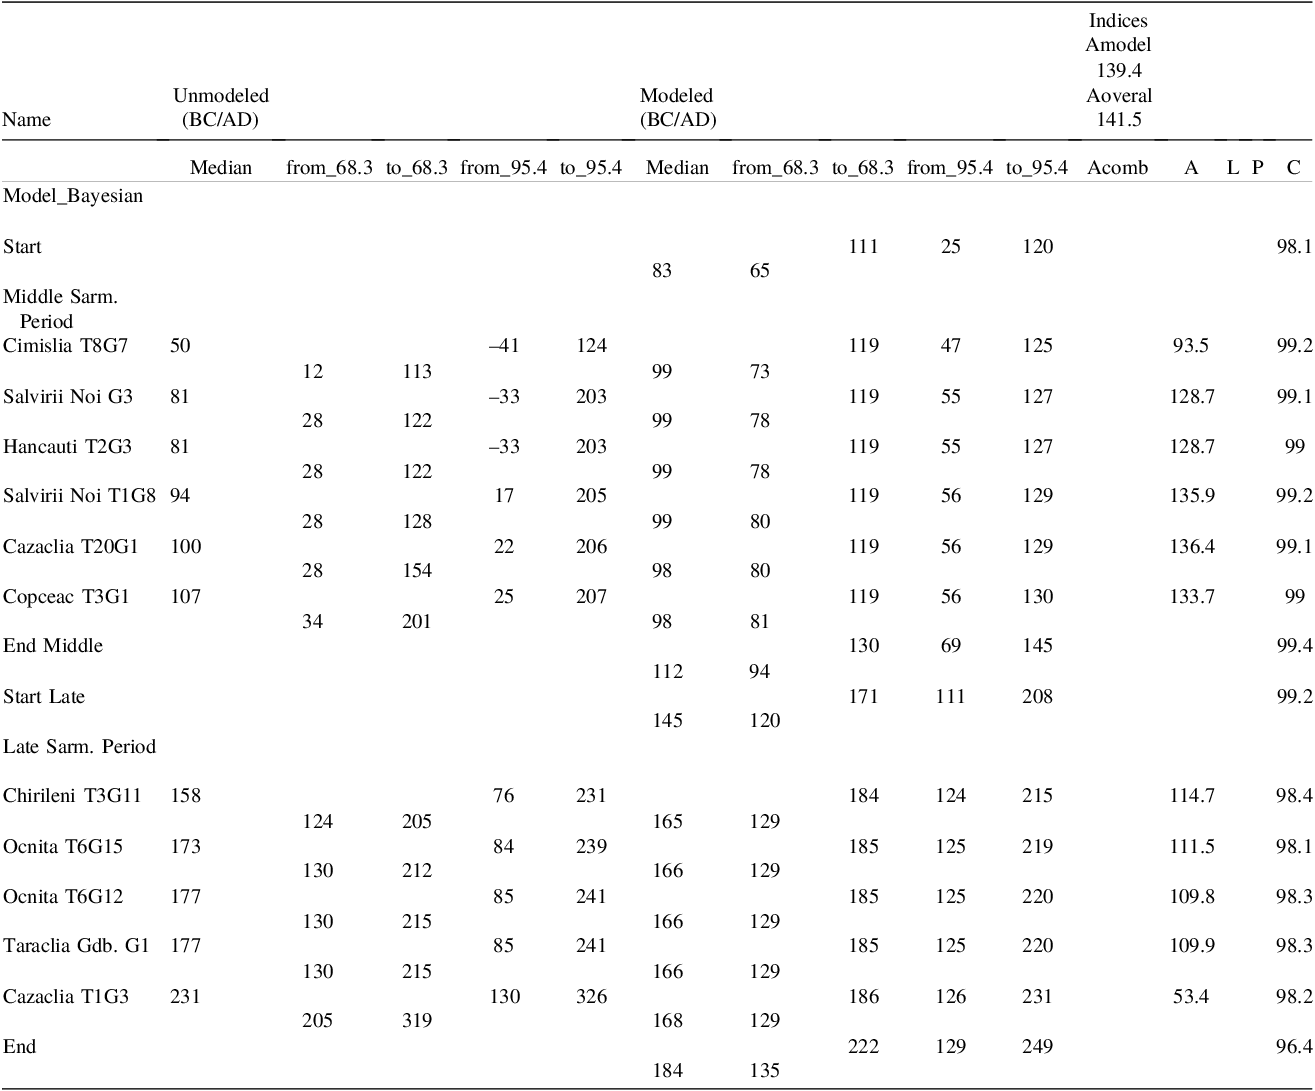
Middle Sarmatian Period: Includes samples from Cimișlia T8, Salvinii Noi G3, Hancăuți T2, Salvinii Noi T1, Cazaclia T20, and Copceac T3. The unmodeled radiocarbon intervals indicate a broad chronological range, with the median values falling between 50 and 107 AD. The 68.3% probability range extends from 12 to 154 AD, resulting in a span of 142 years, while the 95.4% probability range stretches from 41 BC to 201 AD, covering a span of 242 years (Table 2).
By applying Bayesian modeling, these intervals are refined, providing a more precise chronological framework. The modeled results place the 68.3% probability range between 73 and 119 AD, narrowing the span to 46 years, and the 95.4% probability range between 47 and 201 AD, reducing the span to 154 years. This refinement significantly enhances the accuracy of the dating, demonstrating the advantages of Bayesian statistical approaches in archaeological chronology (Table 2)

Table 2 Long description
The table presents radiocarbon dating results for the Middle Sarmatian Period, comparing unmodeled and modeled data. It includes samples from Cimilia T8, Salvinii Noi G3, Hancui T2, Salvinii Noi T1, Cazaclia T20, and Copceac T3. The unmodeled radiocarbon intervals show a broad chronological range with median values between 50 and 107 AD. The 68.3% probability range extends from 12 to 154 AD, spanning 142 years, while the 95.4% probability range stretches from 41 BC to 201 AD, covering 242 years. Bayesian modeling refines these intervals, placing the 68.3% probability range between 73 and 119 AD, narrowing it to 46 years, and the 95.4% probability range between 47 and 201 AD, reducing it to 154 years. This refinement enhances the accuracy of the dating, demonstrating the advantages of Bayesian statistical approaches in archaeological chronology.
Late Sarmatian Period: Includes samples from Chirileni T3, Ocnița T6 (two dates), Taraclia G1, and Cazaclia T1. The unmodeled radiocarbon intervals indicate a broader chronological range, with the median values falling between 158 and 231 AD. The 68.3% probability range extends from 124 to 319 AD, resulting in a span of 195 years, while the 95.4% probability range stretches from 76 to 326 AD, covering a span of 250 years (Table 2).
By applying Bayesian modeling, these intervals are significantly refined, providing a more precise chronological framework. The modeled results place the 68.3% probability range between 129 and 186 AD, reducing the span to 57 years, and the 95.4% probability range between 124 and 249 AD, narrowing the span to 125 years. This refinement underscores the effectiveness of Bayesian statistical modeling in improving chronological precision for the studied archaeological contexts (Table 2).
Notably, the sample from Cazaclia T1G3, while exceeding the acceptable agreement threshold (A’c = 60%), falls outside the expected range and has the highest standard deviation among all analyzed samples (Figurea 8–9, marked in red).
The limited number of radiocarbon dates available for Sarmatian sites in the Prut-Dniester interfluve imposes constraints on the depth of chronological analysis and the ability to establish detailed intersite relationships. Currently available data for these sites necessitate a simple summation (SUM) of probability distributions within the following time intervals (Figure 6):
Middle Sarmatian Period:
-
• Modeled intervals: 73–119 AD (68.3%) and 47–201 AD (95.4%)
Late Sarmatian Period:
-
• Modeled intervals: 129–186 AD (68.3%) and 124–249 AD (95.4%)
These intervals, while broadly aligning with the phases of the Sarmatian culture discussed in this study, appear slightly wider in comparison. However, the application of Bayesian modeling has significantly refined these ranges, providing a more precise chronological framework by reducing the span of dating intervals and enhancing the accuracy of Sarmatian periodization in the region.
Conclusions
This study underscores the essential role of modern radiocarbon dating methods in refining the chronology of archaeological artifacts. While typological approaches remain invaluable for establishing cultural sequences, they often struggle to define precise chronological boundaries. Radiocarbon dating, particularly when combined with Bayesian modeling, offers a powerful tool for narrowing these intervals and enhancing chronological accuracy.
A relevant example comes from a recent study of a Sarmatian grave at Peschanyi IV in the Rostov region, where radiocarbon dating significantly refined the chronological range of the burial (Strokov et al. Reference Strokov, Shishlina and Leonova2022, 365–383). This research demonstrated that artifacts, even those with well-established stylistic and typological attributions, should not be automatically assigned to later periods based on broad cultural assumptions. Instead, their absolute dating must be carefully contextualized within regional and interregional dynamics.
This insight is particularly applicable to the Prut-Dniester region, where Sarmatian assemblages reflect a complex interplay of local traditions and external influences. Roman imports, such as brooches and amphorae, were likely introduced through extensive trade networks, reinforcing connections between local populations and the Roman Empire along major riverine routes. Understanding these interactions requires a precise and reliable chronological framework one that radiocarbon dating, enhanced by Bayesian statistical modeling, is uniquely positioned to provide.
To conclude, this study demonstrates that the systematic application of radiocarbon dating is essential not only in refining the chronology of the Roman period in the Barbaricum but also in redefining cultural phases. By narrowing dating intervals and enhancing chronological resolution, Bayesian modeling has significantly improved our understanding of cultural developments and social dynamics in this historically complex region.
Supplementary material
To view supplementary material for this article, please visit https://doi.org/10.1017/RDC.2025.10160
Acknowledgments
The research activities were supported by the ID-UB Project no. 102—PhD mini-grant, Excellence Initiative—Research University Program, funded by Adam Mickiewicz University, Poznan, Poland. We extend our sincere gratitude to Prof. Dr. Hab. T. Goslar for supervising the 14C analyses conducted at the Poznań Radiocarbon Laboratory. Additionally, we are deeply thankful to the National History Museum of Moldova for providing access to essential archaeological remains, facilitated by Dr. Hab. E. Sava, scientific researcher V. Bubulici and Dr. Al. Varzari, whose support and collaboration were invaluable to the success of this study.