Implications
In recent years the interest in dairy goat breeding in Italy has increased dramatically, moving from marginal mountain areas to more intensive systems. This interest in dairy goat breeding is due to the rapidly increasing demand for dairy goat products. Researchers have determined that the transition period is the most appropriate phase to target to increase productive performance and ameliorate the health of dairy goats, as has previously been observed for dairy cows. Feeding protected fish oil-enriched diets to transitioning dairy goats may improve specific and non-specific immune defences in intensive dairy goat herds.
Introduction
Innate or adaptive immune mechanisms are present in all animal species and protect animals against microbes (Lessard et al., Reference Lessard, Gagnon, Godson and Petit2004). Several mediators, such as cytokines and eicosanoids, contribute to this protective mechanism by activating and regulating both innate and adaptive immunity during periods in which animals suffer stress, such as during high productive performance or parturition. Several studies have shown that innate and acquired resistance are suboptimal in dairy ruminants during the transition period, which partly explains the relatively high frequency of disease outbreaks during these periods (Mallard et al., Reference Mallard, Dehhers, Ireland, Leslie, Sharif, Lacey Vankampen, Wagter and Wilkie1998). Immunological changes that are associated with the metabolic and physical stresses of parturition increase in the weeks before calving and peak at parturition (Mallard et al., Reference Mallard, Dehhers, Ireland, Leslie, Sharif, Lacey Vankampen, Wagter and Wilkie1998; Mallard, Reference Mallard1999); however, data on the immune status of dairy goats in the peripartum period are limited (Azab et al., Reference Azab, Hussein and Maksoud1999; Agazzi et al., Reference Agazzi, Cattaneo, Dell’Orto, Moroni, Bonizzi, Pasotto, Bronzo and Savoini2004). Previous research in animal models has identified several nutritional approaches that may modulate the production of key factors involved in the activation and regulation of innate and adaptive immunity (Calder, Reference Calder1997; Puertollano et al., Reference Puertollano, Pablo and de Alvarez de Cienfuegos2002; Lessard et al., Reference Lessard, Gagnon, Godson and Petit2004). Gershwin et al. (Reference Gershwin, Beach and Hurley1985) and Johnston (Reference Johnston1988) observed that both cell-mediated immunity and humoural immunity are influenced by the amount and types of fat in the diet, while Calder and Grimble (Reference Calder and Grimble2002) presented evidence that fatty acids (FAs) can act as second messengers or regulators of signal transduction molecules. Calder et al. (Reference Calder, Yaqoob, Thies, Wallace and Miles2002) observed that the FA composition of lymphocytes and other immune cells are influenced by dietary FA composition, which affects the ability of lymphocytes to produce eicosanoids.
The development of new feeding strategies in which the FA composition of the diet influences the regulation of immune response through the production of fewer inflammatory factors might attenuate the immunosuppressive effect caused by parturition.
Among FAs, n-3 and n-6 polyunsaturated fatty acids (PUFAs) are rich in fish oil (FO) and have been shown to influence productive performance in dairy goats (Sanz Sampelayo et al., Reference Sanz Sampelayo, Chilliard, Schmidely and Boza2007), although results from dairy cows predicted that higher content of long-chain highly unsaturated FA in the diet would decrease intake relative to saturated FA (Harvatine and Allen, Reference Harvatine and Allen2005). Milk characteristics and milk FA profile are reported to be influenced by the administration of FO rich in n-3 PUFAs as well as increased levels of eicosapentaenoic acid (C20:5) and docosahexaenoic acid (C22:6) (Cattaneo et al., Reference Cattaneo, Dell’Orto, Varisco, Agazzi and Savoini2006), which play a critical role in the modulation of immune reactions (Calder et al., Reference Calder, Yaqoob, Thies, Wallace and Miles2002). There is currently a great deal of interest in the potential health benefits of including n-3 PUFAs in the diet of livestock. Because n-3 PUFAs reduce tissue levels of the immunosuppressive agents arachidonic acid and prostaglandin E2, increased intake of n-3 PUFAs is hypothesised to enhance immune response. In fact, Pomposelli et al. (Reference Pomposelli, Mascioli, Bistrian, Lopezand and Blackburn1989) and Stenson et al. (Reference Stenson, Cort, Rodgers, Burakoff, DeSchryver-Kecskemeti, Gramlich and Beeken1992) have reported that dietary fats rich in n-3 or n-6 PUFAs, respectively, modulate inflammatory responses both in experimental animal models and in clinical trials. Diets enriched with n-3 PUFAs lead to reduced inflammatory reactions in experimental mice, with the significant development of different antibody types in response to antigenic stimulation in comparison to mice fed with an n-6 PUFA-enriched diet (Albers et al., Reference Albers, Bol, Bleumink, Willems, Blonk and Pieters2002). Furthermore, enteral and parenteral supplementation of FO was demonstrated to decrease pathogenesis and increase survival in endotoxaemic and septicaemic models (Mascioli et al., Reference Mascioli, Dohoo and Duizer1989; Johnson et al., Reference Johnson, Griswold and Muakkassa1993). In addition to attenuating acute phase response, dietary FO ameliorates some other aspects of immune system activation (Pisani et al., Reference Pisani, Lecchi, Invernizzi, Sartorelli, Savoini and Ceciliani2009). Pisani et al. showed that phagocytic activity in goat polymorphonuclear leukocytes was significantly increased by eicosapentaenoic acid (EPA, C20:5) and docosahexaenoic acid (DHA, C22:6) added to culture medium in vitro, while DHA significantly down-regulated the production of reactive oxygen spices. A great deal of work is still needed to fully understand the specific mechanism of action involved in the regulation of the immune response; however, there is strong evidence that PUFAs influence cellular communication and activation through the synthesis of prostaglandins, tumour necrosis factor-α, interferon-γ, nitric oxide, and other factors (Calder et al., Reference Calder, Yaqoob, Thies, Wallace and Miles2002).
The aim of the study was to investigate the effects of administering protected FO or hydrogenated palm oil (PO) on variation in milk and blood leukocyte subsets, and on some metabolic and productive parameters in dairy goats during the transition period.
Material and methods
Animals and diets
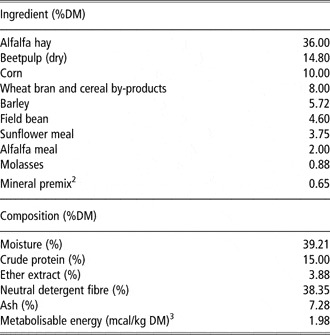
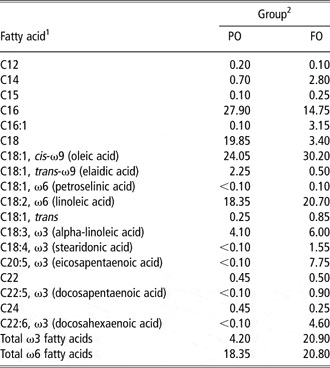
The experiment was performed at the ‘Gian Paolo Guidobono Cavalchini’ goat farm associated with the University of Milan, Italy. The farm was free from brucellosis, tuberculosis, and mycoplasmosis. The animals were treated in accordance with European Union guidelines 103 (86/609/EEC) approved by the Italian Ministry of Health. From an available flock of second-parity pregnant Alpine goats, two balanced groups of 10 animals each were selected according to milk yield in the previous lactation period and body condition score (BCS). The two groups were fed either with FO or with PO from 15 days before parturition. Out of these groups six goats each were used, based on the expected kidding date to properly collect blood samples immediately after kidding for blood leukocytes subsets determination. The same basal transition diet was fed ad libitum to the two experimental groups as a total mixed ration (Table 1) beginning 15 days before kidding and continuing until the 15th day of lactation. The two treatments consisted of supplements of either protected FO or hydrogenated PO. PO was used as a control because it is a highly saturated, rumen-inert lipid source. FO-fed goats were given 47 g/day of protected FO as a source of omega 3 fatty acids, while PO-fed goats were given 47 g/day of hydrogenated PO. FO and PO diets were designed to be isocaloric and isoproteic and meet requirements for goats that averaged 66 kg of live body weight (LBW) and produced 4.00 kg/day of milk containing 4.00% fat and 3.50% protein. The two experimental diets were formulated to supply 6.40 Mcal/head per day. Individual feed consumption was recorded once a week beginning at kidding. Samples of each experimental diet were frozen and pooled for a 2-week analysis. Composite samples were mixed thoroughly and sub-sampled for chemical analyses according to the methods used by Petit (Reference Petit2002). The FA compositions of the experimental diets (Table 2) were analysed as reported by Cherian and Sim (Reference Cherian and Sim1996) using an automated gas chromatograph (Agilent 6890 Series GC, Santa Clara, CA, USA). No clinical pathologies were observed in the experimental groups during the sampling period.
Ingredients and nutrient composition of the basal diet (DM and DM basis)Footnote 1 of transition dairy goats fed a total mixed diet

DM = dry matter.
1 Means of two pooled samples prepared by compositing weekly samples.
2 Containing 50% dicalcium phosphate, 30% sodium bicarbonate, 10% magnesium oxide and 10% trace minerals.
3 Estimated using small ruminant nutrition system (Cannas et al., Reference Cannas, Tedeschi, Atzori and Fox2007).
Fatty acid profiles of experimental diets (percentage of total fatty acids)
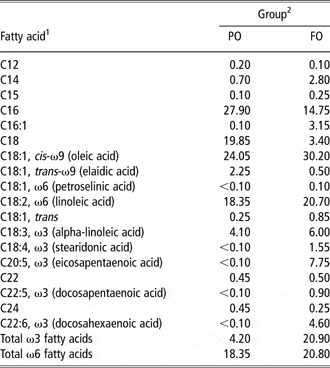
1Means of two pooled samples for each experimental group prepared by compositing weekly samples.
2FO = fat supplement based on protected fish oil; PO = fat supplement based on hydrogenated palm oil.
Productive parameters
LBW was assessed after morning milking at 2, 7, and 15 days in milk (DIM) using an electronic scale (Ohaus ES100L, Pine Brook, NJ, USA). BCS was evaluated on the same days as LBW using a five-point scale, wherein (1) indicates emaciated animals, (2) indicates animals with obvious frames, (3) indicates animals with well-balanced frames and coverings, (4) indicates animals with frames that are not as visible as their coverings, and (5) indicates fat animals (Santucci et al., Reference Santucci, Branca, Napoleone, Bouche, Poisot, Aumont and Alexandre1991).
Milk yield was evaluated at 4, 7, and 15 DIM at two consecutive milkings (morning and evening). Individual milk samples were collected and subsequently analysed for fat, protein, urea, casein, and lactose content using an infrared analyser (Fosso-Matic, Foss Electric, Denmark).
Blood and milk sample collection and analysis
To evaluate plasma metabolites, blood samples were taken at 15(±3.22), 7(±1.97), and 2(±1.12) days before the expected kidding date as well as at 2, 7, and 15 DIM. Two tubes of blood were drawn from the jugular vein of each animal into 10-ml lithium heparin vacuum tubes (Terumo Venojet 10 ml VT-100SHL, Terumo Europe L.V., Leuven, Belgium). Blood samples were subsequently centrifuged (1000 g for 10 min), and five plasma samples from each tube were obtained and frozen (−20°C). Plasma samples were analysed using a Syncron CX5 Delta (Beckman Coulter, Inc., Fullerton, CA, USA) to determine alanine aminotransferase, aspartate aminotransferase, non-esterified fatty acid (NEFA), glucose, beta-hydroxybutyrate (BHBA), cholesterol, and urea contents. To evaluate blood leukocyte subsets, additional blood samples were collected at kidding, 24 h, 4 and 15 days after parturition. White blood cell count (WBC) was assessed in whole blood samples with a Hemat 8 (SEAC, Calenzano, Florence, Italy).
On 4 and 15 DIM, milk samples were collected during morning milking. Teat ends were cleaned and disinfected using paper towels moistened with 5% chlorexidine solution. After discarding first streams, about 100 ml of milk from both half udders were collected in a sterile tube. Samples were kept at 5°C during transportation and delivered to the laboratory within 3 h. Milk somatic cell counts (SCC/ml) were assessed using an automated somatic cell counter (Somacount 150™, Bentley Instruments, Chaska, MN, USA), and bacteriological status was defined according to the Federation Internationale dé Laiterie (International Dairy Federation FIL-IDF (1981) and National Mastitis Council guidelines (1999)). SCC values were log10–transformed to normalise their distribution.
An indirect immunofluorescence technique, described earlier for phenotyping murine, bovine and feline leukocytes (Poli et al., Reference Poli, Turin, Rocchi and Ponti1996; Massi et al., Reference Massi, Sacerdote, Ponti, Fuzio, Manfredi, Viganò, Rubino, Bardotti and Parolaro1998; Paltrinieri et al., Reference Paltrinieri, Ponti, Comazzi, Giordano and Poli2003), was used to evaluate CD4, CD8, CD14 and CD4/CD8 ratios in the sampled blood. After red blood cell lysis, leukocytes were washed in 0.01 M phosphate buffered 0.85% saline (PBS) and resuspended to the original blood volume in PBS, which was then supplemented with 0.2% NaN3. The leukocyte suspension (50 μl) was labelled with MoAb CD8 (clone MCA837, Serotec, Oxford, UK), CD4 (clone GC1A, VMRD, Pullman, WA, USA), and CD14 (clone MM61A, VMRD) at saturating concentrations in PBS containing 0.2% NaN3 qand incubated for 30 min at 4°C. After washing in PBS, a fluorescein isothiocyanate-labelled, affinity-purified goat anti-mouse conjugated immunoglobulin IgG F(ab′)2 antibody (DAKO A/S, Glostrup, Denmark) was added and incubated for 30 min at 4°C. A volume of milk containing 1 × 10⁷ cells was centrifuged at 400 × g for 15 min, and the cell suspension (50 μl) was combined with each monoclonal antibody and processed as described for the blood cells. Immediately before flow cytometric analysis, the cells were stained with propidium iodide (100 μg/ml, 10 μl/sample) to exclude debris and dead cells (Guiguen et al., Reference Guiguen, Greenland, Pardo, Panaye and Mornex1996). Subsequently, controls were performed for blood and milk without antibodies, with secondary antibodies alone, and with an irrelevant antibody used as a negative control (mouse IgG control, Becton Dickinson, San Jose, CA, USA).
Flow cytometric analysis was performed on 10 000 events per sample for blood and 20 000 events per sample for milk using a FAC Sort flow cytometer (Becton Dickinson, San Jose, CA, USA) equipped with Cell Quest software. Blood lymphocytes were gated using a back-gating technique (Byrne et al., Reference Byrne, Kim, Chew, Reinhart and Hayek2000) that selected fluorescent CD8-positive cells by side scatter (SS) v. green fluorescence dot plots and positioned a live gate on the forward scatter v. the SS dot plot of the same sample. The percentage of positive lymphocytes for each surface marker was recorded. Monocytes (CD14-positive cells) were recorded as the percentage of total leukocytes.
Each milk sample (10 μl) was spread onto a blood agar plate (5% defibrinated sheep blood), aerobically incubated at 37°C for 24 and 48 h, and then examined. The number, morphology, and hemolysis pattern of the colonies were recorded. Representative colonies were Gram-stained, subcultured on blood agar plates, and aerobically incubated at 37°C for 24 h to obtain pure cultures. Catalase and coagulase production was tested on Gram-positive colonies. Specific identification of staphylococci was performed by micromethods commercial kit (API Staph; BioMerieux, Italy). The infection status of each milk sample was defined according to procedures recommended by National Mastitis Council (1999). Intramammary Infections (IMI) was defined when ⩾500 cfu/ml of the same organism was present on the agar plate, except for Staphylococcus aureus, for which IMI was determined by the detection of a single colony. When more than two different colony types or <500 cfu/ml of any microorganism were observed, the sample was defined as being contaminated or uninfected, respectively.
Statistical analysis
Data relative to LBW, BCS, productive performance, and blood parameters were analysed by a mixed procedure of SAS (SAS Institute, 2006). The statistical models included the following main effects and interactions: treatment, day of treatment, and treatment by day of treatment. Probability values >0.05 were considered non-significant. All data in the text and tables are presented as least square means ± s.e.
The applied model for statistical evaluation was:

where μ = general mean; Ti = effect of ith treatment (i = 1–2); DJ = effect of day of treatment; (T × D)ij = effect of the interaction between treatment and day of treatment; eij = casual effect of each observation.
Data relative to plasma metabolite levels from defined periods of the prepartum (15 days before kidding to parturition) and post-partum (2 days after kidding to 15 DIM) were analysed separately. This approach was used to focus on critical time points for metabolic changes in ruminants (Mallard et al. Reference Mallard, Dehhers, Ireland, Leslie, Sharif, Lacey Vankampen, Wagter and Wilkie1998; Azab et al., Reference Azab, Hussein and Maksoud1999). Data relative to blood and milk leukocyte subsets were analysed by SPSS 17.0 (SPSS, Chicago, IL, USA) using a Shapiro-Wilk test for a normal distribution followed by a multivariate analysis in a GLM with treatment and sampling time as fixed factors and goats as the randomised factor. Effects of treatment, sampling time, and their interaction were assessed. Blood and milk leukocyte subsets were also tested with a Pearson parametric correlation test to check their association with WBC and SCC. The χ 2 test with Yates’ correction was used to compare frequencies of intramammary infections in FO- and PO-fed animals.
Results
Productive parameters
No differences in dry matter (DM) intake were detected between the two experimental groups during the first week after kidding (1.02 ± 0.03 kg DM/day v. 1.08 ± 0.02 kg DM/day for FO- and PO-fed animals, respectively) and at day 15 of lactation (1.10 ± 0.04 kg DM/day v. 1.09 ± 0.03 kg DM/day for FO- and PO-fed animals, respectively). The average LBW over the first 2 weeks of lactation was higher in the FO-fed group than in the PO-fed group (53.61 ± 1.46 kg v. 48.67 ± 1.33 kg for FO- and PO-fed goats, respectively; P = 0.04), while no differences in BCS were detected. Milk production (2.70 ± 0.54 kg/day v. 2.87 ± 0.29 kg/day for FO and PO, respectively) and milk composition were similar in the two experimental groups. Milk fat content (5.48 ± 0.35% v. 5.44 ± 0.32% for FO and PO, respectively), milk protein content (4.68 ± 0.18% v. 4.42 ± 0.16%), milk lactose content (5.02 ± 0.07% v. 4.96 ± 0.07%), milk casein content (3.50 ± 0.14% v. 3.32 ± 0.12%), and milk urea content (5.25 ± 0.18 mmol/l v. 5.10 ± 0.18 mmol/l) were not influenced by the addition of FO compared with PO, while an effect of time was observed for milk fat content, milk protein content, and milk casein content (P = 0.02; P < 0.01; P < 0.01, respectively).
Plasma metabolites
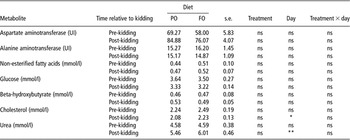
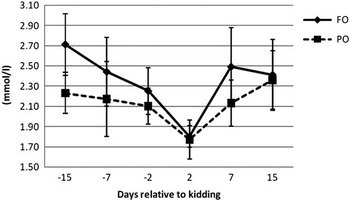
The two diets did not impact the composition of plasma metabolites or liver enzymes collected during the pre-kidding and post-kidding periods in both groups (Table 3). The level of plasma cholesterol and plasma urea content were statistically affected by the sampling time (P = 0.04 and P < 0.01, respectively) during the 2 weeks after kidding, while no differences were detected before parturition (Table 3). The level of plasma cholesterol content did not differ at any sampling time in the two experimental groups and constantly decreased in both PO and FO animals starting from 15 days before kidding to the second day of lactation and then increased to pre-partum levels at 2 weeks after kidding (Figure 1).
Plasma metabolite concentration in 2 weeks before kidding and in the first 15 days in milk in transition dairy goats fed a total mixed diet containing protected FO or hydrogenated POFootnote 1

PO = fat supplement based on hydrogenated palm oil; FO = fat supplement based on protected fish oil; ns = not significant.
1 Least square means with a pooled standard error of the mean (s.e.). *P ⩽ 0.05; **P ⩽ 0.01.
Plasma cholesterol content from the 2 weeks before kidding through the 15th day of lactation in dairy goats fed a total mixed diet containing hydrogenated palm oil (PO) or protected fish oil (FO).

Blood WBC and leukocyte subsets
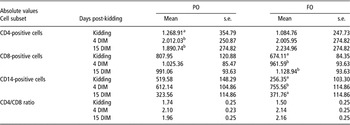
WBC data were all within normal physiological values for goats (Jain, Reference Jain1993). Blood leukocytes in both groups increased at 4 and 15 days post-kidding, but no significant differences were observed for sampling time, treatment, or their interaction. Table 4 reports the leukocyte subsets trend from kidding to 15 DIM. Increased absolute values of CD4, CD8, and CD14 positive cells at 4 days after kidding correspond to an insignificant decrease after 15 days in PO-fed group, while FO-fed group showed a constant increase in the number of CD4 and CD8 cells. A significant effect of sampling time was found for CD4 cells in PO-fed group and for CD8 and CD14 cells in FO-fed group. No significant effects of the treatment or the interaction between the treatment and sampling time were observed. CD4/CD8 ratios in the experimental groups were not influenced by treatments, while CD8 and CD14 cell counts were significantly correlated with WBC.
Blood CD4, CD8, CD14 and CD4/CD8 cell ratios of dairy goats fed a total mixed diet containing protected FO or hydrogenated PO

PO = fat supplement based on hydrogenated palm oil; FO = fat supplement based on protected fish oil; DIM = days in milk.
a,bMeans within a column with different superscripts differ at a level of P ⩽ 0.05.
Milk SCC, IMI and leukocyte subsets
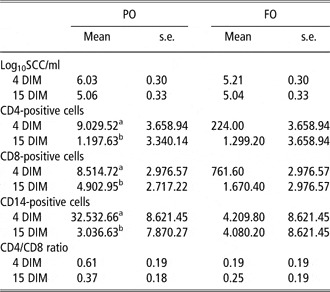
No significant differences in log10 SCC/ml were observed when analysing the effects of sampling time, treatment, or their interaction (Table 5). Bacteriological status analysis showed that IMI did not occur in PO-fed group. Three goats in FO-fed group (χ 2 Yates’ corrected, P = 0.12) had IMI with coagulase negative staphylococci (CNS), which persisted between the first and the second sampling time. No relationship between SCC and IMI were observed in this case. Milk leukocyte count was decreased in all subsets that were significantly correlated with SCC (CD8 and CD14 cells) in PO-fed group. CD4 and CD8 subsets were markedly increased in FO-fed group, while the CD14 cell count was stable throughout the study. No significant effects were observed for sampling time, treatment, or their interaction. The CD4/CD8 ratio in the milk was opposite that in the blood, with a non-significant decrease over the course of the study (Table 5).
Log10 SCC/ml and milk CD4, CD8, CD14 and CD4/CD8 cell ratios of dairy goats fed a total mixed diet containing protected FO or hydrogenated PO

SCC = somatic cell count; PO = fat supplement based on hydrogenated palm oil; FO = fat supplement based on protected fish oil; DIM = days in milk.
a,bMeans within a column with different superscripts differ at a level of P ⩽ 0.05.
Discussion
Over the past decades the use of fat-supplements for increasing the energy content of the diet has been extensively examined in dairy goats by several authors (Baldi et al., Reference Baldi, Cheli, Corino, Dell’Orto and Polidori1992; Schmidely and Sauvant, Reference Schmidely and Sauvant2001; Chilliard et al., Reference Chilliard, Ferlay, Rouel and Lamberet2003; Cattaneo et al., Reference Cattaneo, Dell’Orto, Varisco, Agazzi and Savoini2006; Sanz Sampelayo et al., Reference Sanz Sampelayo, Chilliard, Schmidely and Boza2007). Recently has the impact of dietary FO supplementation been investigated on immune response as a source of EPA and DHA with interesting results (Calder et al., Reference Calder, Yaqoob, Thies, Wallace and Miles2002; Agazzi et al., Reference Agazzi, Cattaneo, Dell’Orto, Moroni, Bonizzi, Pasotto, Bronzo and Savoini2004; Pisani et al., Reference Pisani, Lecchi, Invernizzi, Sartorelli, Savoini and Ceciliani2009). Our findings with regard to DMI, milk production, and milk composition are consistent with those of previous authors who did not find any significant differences in the productive performance of dairy goats fed FO (Cattaneo et al., Reference Cattaneo, Dell’Orto, Varisco, Agazzi and Savoini2006; Sanz Sampelayo et al., Reference Sanz Sampelayo, Chilliard, Schmidely and Boza2007). Our analysis of plasma metabolite levels showed a similar trend in the two experimental groups, confirming that the type of dietary fat did not affect periparturient metabolic response in the goats. Values of plasma glucose, BHBA, NEFA, cholesterol and urea both before and after kidding were comparable to those reported by other studies of dairy goats (Stella et al., Reference Stella, Paratte, Valnegri, Cigalino, Soncini, Chevaux, Dell’Orto and Savoini2007; Celi et al., Reference Celi, Di Trana and Claps2008). The trends in the levels of liver enzymes over time were unaffected by treatment both before and after kidding. With regard to plasma cholesterol content, decreasing levels were observed in both experimental groups in the 2 weeks before kidding, followed by a post-partum increase until 15 DIM, similar to the findings of Van Den Top et al. (Reference Van den Top, Van’t Klooster, Wensing, Wentik and Beynen1995).
The transition period is known to be a critical period for native immune defence in domestic animals; however, most data on this effect has been collected in dairy cows. Many authors have described that cows can experience a decrease in neutrophil and macrophage activity (Mallard et al., Reference Mallard, Dehhers, Ireland, Leslie, Sharif, Lacey Vankampen, Wagter and Wilkie1998) or interleukin 2 production (Shafer-Weaver et al., Reference Shafer-Weaver, Pighetti and Sordillo1996) during the transition period. Susceptibility to diseases such as mastitis, ketosis, retained foetal membranes and abomasal displacement, can increase during the transition period because of the related organic defence failure (Kehrli and Goff, Reference Kehrli and Goff1989; Kehrli et al., Reference Kehrli, Goff, Harp, Thurston and Norcross1990; Kehrli and Harp, Reference Kehrli and Harp2001). Few data are available regarding the dairy goat immune defence during transition period. We found that SCC and IMI were not correlated in FO-fed group, while PO-fed group showed a very high-SCC 4 DIM without the evidence of IMI. This result could be related to an incomplete or slower regression in SCC after the colostral stage in PO-fed group. At the same time, a very low observed SCC value in FO-fed group despite the presence of CNS IMI could be related to a very early stage of infection that lacked an udder inflammatory response, or a possible modulatory effect of dietary treatment. The presence of CNS as the single source of IMI confirms the relevant diffusion of these microorganisms in caprine dairy farms (Contreras et al., Reference Contreras, Paape and Miller1999; White and Hinckley, Reference White and Hinckley1999; Moroni et al., Reference Moroni, Antonini, Luzi, Cattaneo, Savoini and Bronzo2002). WBC counts confirm the immunosuppressed status of the observed animals during the transition period; indeed, the WBC was lowest at kidding and increased during the first 15 DIM. The blood leukocyte subsets data from PO-fed group confirm reports in the literature, where a general predominance of CD4-positive cells over CD8-positive cells was reported, with a non-significant increase at 4 DIM that returned to approximately the initial value at 15 DIM. FO-fed group showed generally stable numbers of CD8-positive cells; these data confirm the findings of previous studies in dairy cattle regarding the quantity of leukocytes in each subset, but not the general decreasing trend in leukocyte subsets associated with parturition (Van Kampen et al., Reference Van Kampen, Mallard and Wilkie1999; Harp et al., Reference Harp, Waters and Goff2004). The CD4/CD8 ratio was generally stable in PO-fed group, while FO-fed group showed a constant increase in CD4 cells relative to CD8 cells according with Kimura et al. (Reference Kimura, Goff, Kehrli and Harp1999). The milk leukocyte subsets analysis confirmed the prevalence of CD8-positive cells with a consequent reversal of the CD4/CD8 ratio observed in the blood. Data from PO fed group are very similar to those reported in several previous studies in cattle and goats (Guiguen et al., Reference Guiguen, Greenland, Pardo, Panaye and Mornex1996; Ismail et al., Reference Ismail, Hashimoto, Kon, Okada, Davis and Iwanaga1996; Asai et al., Reference Asai, Komine, Kozutsumi, Yamaguchi, Komine and Kumagai2000), showing a general decrease from 4 to 15 DIM that is significantly related to a decrease in milk SCC for CD8- and CD14-positive cells. In contrast, FO fed group showed a non-significant increase in CD4- and CD8-positive cells and a relatively stable number of CD14-positive cells. This trend could be related to the trend in milk SCC, which was lowest at the fourth DIM. The presence of IMI in FO-fed groups, without an increase in SCC and with relatively stable levels of leukocytes in each subset studied, could reasonably be explained by the anti-inflammatory effects of FO, which has been observed previously in humans, cattle and, by our group, in goats (Ballou et al., Reference Ballou, Cruz, Pittroff, Keisler and DePeters2008; Manzoni et al., Reference Manzoni, Gotho, Gidlund, García, Torrinhas, Mirtes and Linetzky2009; Pisani et al., Reference Pisani, Lecchi, Invernizzi, Sartorelli, Savoini and Ceciliani2009). Overall the administration of FO to periparturient dairy goats seems to affect leukocyte subsets variation, modulating the effect of the transition period, with a constant increase in CD4- and CD8-positive cells in the blood (Kehrli et al., Reference Kehrli, Goff, Harp, Thurston and Norcross1990; Shafer-Weaver et al., Reference Shafer-Weaver, Pighetti and Sordillo1996; Kehrli and Harp, Reference Kehrli and Harp2001).
Conclusion
This study shows that the adoption of dietary n-3 and n-6 PUFAs from FO in the diet of dairy goats represent a relevant factor to the health of the animals, especially during a major stressful period such as transition. The major findings from this study have shown that, although productive parameters and metabolic status were not significantly changed, the administration of FO to dairy goats during transition period affects the variation in leukocyte subsets compared with an isocaloric and isoproteic fat-enriched PO diet. The obtained results showed that FO administration may modulate immunosuppression during the transition period and could be suitable, not merely as an energy-providing source, for its beneficial effect on leukocyte subsets.
Acknowledgements
This research was supported by grants from the Italian Ministry of University and Scientific and Technological Research (PRIN 2006, Professor Savoini and Professor Bronzo).