I. INTRODUCTION
Plethora of research articles published annually on Au nanoparticles (Au NPs) as catalysts probably stand testimony to them being one of the most widely studied inert materials that have garnered attention in various industrially important heterogeneous catalysis reactions involved in the manufacturing of fuels, chemicals, and pharmaceuticals and in several pollution abatement strategies. Although it is imperative that nanoparticles with small size and high surface area would serve as an efficient catalyst in heterogeneous catalysis through a significant contact area between the active catalyst surface and the surrounding reaction phase, however, the Au NPs in contrast are adversely affected as a catalyst, as they succumb to the problems of severe aggregation during the catalytic process owing to high surface energy associated with their small size, which is inevitably manifested in lowering of the number of active sites accessible to reactants in a catalytic process and degrades their catalytic performance during prolonged catalytic cycles. Since, it is suggested that low coordinated Au atoms on the corners and edges are the active sites in the Au NPs and their fraction in the sample scales proportional to their catalytic activity. Thus, the key to exploiting the complete benefits of an excellent catalyst, it is crucial that the particle agglomeration is circumvented in Au NPs along with maximizing the surface area through reducing their sizes. The use of suitable stabilizing and reducing agents (such as surfactants, carbohydrates, citrate, hydrogen peroxide, ascorbic acid, N,N-dimethylformamide, and sodium borohydride, etc.)Reference Liu, Traulsen and Cornelissen1,Reference Chen, Gu, Nie, Jiang, Xie and Lin2 during the synthesis of Au NPs is one of the most commonly adopted procedures to impede aggregation in Au NPs. Here, the choice of appropriate stabilizing and reducing agents is of great significance as they not only have the propensity to affect the final shape and size of the Au NPs, a crucial parameter in their catalytic performance, but may also chemically influence the rate of the chemical reaction of interest by their presence in the catalytic system. For instance, separate studies carried out by Kundu et al.Reference Kundu, Lau and Liang3 and Dimitratos et al.Reference Dimitratos, Villa, Prati, Hammond, Chan-Thaw, Cookson and Bishop4 reported that the catalytic activity of Au NPs is affected by both their size and the amount of stabilizing agent, where the former carried out the seed mediated synthesis of Au nanospheres, nanorods (different aspect ratios), and nanoprisms using cetyltrimethylammonium bromide as the stabilizing agent and ascorbic acid as the reducing agents while the later synthesized Au NPs by varying the weight ratio of the stabilizing agent, polyvinyl alcohol, and the Au precursor in the reaction mixture.
An alternate and more significant strategy, pertinent to be able to extricate the best catalytic activity of the Au NPs when used as a catalyst in heterogeneous catalysis, is to anchor the Au NPs onto specific supports/substrate.Reference Liu, Xie, Sun, Tang, Zhou, Wang, Liu, Li, Zou and Wang5–Reference Edwards, Landon, Carley and Hutchings7 Generally, porous materialsReference Yang, Luo, Guo, Chao, Yang and Li8 with high surface area are used as the substrate/support for growth and anchoring of the Au NPs. They not only serve as a stabilizing agent but also promote better dispersion of Au NPs catalysts for better contact of the reactant molecules with their active sites, assist in maintaining the reactant and catalyst in close proximity, and prevent leaching of the catalyst through the reaction. Some of the commonly used supporting materials for nanocomposites are polymers,Reference Beija, Palleau, Sistach, Zhao, Ressier, Mingotaud, Destarac and Marty9 carbon nanotubes,Reference Cheng, Su, Tan, Tai and Liu10,Reference Wang, Liu, Chen, Chou and Wang11 graphene,Reference Li, Fan, Qi, Ji, Wang, Zhang and Zhang12,Reference Li, Yu, Wageh, Al-Ghamdi and Xie13 silica,Reference Wang, Lin, Ge, Shah, Lu and Zhang14,Reference Pandey, Shukla and Pandey15 and other porous materialsReference Wang, Tang, Yan, Yang, Wang and Chen16,Reference Xu, Li, Xie, Ma, Chen and Wang17 which provide Au NP anchored high surface area for the adsorption of reactant molecules during the catalytic process. Among them, carbon materials are one of the most promising candidates as a catalyst support because of their chemical inertness in an aqueous medium over a broad pH range and ease of surface functionalization.Reference Saipanya, Lapanantnoppakhun and Sarakonsri18 Moreover, it is reported that the doping carbon matrix with heteroatoms (N or S) can effectively improve catalyst activity by modulating the surface properties of the catalyst system. Li and coworkers also claimed that the presence of nitrogen (N) atoms in the supporting material (mesoporous carbon) plays a crucial role in the catalytic activity of a nanocomposite system.Reference Yang, Luo, Guo, Chao, Yang and Li8
In this work, we report the synthesis of N, S doped carbon dots-Au nanocomposite (NS CDs-Au NCs) for the catalytic reduction of nitroaromatics where carbon dots (CDs) not only serve as a stabilizing agent but also reduce chloroauric acid to Au NPs. CDs are well documented to exhibit unique features such as high solubility, good photostability,Reference Yang, Li, Xu, Ma, Zhang, Su, Gao, Wei and Zhang19 and biocompatibilityReference Zhao, Qian, Quan, Wu, Zheng and Zhou20 and, more importantly, capable of modulating electronic band structures of metal/metal oxidesReference Araujo, Oliveira, Teles, Fabris, Oliveira and de Mesquita21,Reference Martins, Angelo, Girao, Trindade, Andrade and Mendes22 by its unique electron transfer property. The appearance of N, S doped CDs as a polymer network is also acting as a substrate for nucleation and growth of Au NPs. In addition, the doping supporting matrix with N and S atoms not only alters the surface properties of Au NPs anchored on its surface but also expected to provide adsorption active sites for reaction substrates such as nitroaromatics.
II. MATERIALS AND METHODOLOGY
A. Materials
All the chemicals used in the synthesis of NS CDs and NS CDs-Au NCs were of analytical grade and commercially available. Citric acid monohydrate (C6H8O7·H2O, ≥99.0%) was purchased from Merck Ltd., Mumbai, India. Thiourea (CH2N2S ≥99%) and tetrachloroauric acid (HAuCl4) were purchased from SRL Ltd., Mumbai, India, and Spectrochem Ltd., Mumbai, India, respectively. All the experiments were performed using millipore water and carried out at room temperature.
B. Synthesis of NS CDs and NS CDs-Au NCs
NS CDs were prepared by microwave heating carbonization of citric acid and thiourea. Briefly, aliquots of aqueous solutions of citric acid and thiourea were mixed together in the molar ratio of 1:3 and carbonized through microwave irradiation for 2 min at 800 W. The obtained black solid mass was collected and redissolved into millipore water to prepare a stock solution of 2 mg/mL. Next, ∼100 µL of the NS CDs stock solution was added to 10 mL of the heated (at ∼95 °C) aqueous solution of HAuCl4 (0.6 mM) in a dropwise manner and was mixed together under vigorous stirring to obtain a wine red colored solid sol of N, S co-doped CDs–Au nanocomposites (NS CDs-Au NCs). The NS CDs and the solid sol of NS CDs-Au NCs have been characterized in detail and used without further purification.
C. Catalytic activity
The catalytic activity of NS CDs-Au NCs has been investigated by monitoring the reduction of nitroaromatic compounds (NACs) such as 4-NP, NB, and 4-NA to the corresponding aromatic amino compounds in the presence of excess of NaBH4. For the study, 2 mM aqueous stock solution of each of the NACs (i.e., 4-NP, NB, and 4-NA) were separately prepared while the aqueous solution of NaBH4 (50 mM) was freshly prepared under ice cold condition to control the liberation of H2 gas. Subsequently, different volumes (0.1, 0.5, and 0.1 mL) of the respective stock solution of 4-NP, NB, and 4-NA were added into a quartz cuvette containing a mixture of 0.7 mL water, 0.75 mL of freshly prepared aqueous solution of NaBH4, and 0.005 mL of the colloidal sol of NS CDs-Au NCs. The reaction mixture was stirred properly prior to recording the respective UV Vis absorbance spectra (λ ranging between 500 and 200 nm) at regular time intervals. The time interval between two successive fast scans was fixed at 2, 3, and 2.5 s for 4-NP, NB, and 4-NA, respectively.
D. Characterization of NS CDs and NS CDs-Au NCs
Fourier-transform infrared (FTIR) spectroscopy studies for the samples were carried out using the Perkin Elmer Spectrum RX II (Model-73713), Akron, Ohio. The X-ray powder diffraction (XRD) study was carried out on a Bruker AXS Diffractometer D8, Karlsruhe, Germany, using Cu Kα radiation (λ = 1.5418 Å) at a scan rate of 3°/min. The X-ray photoelectron spectra (XPS) of the samples were recorded on a PHI 5000 Versa probe-II scanning microprobe (Φ ULVACPHI, INC.), Chigasaki, Japan fitted with an Al-Kα X-Ray monochromator (1486.7 eV). The binding energy scale of the XPS spectrum was calibrated with standard values of C 1s at 284.5 eV. Transmission electron microscopy (TEM; JEOLJEM-2100), high resolution transmission electron microscopy (HRTEM; JEOL, Tokyo, Japan), and field emission scanning electron microscopy (FESEM; FEI NOVA NANOSEM 450, Hillsboro, Oregon, United States) have been used to analyze the particle morphologies in the sample. The samples for the TEM and HRTEM studies were prepared through the drop-casting method, where a drop of the CD solution was cast on carbon-coated copper grids. To see the notable difference between the TEM images of a carbon-coated copper grid with and without (blank carbon coated copper grid) NS CD samples have been taken as shown in Fig. S1. Raman spectra of the samples were recorded on a HORIBA JobinYvon T64000 Raman spectrometer, Longjumeau, France, using an Ar–Kr laser source of fixed wavelength (λ = 514 nm), equipped with a microscope (model BX41 Olympus, Tokyo, Japan). The UV Visible spectra were recorded by using a Shimadzu-2450 UV-VIS-NIR spectrophotometer, Tokyo, Japan. Zeta potential measurement was carried out using the DLS instrument of HORIBA Jobin (Nanoparticle analyzer SZ 100), HORIBA, Kyoto, Japan.
III. RESULTS AND DISCUSSION
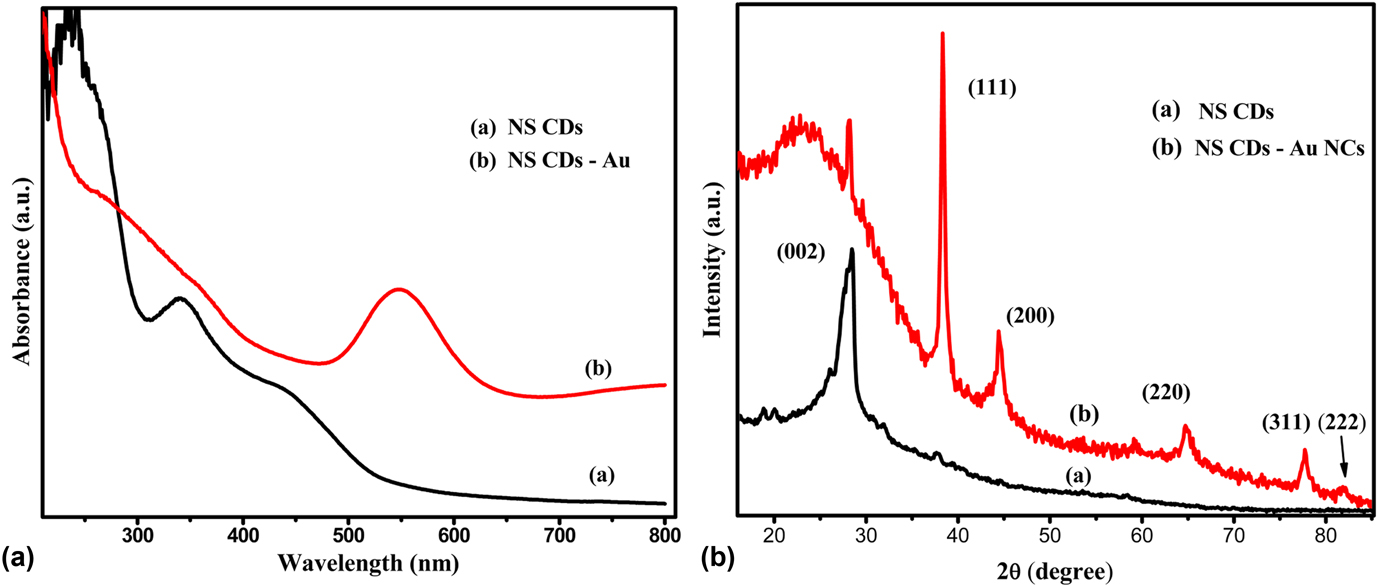
The aqueous solution of HAuCl4 was found to turn red on the addition of aqueous solution of NS CDs, and the appearance of the characteristic surface plasmon band of Au NPs at ∼550 nm in the UV-Visible spectrum of the reaction mixture suggests the formation of Au NPs, in situ, on the reduction of chloroauric acid by the CDs. Besides the surface plasmon band of the Au NPs,Reference Sergievskaya, Tatarchuk, Makotchenko and Mironov23 the UV-vis absorption spectrum of the sol also depicts distinct absorption bands [Fig. 1(a)] at ∼235 nm with a weak shoulder band at ∼340 nm and a broad tail extending over the visible range with a peak at 470 nm. The band at ∼235 nm and the shoulder at 340 nm may, respectively, be assigned to π–π* electronic transition associated with the aromatic conjugated system sp 2 domainsReference Nie, Li, Li, Liang, Tan, Sheng, Shi and Zhang24 and to the n–π* (C=O) transition of the surface carbonyl group (C=O).Reference Liu, Cui, Zhou, Wang and Zou25 The third absorption shoulder located at around 440 nm may be due to electronic transitions associated with the different functional groups (C=N, C=S, etc)Reference Nie, Li, Li, Liang, Tan, Sheng, Shi and Zhang24,Reference Wang, Kalytchuk, Zhang, Shi, Kershaw and Rogach26 present on the surface. However, the absorbance of shoulder peaks was reduced significantly by the addition of HAuCl4 in the UV Vis spectrum of NS CDs-Au NCs [Fig. 1(a)], probably due to the interaction of heteroatoms of NS CDs with gold. Besides these absorption shoulders, the characteristic absorbance peak of Au NPs appeared at around 550 nm in the spectrum and corresponded to surface plasmon resonance (SPR). The phase and crystallinity of the synthesized NS CDs and NS CDs-Au NCs were investigated by XRD, as shown in Fig. 1(b). XRD of NS-CDs shows a diffraction peak at 27.5° corresponding to the (002) crystal plane of the graphitic carbon structure,Reference Liu, Cui, Zhou, Wang and Zou25 whereas Bragg diffraction peaks of Au corresponding to (111), (200), (220), (311), and (222) planes appeared in the XRD pattern that matched well with the standard diffraction pattern of gold JCPDS File no. 04-0784. However, the appearance of the highly intense diffraction peak of Au at 38.31° indicates the predominant growth of the highly ordered Au(111) crystals plane. The average crystallite size (17.45 nm) of Au was calculated using the Debye Scherrer equation,Reference Riaz, Qi, Fang, Xu, Zhou, Jin, Hong, Zhi and Liu27 as shown in Fig. S2.
(a) UV visible spectra and (b) XRD of NS CDs and NS CDs-Au NCs.

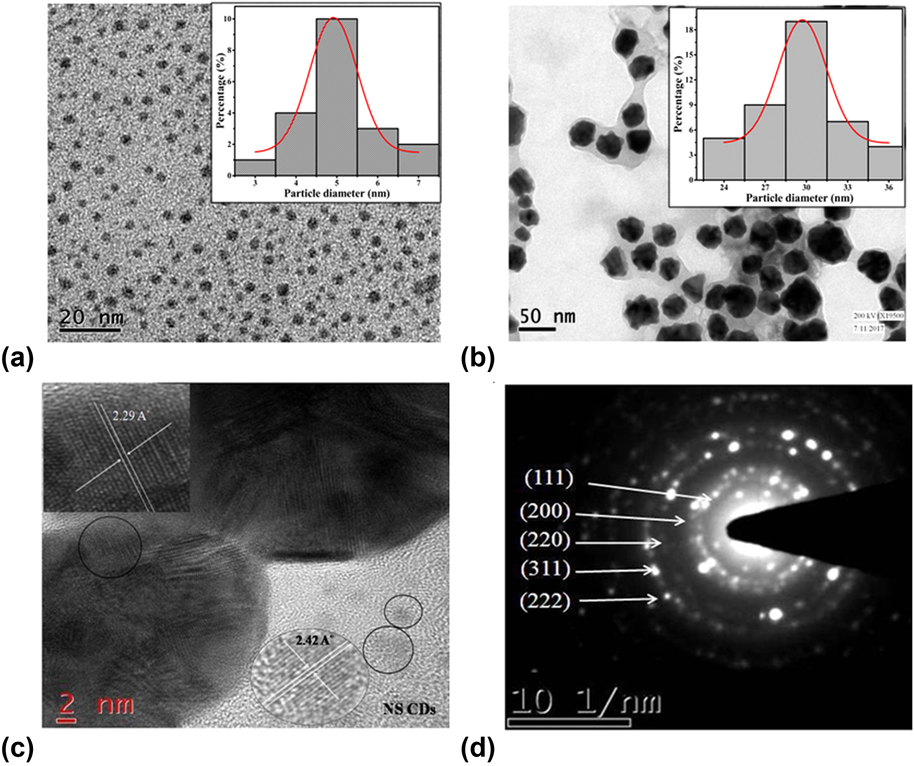
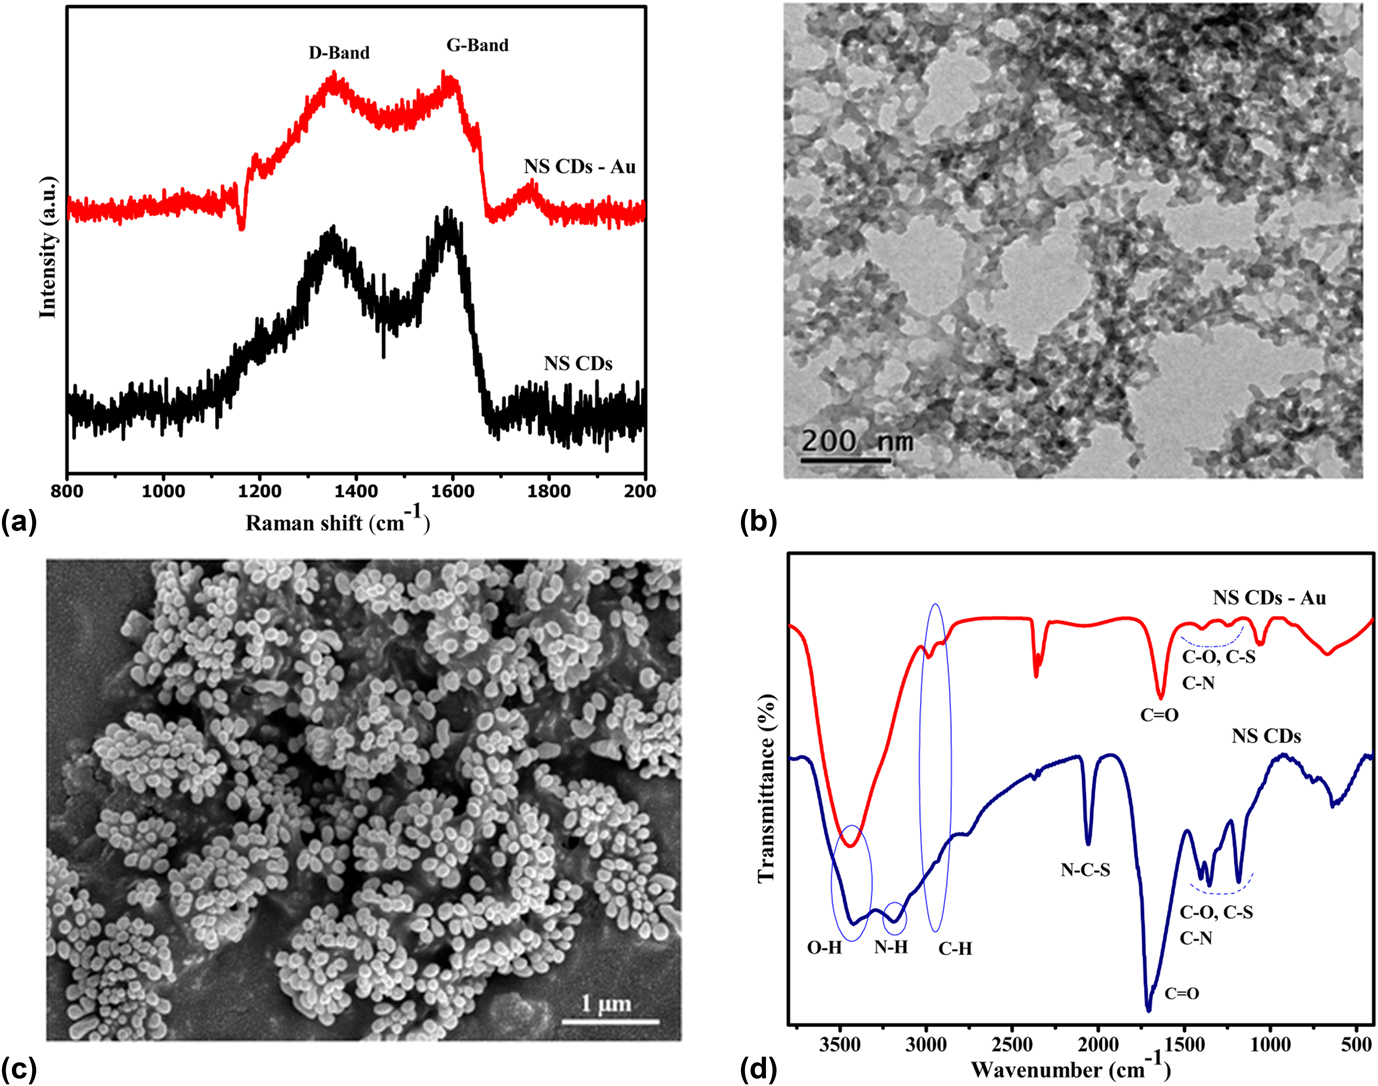
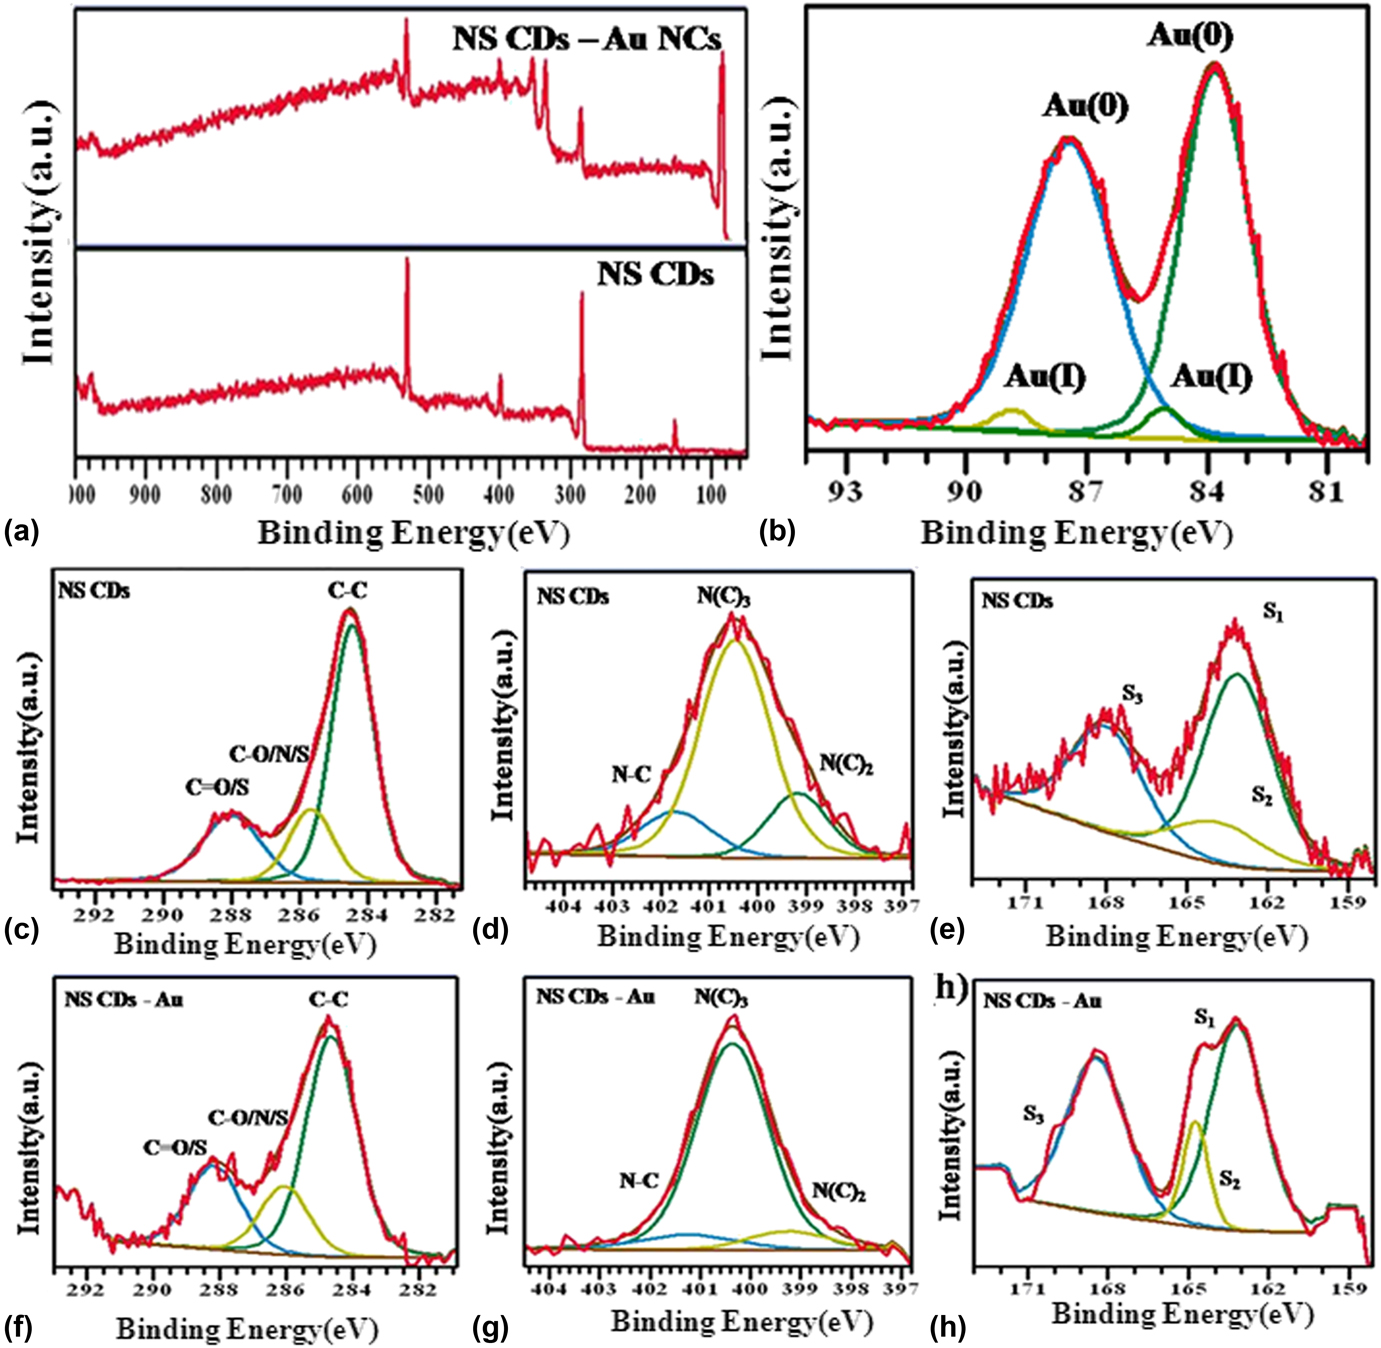
The size of the NS CDs and the Au NPs was determined by the TEM analysis, as shown in Figs. 2(a) and 2(b). It is clear from the TEM image that as-synthesized NS CDs have a narrow range of size distribution from 3 to 6 nm with an average particle size of 5 nm, whereas a broad range of size distribution (from 24 to 36 nm) was observed for Au NPs with an average diameter of 30 nm. The size distribution of NS CDs and NS CDs-Au NCs has been displayed by the histogram, as shown in the inset of Figs. 2(a) and 2(b), respectively. The broad range of size distribution of Au NPs ascertains that NS CDs act as a mild reducing agent for the reduction of chloroauric acid. In general, the use of a strong reducing agent, such as sodium borohydride, triggers instant nucleation and formation of small as well as uniform size and shaped Au NPs,Reference Agnihotri, Mukherji and Mukherji28 while a mild reducing agent such as sodium citrate produces larger particles with a broad range of size distribution.Reference Polte29 The HRTEM image shows clearly visible lattice fringes of NS CDs and Au NPs, as shown in Fig. 2(c). The interlayer spacing of NS CDs was measured to be 0.310 and 0.242 nm, which are well consistent with the graphitic plane (002) of graphene quantum dotsReference Gui, Liu, Jin, Wang, Zhang, Xia, Yang, Bi and Xia30 and the (1120) facet of graphene,Reference Qu, Zheng, Du, Zhou, Zhang, Li, Tan, Zhao, Xie and Sun31,Reference Peng, Gao, Gupta, Liu, Romero-Aburto, Ge, Song, Alemany, Zhan, Gao, Vithayathil, Kaipparettu, Marti, Hayashi, Zhu and Ajayan32 respectively. The lattice fringe of Au NPs was found to be 0.229 nm, which corresponds to the lattice spacing of the Au(111) crystal plane.Reference Blanco, Esteve-Adell, Atienzar, Casas, Hernandez and Quintana33 The SAED pattern [as shown in Fig. 2(d)] of NS CDs-Au NCs demonstrated concentric diffraction rings of bright spots corresponding to crystal planes of the face-centered cubic (fcc) unit cell of polycrystalline Au nanoparticles. Hence, the intense XRD peak and the lattice fringes of NS CDs confirmed the presence of the crystalline core which might be composed of sp 2 hybridized graphitic carbon atoms.Reference Qu, Zheng, Du, Zhou, Zhang, Li, Tan, Zhao, Xie and Sun31,Reference Messina, Sciortino, Popescu, Venezia, Sciortino, Buscarino, Agnello, Schneider, Gerthsen, Cannas and Gelardi34 Raman peaks [shown in Fig. 3(a)] centered at ∼1350 and ∼1590 cm−1 also confirmed the existence of the graphitic sp 2 carbon domain along with sp 3 carbon atoms in NS CDs. The peaks centered at ∼1590 and ∼1350 cm−1 are associated with the crystalline (G) band and disordered (D) band, respectively.Reference Wang, Ling, Wang, Long, Sun, Shi, Chen, Jing, Sun and Dai35 The intensity ratio of the disordered peak (I d) and graphitic peak (I g) was calculated to be 0.89 for NS CDs and 0.97 for the nanocomposites, which reveals the synthesis of graphitic carbon dots. The increase in the ratio of G and D band (I d/I g) suggests that the Au NPs are adsorbed on graphitic NS CDs to form NS CDs-Au NCs.Reference Yan, Xue, Berning, Lam and Lee36,Reference Xu, Gao and Guoxin37 However, the TEM and FESEM images [as shown in Figs. 3(b) and 3(c)] show that NS CDs appear as a polymeric network in aqueous solution due to the presence of heteroatoms, forming a variety of functional groups such as hydroxyl, carboxyl, amides, thiol, etc. These surface functional groups were affirmed by the FTIR spectra, as shown in Fig. 3(d). The IR spectrum of NS CDs shows that peaks at around 3430 and 3200 cm−1 can be assigned to O–H and N–H stretching vibrational bands of the carboxylic group and amides, respectively,Reference Fu, He, Wu, Wu and Wu38–Reference Lyu, Liu, Wang and Tian41 while the vibrational band located around 3200 cm−1 disappeared in the IR spectrum of the nanocomposites. The other vibrational stretching frequencies of C=O and C=N bonds can be seen ∼1700 cm−1 for NS CDs, whereas this peak shifted to the lower wave number (∼1650 cm−1) for NS CDs-Au NCs. The disappearance of the vibrational band corresponding to the amidic bond N–H str and shifting of carbonyl str frequency also infers the adsorption of Au NPs on graphitic NS CDs. The peaks around 1350 and 1400 cm−1 in the FTIR spectra of both NS CDs and the nanocomposites confirm the existence of C–S and C–N bonds, respectively.Reference Ding, Wei and Xiong42–Reference Chen, Wu, Weng, Wang and Li44 The high zeta potential value of NS CDs (−42.5 mV) and nanocomposites (−19.6 mV) is also substantiating the existence of overall negative surface functionalities which is well consistent with the FTIR result. The stability of colloidal dispersion of the catalyst is probably due to the high zeta potential value (negative) which remains almost consistent even after a couple of weeks of preparation. The images of colloidal dispersion of the catalyst (freshly prepared and after two weeks) have been shown in Fig. S3. The zeta potential graphs of as-prepared NS CDs and NS CDs-Au NCs are shown in Fig. S4. The presence of a considerable amount of these surface functional groups made carbon dots highly water soluble and hydrophilic in nature. To further confirm chemical composition and the electronic states of the NS CDs and NS CDs-Au NCs, XPS analysis was performed. The XPS full spectra of NS CDs and NS CDs-Au NCs are shown in Fig. 4(a). XPS spectra also validate the existence of carbon, nitrogen, oxygen, and sulfur in both the NS CDs and the nanocomposite. Along with these binding energy peaks, an additional peak appeared in the spectrum of the NS CDs-Au NCs at ∼85 eV for Au NPs. The distinct peaks located at 164, 221, 284, 399, and 530 eV in the spectra of NS CDs and NS CDs-Au NCs can be assigned to S 2s, S 2p, C 1s, N 1s, and O 1s signals, respectively.Reference Liu, Cui, Zhou, Wang and Zou25 The high resolution C 1s XPS spectrum [shown in Fig. 4(c)] of NS CDs displays three characteristic binding energies of the carbon structure which correspond to sp 2 C (C=C) at 284.5 eV, sp 3 C (C–N, C–O, C–S) at 285.6 eV, and C=O/C=N at 288.0 eV, while these peaks appeared at 284.5, 286.01, and 288.2 eV, respectively, for NS CDs-Au NCs [shown in Fig. 4(f)].Reference Liu, Cui, Zhou, Wang and Zou25,Reference Dong, Pang, Yang, Guo, Shao, Chi, Li and Yu45,Reference Liu, Gao, Zhou and Ma46 Shifting of these energy peaks to a higher value confirmed that Au NPs are attached to the carbon heteroatom of the polymeric network of NS CDs.Reference Lim, Kim, Lee, Stach, Culver and Harris47,Reference Das, Dickinson, Lafir, Brougham and Marsili48 Reports also suggest that the metal intercalation in graphene or graphite also cause a positive shift in the binding energy of C 1s due to induced defects.Reference Rani, Lim, Oh, Kim, Lee, Kim, Shin, Kim and Jun49,Reference Estradeszwarckopf and Rousseau50 Figure 4(b) shows the existence of metallic Au(0) and Au(I) in the nanocomposites which were also validated by the appearance of 4f-doublet peaks.Reference Park and Shumaker-Parry51,Reference Al-Johani, Abou-Hamad, Jedidi, Widdifield, Viger-Gravel, Sangaru, Gajan, Anjum, Ould-Chikh, Hedhili, Gurinov, Kelly, El Eter, Cavallo, Emsley and Basset52 The doublet peaks of Au(0) are positioned at the binding energy of 83.8 (4f 7/2) and 87.4 (4f 5/2) eV separated by an energy difference of 3.6 eV, which is well consistent with XRD observations.Reference Cho, MacCuspie, Gigault, Gorham, Elliott and Hackley53–Reference Mohrhusen and Osmic55 The N 1s spectrum of the NS CDs and the NS CDs-Au NCs can also be resolved into three different regions, as shown in Figs. 4(d) and 4(g). The N 1s deconvoluted spectra of NS CDs show three peaks at ∼399.2 eV, ∼400.3 eV, and ∼401.3 eV, which can be attributed to pyridinic N or C–N–C, pyrrolic N or N–C3, and amidic N, respectively.Reference Ju and Chen56–Reference Dey, Chithaiah, Belawadi, Biswas and Rao58 These peaks can be seen for the nanocomposites also with a slightly higher value that are 399.2, 400.4, and 401.6 eV for pyridinic N, pyrrolic N, and amidic N, respectively. Similarly, the deconvoluted S 2p complex peaks of NS CDs [Fig. 4(e)] and NS CDs-Au NCs [Fig. 4(h)] also revealed the presence of three different peaks corresponding to 2p 3/2 (S1), 2p 1/2 (S2), and some oxidized form of sulfur (S3). The S1 and S2 peaks are the result of spin orbit coupling of 2p 3/2 and 2p 1/2 components of thiophenic sulfur atoms.Reference Kelemen, Afeworki, Gorbaty, Sansone, Kwiatek, Walters, Freund, Siskin, Bence, Curry, Solum, Pugmire, Vandenbroucke, Leblond and Behar59 The S1 peak is appeared at ∼163.2 eV for both NS CDs and the nanocomposites (NCs), but the peak position of S2 and S3 shifted from 164.2 to 164.4 eV and 168.0 to 168.3 eV, respectively, due to the interaction of sulfur of NS CDs and Au NPs.Reference Liu, Cui, Zhou, Wang and Zou25,Reference Qu, Zheng, Du, Zhou, Zhang, Li, Tan, Zhao, Xie and Sun31
TEM image of (a) NS CDs (sample prepared in ethanol), (b) NS CDs-Au NCs with a particle size distribution histogram in the inset, respectively, (c) lattice fringes (HRTEM image), and (d) SAED pattern of NS CDs-Au NCs.

(a) Raman spectra of NS CDs and NS CDs-Au NCs, (b) TEM image of NS CDs (sample prepared in water), (c) FESEM image of NS CDs-Au NCs, and (d) FTIR spectra of NS CDs and NS CDs-Au NCs.

(a) XPS survey of NS CDs and NS CDs-Au NCs and (b) deconvoluted spectra of Au 4f, (c–h) high resolution spectra of C 1s (c and f), N 1s (d and g), and S 2p (e and h) of NS CDs and NS CDs-Au NCs, respectively.

IV. CATALYTIC STUDY
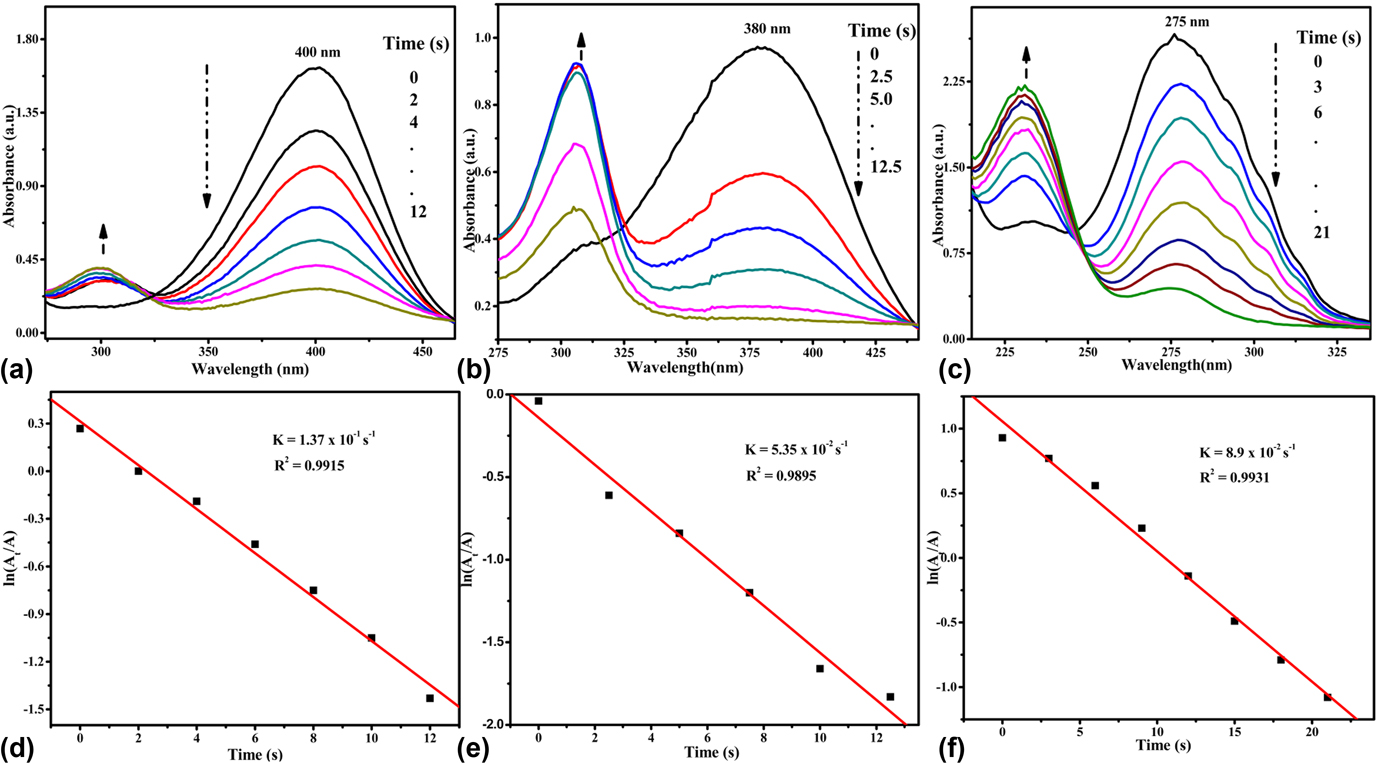
The catalytic activity of the synthesized NS CDs-Au NCs was investigated by the reduction of 4-nitrophenol (4-NP) as a model reactionReference Liu, Ding, Zhu, Wang, Chen, Shao, Chen, Zheng, Zhao and Qian60 and also tested on some other nitroaromatic compounds (NACs) such as nitrobenzene (NB) and 4-nitroaniline (4-NA). These reactions were monitored using a UV-vis spectrometer in the presence of excess of NaBH4 in an aqueous medium. Figures 5(a)–5(c) show that the absorption peak of 4-NP, NB, and 4-NA appeared at 400, 275, and 380 nm, respectively, in the presence of NaBH4 at room temperature. The conversion of 4-NP to corresponding aminophenol was also tested in the absence of the catalyst (as shown in Fig. S5), and no change in the intensity of the absorption spectrum was noticed. However, there was a rapid decrease in the intensity of absorbance maxima for all NACs in the presence of the NS CD-Au NC catalyst, as shown in Fig. 5. This implies that even the availability of the excess amount of NaBH4 was unable to trigger the reduction process of aromatic nitro groups in the absence of the catalyst. Therefore, the UV Visible spectra of the mixture of NACs and NaBH4 have been treated as the control. It is also important to mention that the presence of a catalyst does not have an effect on the absorbance spectra of NACs because of the very low concentration of the catalyst. However, it is evident from the absorbance spectra that the absorbance maxima of NACs rapidly decreased and almost vanished within 21 s, while a new peak appeared for all the NACs at a lower wavelength to their absorbance maxima. The UV Visible spectra demonstrate the presence of one isosbestic point for each NAC, confirming the presence of a couple of compounds that are the amino aromatics and the nitroaromatics.Reference Li, Wang, Wang, Wang and Li61 The steady increase in the relative intensity of new peaks and successive decrease in the absorbance maxima of NACs with time establish the role of NS CDs-Au NCs as a catalyst in the reduction process. The increased pH (due to excess amount of NaBH4) and the ice cold condition of freshly prepared NaBH4 aqueous solution ensure the availability of BH4− in the reaction medium by retarding its rapid decomposition to release hydrogen gas. The gradual release of hydrogen gas in the form of bubbles not only prevents the aerial oxidation of amino aromatics but also serves to stir the reaction mixture. Since the relative concentration of NaBH4 in the reaction system is very high compared to NACs, the rate of the reaction can be treated as independent of the concentration of borohydride ions. Therefore, the apparent reduction rate constant (k) of these reactions can be determined by applying pseudo-first-order kinetics with respect to the concentration of NACs.Reference Wu, Lu, Wei, Shen and Xie62 The pseudo-first-order kinetic equation can be written asReference Konar, Kalita, Puvvada, Tantubay, Mahto, Biswas and Pathak63
 $$- \ln \left( {{{{C_t}} \over {{C_0}}}} \right) = - \ln \left( {{{{A_t}} \over {{A_0}}}} \right) = kt\quad ,$$
where C 0 and C t are the concentrations of NACs at the time t and 0, respectively, while A t and A 0 are the absorbance maxima of NACs at time t and 0, respectively. The apparent reduction rate constant of 4-NP, 4-NA, and NB was determined from the slopes of the respective straight lines obtained by plotting ln(C t/C 0) against t [shown in Figs. 5(d)–5(f)]. The calculated k values of 4-NP, 4-NA, and NB were 1.37 × 10⁻¹, 8.9 × 10⁻², and 5.35 × 10⁻² s−1, respectively. The turn over frequency (TOF) of the NS CD-Au NC catalyst for the reduction of 4-NP, 4-NA, and NB are 7.45 × 10²¹, 5.89 × 10²¹, and 2 × 10²² molecules g-1s-1, respectively, calculated by the moles of NACs reduced by per mole of Au per consumed time under the present reaction conditions. The catalytic activity of NS CDs-Au NCs for the reduction of NACs was among the highest compared with the catalytic activities of other reported bare Au NPs or the Au nanocomposites.Reference Zhu, Han, Hu and Dong64–Reference Li, Chi, Yang, Zhang, Yue and Wang69 This high catalytic activity of the NS CD-Au NC catalyst is due to the presence of carbon dots which are well known to exhibit a polymeric network in aqueous solution. The polymeric network of carbon dots not only immobilized Au nanoparticles but also enabled the adsorption of NACs on its surface by its high surface charges through possible hydrogen bonding and electrostatic attractions. The specific BET surface area and average pore size of NS CDs were found to be 47.48 m2/g and 2.1 nm, respectively, as shown in Fig. S7.
Time-dependent UV Vis spectra of for the reduction of (a) 4-NP, (b) 4-NA, and (c) NB (e) by NS CDs-Au NCs in the presence of excess of borohydride. Plot of ln A t/A 0 versus time (s) of (d) 4-NP, (e) 4-NA, and (f) NB, respectively, using NS CDs-Au NCs.

V. CATALYTIC MECHANISM
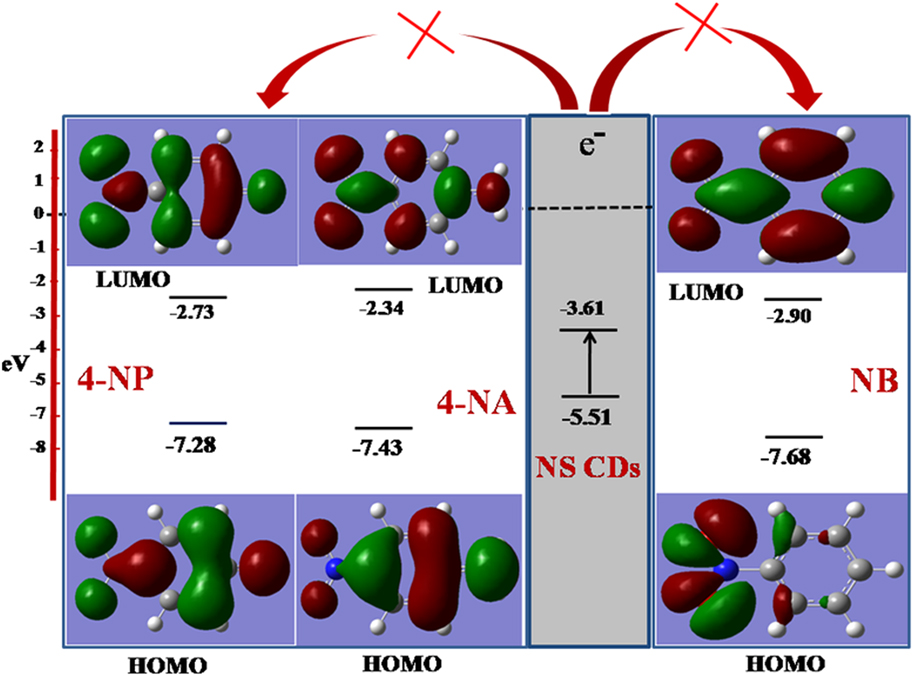
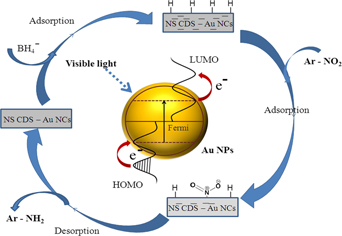
Heteroatoms of NS CDs are the stem of a variety of surface functional groups, which form a polymeric network in aqueous solution having an active surface for the adsorption of substrates (NACs) and borohydride ions The Langmuir–Hinshelwood model is one of the most commonly used approaches for heterogeneous catalysis (fluid solid catalytic reaction), which also claims that electron transfer takes place from the donor to acceptor through the adsorption of reactant molecules on the surface of a catalyst.Reference Li, Han, Wang, Zheng, Wan and Ni70 Carbon dots are well documented to act as an electron donor as well as an electron acceptor depending upon the nature of other moiety. To examine the energetically favorable condition for electron transfer from NS CDs to NACs, HOMO (highest occupied molecular orbital) and LUMO (lowest unoccupied molecular orbital) of NS CDs and NACs were determined. The HOMO–LUMO energy level of NS CDs and NACs was determined using cyclic voltametry (shown in Fig. S6) and the DFT calculations, respectively. Geometry optimization and the molecular orbital (HOMO LUMO) calculations of NACs were performed at the DFT/B3LYP level (included in Gauss View 3.07 package) using the 6-311G basis set. Energy calculations reveal that electron transfer from LUMO of NS CDs to LUMO of NACs is energetically not favorable, as shown in Fig. 6. However, a high zeta potential value (−20 mV) and the polymeric network (matrix) of NS CDs may be facilitating the reduction process by making stable dispersion of the catalyst in aqueous solution and by providing an active surface for the adsorption of NACs, borohydride, and Au NPs together. The reduction of NACs by the as-prepared NS CD–Au NC catalyst, in the presence of excess of NaBH4, can schematically be presented as Fig. 7.
Presentation of HOMO LUMO energy levels of NACs and NS CD-Au NC catalyst.

Schematic presentation of the reduction of NACs by NS CD-Au NC catalyst in the presence of excess of sodium borohydride.

VI. CONCLUSION
In the present study, NS CDs were prepared through microwave irradiation-assisted carbonization of aqueous solutions of citric acid and thiourea, and their aqueous solution served as a green reducing agent for in situ synthesis of Au NPs from chloroauric acid and the formation of the stable colloidal sol of the NS CDs-Au NCs thereby circumvented the use of harsh chemicals. The surface functionality of the NS CDs favors immobilization of the Au NP catalyst through surface conjugation and hence impedes the chance of agglomeration during the catalytic process. N and S co-doping in NS CDs promoted the generation of active sites for the nucleation and growth of Au NPs due to possibilities of interstitial defects and vacancies; improved the chemical reactivity and acid–base properties of the CD surface; increased electronic interaction between Au NPs and the support; and accelerated electron transfer in the CD-Au NP nanocomposite catalytic system. Thus, the study puts forward N, S doped carbon dots and Au NP nanocomposites (i.e., NS CDs-Au NCs) as a highly stable and efficient catalytic system for the hydrogenation of nitroaromatics (NACs) [such as 4-nitrophenol (4-NP), nitrobenzene (NB), and 4-nitroaniline (4NA)] to their corresponding aminoaromatic compounds in the presence of excess of NaBH4. The apparent rate constants (k app) of the catalytic reduction of the NACs were found to follow the pseudo-first-order kinetics with the value (1.37 × 10⁻¹ s−1) for the reduction of 4-nitrophenol to 4-aminophenol being higher than those in the literature so far.
Supplementary Material
To view supplementary material for this article, please visit https://doi.org/10.1557/jmr.2018.324.