INTRODUCTION
Trottoir à vermets (Pérès & Picard, Reference Pérès and Picard1952) are biogenic constructions (sensu Laborel, Reference Laborel1987) located in warm-temperate areas such as the Atlantic Ocean and the Mediterranean Sea and formed by the gastropod species Dendropoma petraeum (Monterosato, 1884).
They grow perpendicular to the coastline, from land to sea, forming flat horizontal reefs lining most rocky calcareous shores in which a well developed community is found (Orlando, Reference Orlando1978; Chemello, Reference Chemello1989; Safriel & Ben-Eliahu, Reference Safriel, Ben-Eliahu, Bell, McCoy and Mushinsky1991; Mannino, Reference Mannino1992; Pandolfo et al., Reference Pandolfo, Chemello and Riggio1992a, Reference Pandolfo, Chemello and Riggiob).
These highly indented structures are documented to inhabit the rocky coasts of temperate and tropical seas (Keen, Reference Keen1961), with the isolated exceptions of the Caribbean Sea (Jones & Hunter, Reference Jones and Hunter1995) and the Island of Fernando de Noroña in Brazil (Kempf & Laborel, Reference Kempf and Laborel1968); the most important constructions are found in the Mediterranean Sea. In this basin vermetid platforms are always located along the shores below the 14°C winter isotherm (Chemello et al., Reference Chemello, Dieli and Antonioli2000) and were first reported from along the coast of Isola delle Femnine, near Palermo (northern Sicily, central Mediterranean) by the French naturalist De Quatrefages (Reference De Quatrefages1854). A century later, Molinier & Picard (Reference Molinier and Picard.1953) gave a detailed description of the same locality and suggested a correlation with similar bio-constructions located along the Algerian coast (Perés & Picard, Reference Pérès and Picard1952). In the eastern Mediterranean, Safriel (Reference Safriel1966, Reference Safriel1974, Reference Safriel1975) described intertidal reef-like structures from along the coasts of Israel; vermetid platforms are present along the coast of Lebanon (Dalongeville, Reference Dalongeville1977; Bitar & Bitar-Kouli, Reference Bitar and Bitar-Kouli1995a, Reference Bitar and Bitar-Koulib), southern Turkey (Laborel, Reference Laborel1987), Crete (Kelletat, Reference Kelletat1979; Laborel, Reference Laborel1987), Malta (Azzopardi, Reference Azzopardi1992), Algeria (Molinier & Picard, Reference Molinier and Picard.1953), Corsica (Molinier, Reference Molinier1955a, Reference Molinierb) and Spain (Templado et al., Reference Templado, Templado, Calvo, Giusti and Manganelli1992).
In Sicily trottoir à vermets are located along Tyrrhenian coasts, between the Cefalu promontory and Trapani coast, and inside the Egadi Islands. Some of the thick formations are placed to the south-east Ionian coast, near Siracusa; some other small constructions are situated along the southern shores of the Lampedusa and Ustica Islands.
The vermetid formations located at the north side of the Capo Milazzo promontory have never been studied. This area, a large plateaux (45.18 ha) located on the northern coast of Sicily (southern Tyrrhenian Sea), particularly interesting for marine and terrestrial fauna and flora, was proposed as a Site of Community Interest (SIC; Council Directive 92/43/EEC of 21 May 1992). The Directive is intended to ensure biodiversity by conserving natural habitats and wild fauna and flora in areas such as this.
In the Mediterranean, vermetid reefs have been studied concerning malacofauna (Orlando, Reference Orlando1978; Chemello, Reference Chemello1989; Pandolfo et al., Reference Pandolfo, Chemello and Riggio1992a, Reference Pandolfo, Chemello and Riggiob; Reference Pandolfo, Chemello, Ciuna, Lo Valvo and Riggio1996), dimensional analyses of the trottoir (Chemello, Reference Chemello1989; Badalamenti et al., Reference Badalamenti, Chemello, Gristina, Riggio and Toccaceli1992a, Reference Badalamenti, Chemello, Gristina, Riggio and Toccacelib;), polychaete communities (Ben-Eliahu, Reference Ben-Eliahu1975, Reference Ben-Eliahu1976, Reference Ben-Eliahu1977a, Reference Ben-Eliahub; Safriel & Ben-Eliahu, Reference Safriel, Ben-Eliahu, Bell, McCoy and Mushinsky1991; Badalamenti et al., Reference Badalamenti, Chemello, D'Anna and Riggio1998) and algae (Mannino, Reference Mannino1992).
Even though in the Mediterranean Sea, several authors have investigated fish fauna from different rocky bottoms (Bell, Reference Bell1983; Harmelin, Reference Harmelin1987; Garcia-Rubies & Zabala, Reference Garcia-Rubies and Zabala1990; Francour, Reference Francour1994; MacPherson, Reference MacPherson1994; Dufour et al., Reference Dufour, Jouvenel and Galzin1995; Fasola et al., Reference Fasola, Canova, Foschi, Novelli and Bressan1997; Sala, Reference Sala1997; Sala & Boudouresque, Reference Sala and Boudouresque1997), studies on fish assemblages associated with vermetid reef habitats are scanty (Goren & Galil, Reference Goren and Galil2001) and comparisons among fish assemblages associated with vermetid reefs and those from other nearshore rocky bottoms are not available.
Therefore, the main objectives of this study were to: (i) characterize the fish assemblages inhabiting the shallow rocky bottoms of Cape Milazzo; (ii) assess differences in the assemblage parameters and total density among a habitat characterized by vermetid formations and two other rocky bottom habitats; and (3) determine if there were habitat preferences of some common inshore fish species.
MATERIALS AND METHODS
Study area
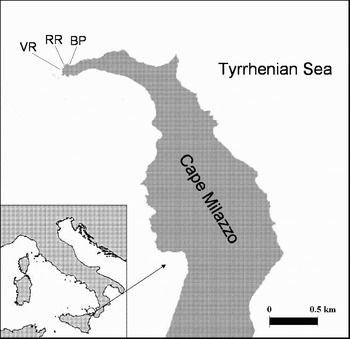
Fish assemblages associated with shallow (i.e. 0–3 m depth) rocky bottoms along the coast of Cape Milazzo (Figure 1) were investigated at three selected habitats, each represented by a different degree of complexity and namely vermetid reef (VR), rocky-algal reef (RR) and boulder and pebbles (BP). All three habitat types were sampled in the same area located along the northern coast of Cape Milazzo.
Sampling area: Cape Milazzo with the three investigated habitats: vermetid reef (VR), rocky-algal reef (RR) and boulder and pebbles (BP).

The first habitat (VR) was represented by a vermetid reefs formation rich in crevices and other shelters. The trottoir of Milazzo Cape, as well those in north-western Sicily, are complex systems which share the major features of mid and infralittoral levels and include many microhabitats. In fact, according to Chemello (Reference Chemello1989), a typical vermetid platform can be divided into a number of different zones: (i) Lythophillum lichenoides cushions, the biological marker of the inner margin of the vermetid platforms; (ii) one or more ‘cuvettes’, little pools which remain covered by seawater and separated from each other by small vermetid crests; (iii) an elevated outer margin; and (iv) the upper infralittoral fringe characterized by a ‘facies’ of the Phaeophycaea Cystoseira amentacea var. amentacea. At the beginning, the bottom goes down suddenly to 1–2 m and then gently, and it is composed primarily of rocky boulders of diverse size. Moreover, vermetid ledges growing also on the surface abrasion blocks scattered at the base of the cliff, yield mushroom structures.
The RR was represented by a heterogeneous hard substrate. The third habitat (BP) was characterized by a gently slopping bottom with pebbles and boulders of different size.
Cover types at the sampling habitats were quite similar; algal cover was mainly composed of a small turf of brown algae, such as Dictyota dichotoma (Hudson) Lamoroux and Cystoseira spp.; small patches of Acetabularia acetabulum (L.) Silva and Padina pavonica (L.) Thivy were also present on flat rocks and boulders.
Sampling techniques
Sampling was carried out in June 2005, within the space of a short time lapse (three weeks) to prevent temporal bias and only during excellent weather conditions (i.e. low winds and hydrodynamics and high water transparency). The survey was conducted at three selected habitats, during day time (10 a.m. and 2 a.m.), using a strip transects underwater visual census technique (Harmelin-Vivien et al., Reference Harmelin-Vivien1985). Given the shallow depth (0–3 m), assessment was carried out by snorkelling to evaluate species' composition and number of fish along 20 m long and 2 m wide transects (total surface area 40 m2) parallel to the coastline. At the VR habitat, transects were performed immediately under the upper infralittoral fringe of the platforms.
The ‘transect’ technique was chosen from among the available visual approaches as it is the most suitable for both smaller specimens and fast-swimming species (Harmelin-Vivien & Francour, Reference Harmelin-Vivien and Francour1992; Francour, Reference Francour1997).
Twelve replicates were performed at each habitat by a single diver, in order to minimize the bias associated to the subjectivity of different observers.
Census accuracy is influenced by the observer's swimming speed (Lincoln Smith, Reference Lincoln Smith1988, Reference Lincoln Smith1989; De Girolamo & Mazzoldi, Reference Di Girolamo and Mazzoldi2001), which must be adjusted in relation to the target species' behaviour and substratum heterogeneity. It is clear that evaluating all the species occurring along a transect using one census only, although less time consuming, can give very biased estimates. To avoid such a bias two censuses were carried out along the same transect: one at higher speed (6 m/minute), to census nectobenthic fish and one at low speed (3.5 m/minute), to census benthic and cryptobenthic fish (De Girolamo & Mazzoldi, Reference Di Girolamo and Mazzoldi2001). Each fish recorded was assigned to one of three size-classes, i.e. small, medium, and large, corresponding to the lower, intermediate and upper 33% range of sizes reported in the literature for each species (Fischer et al., Reference Fischer, Bauchot and Schneider1987).
Juvenile stages (i.e. settlers and recruits) were excluded from the study, since their numerical contribution may greatly influence mean values.
Abundance of fish was estimated using a scale based on a geometric progression factor approximately of 2 (1, 2–5, 6–10, 11–30, 31–50, 51–100, 101–200, 201–500, >500 individuals), and fish density (number of individuals 40 m−2) was estimated by considering the mid-point of each abundance class (Harmelin-Vivien et al., Reference Harmelin-Vivien1985; Francour, Reference Francour1997).
As a descriptor of habitat complexity we measured rugosity which was estimated as the ratio L/l between real length (L) measured with a chain contoured over the bottom and extended transversely to the transect centre line, and linear distance between the chain's endpoints (l = 2 m) (Luckhurst & Luckhurst, Reference Luckhurst and Luckhurst1978). This measure was repeated 5 times at regular intervals along all transects. All these measurements were averaged to obtain the final complexity value for each habitat type.
Statistical analysis
The study used an experimental design with a single factor ‘habitat’ and 3 levels: RR, VR and BP.
The Kruskal–Wallis test was applied to assess differences between habitats complexity.
Permutational multivariate analysis of variance (PERMANOVA) (Anderson, Reference Anderson2001a; McArdle & Anderson, Reference McArdle and Anderson2001) was used to analyse the multivariate data set in response to the complete experimental design. This method allows multivariate data to be analysed on the basis of any distance or dissimilarity measure of choice, in response to any complex experimental design, with P values obtained using permutations.
There were 39 species variables, each transformed to log (x + 1) so that each species contributed fairly evenly to each analysis (Clarke, Reference Clarke1993). Bray–Curtis dissimilarities were calculated between all pairs of observations for ensuing analyses (Bray & Curtis, Reference Bray and Curtis1957). For PERMANOVA we used 4999 unrestricted random permutations of the raw data (Anderson, Reference Anderson2001b).
Non-metric multidimensional scaling (MDS; Kruskal & Wish, Reference Kruskal and Wish1978) was used to visualize multivariate patterns among plots on the basis of the Bray–Curtis dissimilarities. MDS is an unconstrained ordination method and thus allows patterns in overall dispersion and potential differences in relative within-group dispersion to be visualized (Willis & Anderson, Reference Willis and Anderson2003).
The assemblage structure for each transect was developed by calculating species richness (S = number of species), diversity (by the Shannon–Wiener index, H′ sp = −∑pi log2 pi, where pi is the proportion of the total sample belonging to the ith species), evenness (J = Hs′ p log S−1) (Pielou, Reference Pielou1966), total density and species density (number of individuals 40 m−2). At the three habitats, mean density and frequency of occurrence were evaluated for all the investigated species.
To test for differences over habitats in the assemblage variables (S, H′, and J) and total density, a one-way analysis of variance (ANOVA) was used. Homogeneity of variances was tested by Levene's test; whenever necessary, data were transformed (generally to log x + 1) and tested again (Underwood, Reference Underwood1997). When transformation did not produce homogeneous variances, α = 0.01 was used to make up for the increased likelihood of Type 1 error (Underwood, Reference Underwood1981). Post hoc multiple comparisons after ANOVA were made by the Student–Newman–Keuls test (Underwood, Reference Underwood1997). ANOVA was also used to test the null hypothesis that there were no differences in the abundances of 12 of the most abundant species among habitats. As regards Diplodus vulgaris and D. sargus ANOVA was also used to test that there were no differences in the abundance of each size-class among habitats. ANOVAs were performed using the Statistica software package.
RESULTS
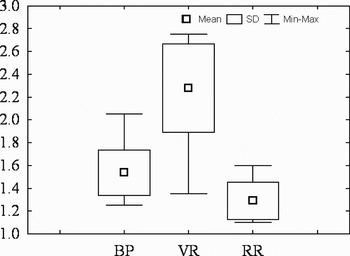
The mean complexity value, standard deviation and range for each habitat are represented in Figure 2. The Kruskal–Wallis test detected significant differences between habitats complexities (Kruskal–Wallis-H 2,180 = 116.408, P = 0.000) and, as expected, the habitat with the highest complexity was represented by the VR formations (mean value = 2.27; SD = ±0.38).
Box and whisker plot showing mean values of complexity for each habitat (BP, boulder and pebbles; VR, vermetid reef; RR, rocky algal reef).

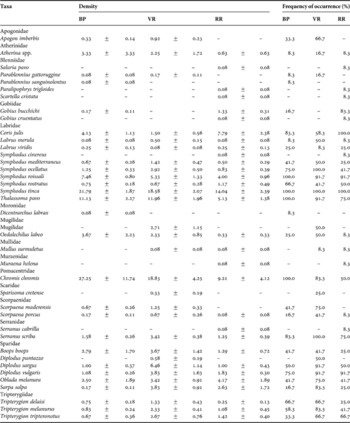
A total of 39 fish taxa belonging to 15 families was recorded (Table 1) over the three habitats investigated. Atherinidae and most of Mugilidae species were not identified at species level due to the difficulty of the specific determination by direct visual observations. A comparable total number of species (total species richness) was recorded at each habitat (28 at BP, 29 at VR and 31 at RR). Twenty-two species were common among the three habitats. The family with a higher number of species were wrasses (Labridae with ten species), sea breams (Sparidae with six species) and combtooth blennies (Blenniidae with 5 species). Quantitative data on mean species density and frequency of occurrence are reported in Table 1. The most abundant species were Chromis chromis, Symphodus tinca, Thalassoma pavo, Symphodus roissali and Coris julis with a total density (all the habitats pooled) ranging between 18.4 and 4.4 individuals per 40 m2. Of the 39 taxa recorded, S. tinca was ubiquitous (f = 100%) being observed within each habitat and site. Salaria pavo, Paralipophrys trigloides, Scartella cristata, Gobius cruentatus, Dicentrarchus labrax, Mugilidae, Muraena helena, Sparisoma cretense, Serranus cabrilla and Diplodus puntazzo occurred only on one habitat with a low density.
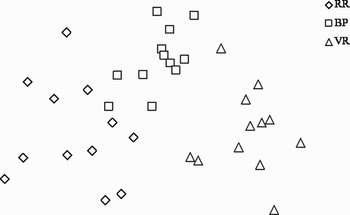
Non-metric multidimensional scaling plot of fish assemblages at the three selected habitats of Cape Milazzo. Stress value = 0.08 (BP, boulder and pebbles; VR, vermetid reef; RR, rocky algal reef).

Mean density (number of individuals per 40 m2, ± SE) and frequency of occurrence of the fish species observed over the three habitats (BP, boulder and pebbles; VR, vermetid reef; RR, rocky algal reef).

SE, standard error.
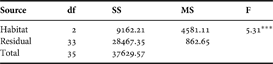
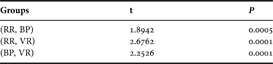
The PERMANOVA test (Table 2) detected significantly different fish assemblages between the three habitats. Pairwise comparisons (Table 3) showed significant differences in assemblages of fish among the three habitats selected. The results of statistical tests were confirmed by the (unconstrained) metric MDS plot of the Bray–Curtis distances (Figure 3).
Non-parametric multivariate analysis of variance (permutational multivariate analysis of variance) on the basis of Bray–Curtis dissimilarities for fish assemblages after log (x + 1) transformation.

*P < 0.05; **P < 0.01; ***P < 0.001.
P-values for non-parametric multivariate analysis of variance pair-wise comparisons among habitats, using 4999 permutations.

Significant levels: P < 0.05 significant; P < 0.01 very significant; P < 0.001 highly significant (BP, boulder and pebbles; VR, vermetid reef; RR, rocky algal reef).
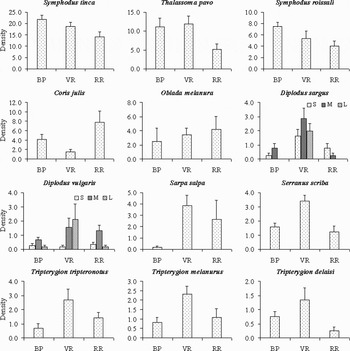
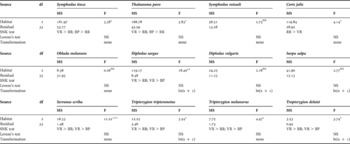
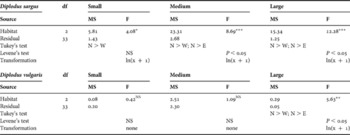
The ANOVA results (Table 4) indicated significant differences among habitats in most of the species indicated in Figure 4. Diplodus sargus, S. scriba and the three Tripterygiidae species were more abundant at VR. Thalassoma pavo and S. tinca were more abundant over the VR and BP habitats side of Cape Milazzo than over the RR. In particular, the peacock wrasse reached the highest density on the BP habitat, where, on average, 22 specimens per 40 m2 were evaluated. Statistical comparison did not detect habitat preferences in S. roissali, O. melanura, D. vulgaris and S. salpa. As far as the size is concerned, small, medium and even more, large-sized specimens of D. sargus were significantly more abundant over the VR habitat side than the other two (Table 5). Diplodus vulgaris showed the same patterns of spatial distribution related to size as observed for D. sargus. Large-size individuals of D. vulgaris, in fact, were significantly more abundant over the VR habitat, while small and medium D. vulgaris did not display any differences among habitats.
Mean density (± SE; number of individuals 40 m−2) of the most abundant fish species observed over the three habitats along the island coasts. For Diplodus sargus and Diplodus vulgaris average densities are given also in relation to size (S, small; M, medium; L, large; BP, boulder and pebbles; VR, vermetid reef; RR, rocky algal reef).

Results of analysis of variance used to test for differences in the density of dominant species over the investigated habitats.

*P < 0.05; **P < 0.01; ***P < 0.001; NS, not significant; BP, boulder and pebbles; VR, vermetid reef; RR, rocky algal reef; SNK, Student–Newman–Keuls.
Results of analysis of variance comparing density of the two important commercial species Diplodus sargus and Diplodus vulgaris in relation to the size-class in each of the three habitats (BP, boulder and pebbles; VR, vermetid reef; RR, rocky-algal reef).

NS, not significant.
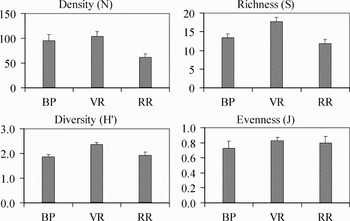
Average values of density (N), species richness (S), diversity (H′) and evenness (J) of the whole fish assemblage by habitats are given in Figure 5. Significant differences in total density were recognized by ANOVA in relation to habitats (Table 6). Mean fish density was significantly higher both over VR and BP than over RR. Species richness and diversity (H′) were usually higher over the VR habitat than at the other two: these differences between habitats were highly significant. The value of J varied significantly among habitats: the highest value was recorded over VR whereas no differences among site occurred for J. In summary, the highest assemblage variable values were found over the VR habitat.
Mean ± SE density (N), species richness (S), diversity (H′) and evenness (J) for the three habitats (BP, boulder and pebbles; VR, vermetid reef; RR, rocky algal reef).

Results of analysis of variance and multiple comparisons used to test for differences in the assemblages variables and fish density over the investigated habitats.

*p < 0.05; **p < 0.01; ***p < 0.001; NS, not significant; BP, boulder and pebbles; RR, rocky-algal reef; VR, vermetid reef.
DISCUSSION
The present study detected significant differences among the three identified habitats. These differences, observed both by multivariate and univariate approaches, were either in fish assemblages' structure, in the assemblage parameters or in the abundances of some common species.
The results indicate firstly that shallow rocky shores around Cape Milazzo were inhabited by a diversified benthic fish assemblage made up of 39 fish taxa. The value of species richness (29) recorded at the vermetid habitat was, anyway, lower than that recorded by Goren & Galil (Reference Goren and Galil2001) along a VR off the coast of Israel (36 fish taxa).
In our study the highest values of mean species richness (S), diversity (H′), evenness (J) and density (N) occurred over a VR habitat than over an RR habitat or BP. According to Safriel & Ben-Eliahu (Reference Safriel, Ben-Eliahu, Bell, McCoy and Mushinsky1991), in fact, vermetid reefs exercise considerable influences on superior mediolittoral and infralittoral communities, resulting in an increase of associated population diversity (Pandolfo et al., Reference Pandolfo, Chemello, Ciuna, Lo Valvo and Riggio1996; Badalamenti et al., Reference Badalamenti, Chemello, D'Anna and Riggio1998).
Many environmental factors could explain the observed differences between fish assemblages associated with the three selected habitat. For reef-associated fish, indeed, there is abundant evidence that the structure of the habitat has important effects on spatial distributions of populations, both in tropical coral reefs (Roberts & Ormond, Reference Roberts and Ormond1987; Tolimieri, Reference Tolimieri1995; Caley & St John, Reference Caley and St John1996; Friedlander & Parrish, Reference Friedlander and Parrish1998; Tolimieri, Reference Tolimieri1998; Holbrook et al., Reference Holbrook, Forrester and Schmitt2000; McClanahan & Arthur, Reference McClanahan and Arthur2001) and in temperate rocky reef systems (Choat & Ayling, Reference Choat and Ayling1987; Jones, Reference Jones1988; Carr, Reference Carr1989; Holbrook et al., Reference Holbrook, Schmitt and Ambrose1990; Connell & Jones, Reference Connell and Jones1991; Levin & Hay, Reference Levin and Hay1996; Tupper & Boutilier, Reference Tupper and Boutilier1997; García-Charton & Pérez-Ruzafa, Reference García-Charton and Pérez-Ruzafa2001).
Moreover, in different fish assemblages, many researches have pointed out that both S and H′ generally increased with habitat complexity (Luckurst & Luckurst, Reference Luckhurst and Luckhurst1978; MacPherson, Reference MacPherson1994; García Charton & Pérez Ruzafa, Reference García-Charton and Pérez-Ruzafa1998, Reference García-Charton and Pérez-Ruzafa2001; La Mesa & Vacchi, Reference La Mesa and Vacchi2005) and our results are in accordance with those obtained by the above mentioned authors.
Indeed, as shown by our results, there are natural differences in habitat complexity (or bottom relief) among VR, RR and BP habitats. In fact VR provides a more complex three-dimensional biogenic structure (Huston, Reference Huston1994). By building a framework, bioconstructors generate physical structures thus modifying the habitat and its structural complexity. This implies direct provision of living space by the physical structure and quantitative changes in the amount of living space as the framework grows (Cocito, Reference Cocito2004). In addition, vermetid ledges growing on the abrasion blocks scattered at the base of the cliff, yield mushroom structures (Antonioli et al., Reference Antonioli, Chemello, Improta and Riggio1999). These formations, observed along the coasts of Cape Milazzo, determine a further increasing of vermetid habitat complexity which was observed neither on RR habitat nor on BP habitat.
The main feature of the rock-like structure contributed to the reefs by the vermetid Dendropoma is the combination of hardness and porosity. The Dendropoma worm-like empty tubes are inhabited by animals of several groups, of which worms, especially polychaetes, are dominant in numbers and biomass. Moreover, the high wave energy to which the reefs are exposed causes sediment, detritus particles and live plankton to be continually pumped into, and trapped within the reefs' pores and crevices (Safriel & Ben-Eliahu, Reference Safriel, Ben-Eliahu, Bell, McCoy and Mushinsky1991).
Greater habitat complexity means greater surface available, thus providing additional resources for adults and juveniles of many species: food, cavities, caves and then new niches, refuges from predation, from artisan fishery nets, as well as resting or mating sites etc., and boosting the total number of individuals and the number of species.
The greater abundance of the whole fish assemblage over VR is probably due to the high presence of crevices in this habitat. Some authors have suggested that habitat complexity can positively affect fish density through diverse mechanisms, for instance by increasing shelter opportunities (MacPherson, Reference MacPherson1994). Offering protection from predation, wave scour and high light irradiance, crevices represent a better habitat to many organisms, which are far more abundant in crypts than on open surfaces. Habitat complexity can also modify the effects of predation on fish by providing refuges (e.g. Connell & Jones, Reference Connell and Jones1991; Hixon & Beets, Reference Hixon and Beets1993; Caley & St John, Reference Caley and St John1996; Beukers & Jones, Reference Beukers and Jones1997; Tupper & Boutilier, Reference Tupper and Boutilier1997; Steele, Reference Steele1999). It is possible to presuppose that these refuges could also protect fish from set nets; as regards, D. sargus and D. vulgaris, two species of great commercial value targeted by many kinds of set nets along the coasts of Milazzo, the large size-classes were more abundant over vermetid habitat.
Although the data presented here are indicative of habitat effects, we cannot eliminate the alternative possibility that the composition and structure of fish assemblages are also influenced by other environmental factors such us depth, bottom type, algal cover and hydrodynamism (Luckurst & Luckurst, Reference Luckhurst and Luckhurst1978; Bell, Reference Bell1983; Roberts & Ormond, Reference Roberts and Ormond1987; Connell & Jones, Reference Connell and Jones1991; MacPherson, Reference MacPherson1994; García Charton & Pérez Ruzafa, Reference García-Charton and Pérez-Ruzafa1998, Reference García-Charton and Pérez-Ruzafa2001; La Mesa & Vacchi, Reference La Mesa and Vacchi2005). This means that the potential positive influence of high complexity on assemblage variables might be overcome by other environmental features, such as wave exposure. Among the physical factors, it has been demonstrated that wave exposure affects shallow water habitats and associated sessile and vagile faunas in the reef habitats (Williams, Reference Williams and Sale1991; Denny, Reference Denny, Wainwright and Reilly1994). With respect to the fish fauna, it is well known that the effects of wave exposure are one of the main factors which influence the distribution patterns of fish associated with coral reef habitats (Bellwood et al., Reference Bellwood, Wainwright, Fulton and Hoey2002). According to Safriel & Ben-Eliahu (Reference Safriel, Ben-Eliahu, Bell, McCoy and Mushinsky1991) a factor affecting the distribution and dimension of the trottoir à vermets at small scale, in the Mediterranean Sea, is the superficial hydrodynamism: D. petraeum is a sedentary, aggregative plankton-feeding snail restricted to sites with the most extreme wave action. That is why in Sicily, vermetid platforms, are found along all north-west coasts (Chemello et al., Reference Chemello, Dieli and Antonioli2000). Even if all the three habitats were placed on the northern side of the promontory, the vermetid habitat is located exactly on the north-western side probably where the hydrodynamism is maximum (as reported by the winds chart, in the area of Cape Milazzo the 60% of winds blow from the west: north-westerly, westerly and south-westerly winds).
It is possible to suppose that the main hydrodynamism on the north-western slope promontory creates very good platform development conditions, the complexity of which influences fish assemblages, associated with this habitat.
Complexity as well as hydrodynamism may just be some components of differences among the habitats studied. Only specific studies could allow the separation of effects caused by the various components potentially involved. Anyway, it is important not to infer too much concerning processes that may be underlying observed patterns in the results reported here.
To date, no study has undertaken an extensive survey of the shallow water fish assemblage along the Milazzo promontory in reference to habitat. The data collected showed a high fish biodiversity associated with the trottoir à vermets. This habitat, characterized by a great structural complexity, appears fragile and particularly sensitive to human pressures such as pollution, unsustainable tourism and illegal fishery. Considering the environmental importance of these habitats and their role for the Mediterranean biodiversity, specific conservation strategies are desirable. As regards Capo Milazzo trottoir, located close to the urban development of this industrial area, we suggest that this area should become, as soon as possible, a marine protected area.