I. INTRODUCTION
Steel undergoes many phase transformations during the continuous casting process. Since the lattice structure of steel varies with temperature due to such transformations, steel also undergoes significant changes in volume during continuous heating, cooling, and isothermal holding, which can cause stress on both the surface and inside of a strand, and results in various surface and internal cracks. The heat transfer process is rather complex in the secondary cooling zone of continuous casting, with sharp fluctuations in the temperature of a strand between a roll pair. Research shows that the maximum surface temperature fluctuation of a strand between a roll pair is about 300 °C, with the lowest and highest temperatures being about 640 and 900 °C under certain operating conditions,Reference Barber, Patrick, Sha, Spitzer, York, Scholz, Jeschar and Kraushaar1 which can result in repeated phase transformations. It is estimated that the phase transformation stress caused by the transition of austenite to ferrite is equivalent to the thermal stress with a temperature gradient of about 150 °C.Reference Allazadeh and Garcia2 Moreover, the formation of proeutectoid ferrite films along austenite grain boundaries reduces the hot ductility of steel during the phase transformation of austenite to ferrite in the cooling process,Reference Suzuki, Nishimura and Yamaguchi3,Reference Suzuki, Nishimura, Imamura and Nakamura4 which can result in the formation of cracks under a lower strain rate. To prevent this, the temperature ranges of phase transformations are thus important to determine the hot ductility of steel during the continuous casting process.
In addition, with the increasing use of computer-based process models for stress field simulations of strands to prevent crack formation, there is a greater need for quantitative data on the thermal expansion coefficient of steel at the related temperatures.Reference James, Spittle, Brown and Evans5 However, little thermal expansion coefficient data are available for as-cast steel, with most being for as-rolled steel, and this is especially true for the phase transformations that occur at different heating or cooling rates, V c. Thus, it is necessary to carry out further investigation effects of the thermal history on thermal expansion coefficients of as-cast steel, to improve the quality of strands.
Dilatometry is one of the classic techniques for the study of solid-state phase transformations and thermal expansion coefficients in steel, because it reproduces the volume expansion or/and contraction that occurs with changes in temperature by real time monitoring of the dimensional changes occurring in the material. Therefore, by extracting information about the dimensional changes of steel from a dilatation curve and interpreting these with a quantitative analysis model,Reference Lee, Clarke and Van Tyne6–Reference Tszeng and Shi14 details of the critical temperature of phase transformationReference San Martín, Rivera Díaz del Castillo and de Andrés9,Reference Pawłowski15–Reference Long, Dong, Chen, Zhang and Zhang18 and volume fraction of each phase as a function of time and temperatureReference Lee, Clarke and Van Tyne6,Reference Suh, Oh, Han and Kim8–Reference Tszeng and Shi14 can be obtained, as well as other useful information. Moreover, the thermal expansion coefficient can also be accurately determined based on the measured dilatation curve.Reference James, Spittle, Brown and Evans5,Reference Long, Dong, Chen, Zhang and Zhang18
The current study thus examined the effects of the heating or cooling rate on the phase transformation and thermal expansion coefficient of C–Mn as-cast steel at elevated temperatures, by using dilatometric analysis. The evolution of the C, Si, and Mn contents in austenite during heating and cooling was also obtained using a quantitative analysis model.
II. EXPERIMENTAL PROCEDURE
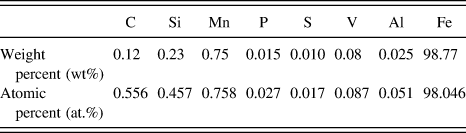
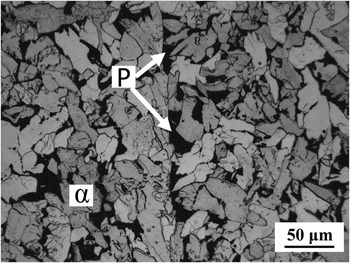
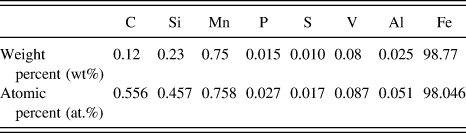
The measurements were carried out with a DIL 402C high-resolution dilatometer manufactured by Netzsch (Germany). The samples were machined from a piece of continuously cast round billet of 200 mm in diameter, and the geometry of the test specimen was 4 mm in diameter and 25 mm in length. The experimental material studied in this work was a medium, carbon hypoeutectoid steel as-cast structure, with the chemical composition shown in Table I. Figure 1 shows a light optical micrograph of the initial microstructure. A point-counting procedure according to ASTM E562-11 (Ref. 19) was used to evaluate the volume fraction of each phase in sample. Results showed that the volume fraction of pearlite was 0.14 ± 0.03.
The chemical composition of the specimen.
Light optical micrograph of the initial microstructure (etched with 3% nital).

The specimens were continuously heated to 1100 °C with four different rates of 5, 10, 15, and 20 °C/min, kept at the target temperature for 15 min to homogenize the materials, and then cooled down to 20 °C at the same rates. During the whole test process, a stable argon gas flow of 20 mL/min was maintained in the dilatometer chamber to prevent oxidation. During continuous heating and cooling of a sample in the dilatometer, the change in length and temperature as a function of time was recorded online from which ΔL/L 0 versus T was plotted, L 0 being the original length.
III. RESULTS AND DISCUSSION
A. Dilatometric analysis
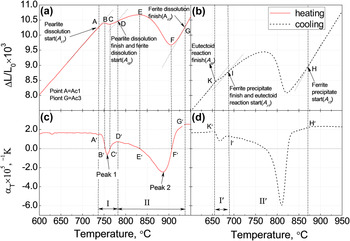
The variations in the relative change of length as a function of temperature, f(T) = ΔL/L 0, and its corresponding differential thermal expansion coefficient, αT = d(ΔL/L 0)/dT,Reference James, Spittle, Brown and Evans5 are shown in the dilatation curves in Fig. 2, and these reveal the contraction and expansion that the steel undergoes with a ferrite and pearlite initial microstructure at a continuous heating and cooling rate of 15 °C/min.
(a) ΔL/L 0 versus T on heating, (b) ΔL/L 0 versus T on cooling, (c) αT versus T on heating, and (d) αT versus T on cooling and with a test rate of temperature change of 15 °C/min.

With a change in temperature, the total strain (εtotal) of steel includes the following three componentsReference James, Spittle, Brown and Evans5,Reference San Martín, Rivera Díaz del Castillo and de Andrés9 : (i) the thermal strain of each phase with the temperature change; (ii) the difference in specific volume between the phases involved in the phase transformation; and (iii) the variations in the specific volume of austenite due to carbon enrichment or depletion. Therefore, the total strain of steel can be expressed as,
 $${\varepsilon _{{\rm{total}}}} = {\varepsilon _{{\rm{trans}}}} + {\varepsilon _{\rm{T}}}\quad ,$$
and
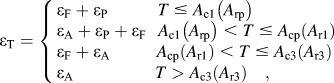 $${\varepsilon _{\rm{T}}} = \left\{ \matrix{ {\varepsilon _{\rm{F}}} + {\varepsilon _{\rm{P}}}\,\,\,\,\,\,\,\,\,\,\,\,\,\,\,\,\,T \;\le\; {A_{{\rm{c}}1}}\left( {{A_{{\rm{rp}}}}} \right) \hfill \cr {\varepsilon _{\rm{A}}} + {\varepsilon _{\rm{P}}} + {\varepsilon _{\rm{F}}}\,\,\,\,{A_{{\rm{c}}1}}\left( {{A_{{\rm{rp}}}}} \right) \;\lt\; T \;\le\; {A_{{\rm{cp}}}}\left( {{A_{{\rm{r}}1}}} \right){\rm{\ }} \hfill \cr {\varepsilon _{\rm{F}}} + {\varepsilon _{\rm{A}}}\,\,\,\,\,\,\,\,\,\,\,\,\,\,\,\,{A_{{\rm{cp}}}}\left( {{A_{{\rm{r}}1}}} \right) \;\lt\; T \;\le\; {A_{{\rm{c}}3}}\left( {{A_{{\rm{r3}}}}} \right) \hfill \cr {\varepsilon _{\rm{A}}}\,\,\,\,\,\,\,\,\,\,\,\,\,\,\,\,\,\,\,\,\,\,\,\,\,\,\,\,T > {A_{{\rm{c}}3}}\left( {{A_{{\rm{r3}}}}} \right)\quad , \hfill \cr} \right.$$
where εtrans and εT are the phase transition strain (lattice change and the variation in the specific volume of austenite due to carbon enrichment or depletion) and the thermal strain. εA, εF, and εP are the thermal strains of austenite, ferrite, and pearlite, respectively. A c1, A cp, and A c3 are the temperatures at which pearlite dissolution starts, pearlite dissolution ends, and austenization finishes on heating, while A r3, A r1, and A rp are the temperatures at which austenite decomposition begins, the eutectoid reaction starts, and the eutectoid reaction finishes on cooling.
The phase transformation process of hypoeutectoid steel during continuous heating/cooling includes the pearlite ↔ austenite and the ferrite ↔ austenite transformations. Generally, those two phase transformations will overlap at a small temperature range. Some investigationsReference Oliveira, Andrade and Cota17,Reference Martín, Cock, García Junceda, Caballero, Capdevila and de Andrés20,Reference de Andrés, Caballero and Capdevila21 have experimentally shown that these two phase transformations can be made a separation successive steps. By comparing Figs. 2(a) and 2(c) at heating and Figs. 2(b) and 2(d) at cooling, the phase transformation temperature range can be divided into stage I (I′) (pearlite ↔ austenite transformation) and stage II (II′) (ferrite ↔ austenite transformation). Using the heating process as an example, as can be seen from Fig. 2(a), the first inflection point A (the εtotal deviates from linearity) is seen as the temperature rises, which indicates the start of the α + Fe3C → γ reaction (pearlite dissolution).Reference De Andres, Caballero, Capdevila and Alvarez7 Because ferrite α has a body-centered cubic structure, it will transform into austenite γ with a face-centered cubic structure. This phase transformation will cause a volume contraction of approximately 1.6%Reference Kop, Sietsma and Van Der Zwaag10 and then εtrans < 0. At the same time, each phase of steel expands as the temperature continues to rise, │εT = εA + εF + εP│ > │εtrans│, and εtotal will increase along with the temperature [AB and A′B′ range in Figs. 2(a) and 2(c)]. When│εtrans│ = │εT = εA + εF + εP│, the second inflection point B is seen, and the differential thermal expansion coefficient αT = 0 [point B′ in Fig. 2(c)]. As the temperature continues to rise, │εtrans│ > │εT = εA + εF + εP│, │εtotal│ will decrease, and negative thermal expansion (εtotal < 0) then occurs [BC range in Fig. 2(a) and B′C′ range in Fig. 2(c)], with the pearlite to austenite phase transition happening more rapidly. Thereafter, with the continued dissolution of pearlite, εtrans decreases while the amount of austenite increases, and thus the thermal strain │εT = εA + εF + εP│ continues to rise. When the absolute value of εtrans equals εT (│εtrans│ = │εT = εA + εF + εP│) once again, the third inflection point C occurs. In fact, at the late stage of the eutectoid reaction, │εtrans│ < │εT = εA + εF + εP│, εtotal > 0. When the eutectoid reaction ends, the ferrite to austenite transformation (α → γ) begins, and this causes the fourth inflection point D. But this inflection point D is less evident to see in Fig. 2(a) but easier to determine from the first derivative, αT = d(ΔL/L 0)/dT, as shown in Fig. 2(c).Reference Pawłowski16
As the ferrite gradually transforms into austenite, the carbon in the carbon-rich austenite (with a maximum value of about 0.77C, wt%Reference Howell22) will diffuse into the ferrite, and thus the volume of austenite is decreased. Both the lattice change (α → γ) and the decreasing carbon content of the austenite cause a contraction of the sample. At the start of the α → γ transformation [DE and D′E′ ranges in Figs. 2(a) and 2(c)], │εtrans│ < │εT = εA + εFD│, and εtotal increases along with the temperature. When the temperature reaches the point E, │εtrans│ = │εT = εA + εF│, εtotal = 0, and the differential thermal expansion coefficient αT = 0 [point E′ in Fig. 2(c)]. As the temperature continues to rise, │εtrans│ > │εT = εA + εF│, │εtotal│ will decrease, and the steel shows negative thermal expansion (εtotal < 0) [EF or E′F′ ranges in Figs. 2(a) and 2(c)]. At late stage of the austenization, │εtrans│ < │εT = εA + εF + εP│, εtotal > 0 [FG and F′G′ ranges in Figs. 2(a) and 2(c)]. When austenization finishes, εtotal has a linear relationship with temperature.
B. Effect of heating/cooling rate on the critical temperature of phase transformation
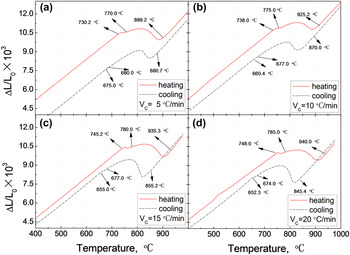
The dilatation curves at various heating or cooling rates are shown in Fig. 3. The characteristic temperatures of phase transition, including A c1, A cp, A c3, A r3, A r1, and A rp, are shown in Table II. It can be seen that the characteristic temperatures of A c1, A cp, and A c3 increased along with the heating rates, while A r3, A r1, and A rp decreased as the cooling rates rose. Because the characteristic temperature of phase transformation depends on the nucleation rate of the new phase (austenite or ferrite), which is controlled by the nucleation time, nucleation site, temperature gradient, and nucleation style (e.g., heterogeneous nucleation). At higher heating or cooling rates, the effective holding times at each temperature are shorter.Reference Martín, Cock, García Junceda, Caballero, Capdevila and de Andrés20 Also, the nucleation rate is believed to be controlled by either the volume diffusion of carbon or by boundary diffusion of substitutional alloying elements, like Mn and Si.Reference Oliveira, Andrade and Cota17 When the heating or cooling rate increases, the amount of diffusion of elements, such as C, Mn, and Si, will decrease per unit of time, which is the result of a fall in the nucleation rate. Under these conditions, the new phase has less time to nucleate, which can result in that the heating/cooling rates increased. Consequently, the characteristic temperature of phase transformation is increased/decreased.
The dilatation curves at various rates of temperature change during heating and cooling: (a) V c = 5 °C/min, (b) V c = 10 °C/min, (c) V c = 15 °C/min, and (d) V c = 20 °C/min.

The critical temperature for phase transition (in °C).

Despite this, it can be seen in Table II that the increasing or decreasing gradient of the characteristic temperatures decreased with the heating or cooling rates increased. This is due to that the greater heating or cooling rate is, the higher the superheat or subcooling per unit time is. So, the radius of critical nucleus will be decreased, which can aid the nucleation of the new phase during phase transformation at higher (heating) or lower (cooling) temperature. As a result, the gradient of those characteristic temperatures decreases. Similar effects of heating or cooling rates on critical temperatures of low-carbon microalloyed steel were also been previously reported in Refs. Reference San Martín, Rivera Díaz del Castillo and de Andrés9, Reference Martín, Cock, García Junceda, Caballero, Capdevila and de Andrés20, and Reference Clarke, Van Tyne, Vigil and Hackenberg23.
In addition, it can be seen in Table II that the phase transition temperature range (A c3–A c1) expanded as V c increased at heating process, while the range for A r3–A rp contracted at cooling process. This phenomenon was also observed by Oliveira et al.Reference Oliveira, Andrade and Cota17 in studying the kinetics of austenite formation during continuous heating in a low-carbon steel. An investigation of the temperature range of α ↔ γ during the heating and cooling processes showed that the temperature range (A c3–A cp) of α → γ increased as V c rose in the heating process, while the range of A r3–A r1 decreased. It means that the rates of nucleation and growth of austenite at heating are lower than that of ferrite at cooling. Moreover, while the temperature difference (A c1–A rp) increased as V c rose, the gradient of this temperature difference then decreased as V c continued to rise. The same phenomena also occurred for (A c3–A r3).
C. Effect of heating/cooling rate on thermal expansion coefficient
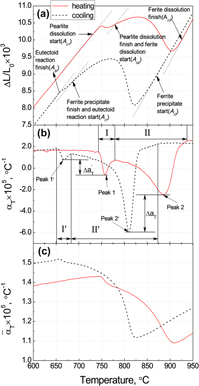
Figures 4(a) and 4(b) show the dilatation curves and differential thermal expansion coefficients as a function of temperature with a heating or cooling rate of 15 °C/min. It can be seen that αT of the same temperature point was inconsistent in the heating and cooling process. In addition, the maximum │αT│ was significantly different in the heating and cooling process, and this difference is defined as │ΔαT│, as shown in Fig. 4(b).
(a) ΔL/L 0 versus T, (b) αT versus T, and (c)  $\overline \alpha$ vs. T on heating/cooling and with a test rate of temperature change of 15 °C/min.

To clarify the causes of this difference, the phase transformation rate of austenite K γ is defined as,
 $${K_\gamma } = {{{\rm{d}}{f_\gamma }} \mathord{\left/ {\vphantom {{{\rm{d}}{f_\gamma }} {{\rm{d}}T}}} \right. \kern-\nulldelimiterspace} {{\rm{d}}T}}\quad ,$$
where df γ is the increase in the austenite volume fraction as a function of the temperature change dT. f γ is determined by a semiempirical method of dilatometric analysis, as described in more details below.
The atomic volume (V) of the sample is determined by a linear combination of the atomic volumes of each phase, which can be expressed as,
 $$V = {f_\alpha }{V_\alpha } + {f_\gamma }{V_\gamma } + {f_{\rm{P}}}{V_{\rm{P}}}\quad ,$$
where f α, f γ, and f P are the volume fractions of ferrite, austenite, and pearlite, while V α, V γ, and V P are the atomic volumes of ferrite, austenite, and pearlite, respectively, which are related to the lattice parameters by  $V_\alpha = {1 \mathord{\left/ {\vphantom {1 2}} \right. \kern-\nulldelimiterspace} 2}a_\alpha ^3$;
 $V_\gamma = {1 \mathord{\left/ {\vphantom {1 4}} \right. \kern-\nulldelimiterspace} 4}a_\gamma ^3$; V P = (1 − ρ)V α + ρV θ, with V θ = 1/12(a θb θc θ), and ρ is the cementite fraction in the pearlite.
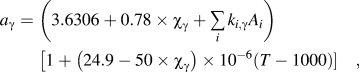
The lattice parameters of ferrite, cementite, and austenite are given byReference Lee, Clarke and Van Tyne6,Reference De Andres, Caballero, Capdevila and Alvarez7,Reference Onink, Brakman, Tichelaar, Mittemeijer, Van der Zwaag, Root and Konyer24
 $${a_\alpha } = \left( {2.8863 + \mathop\sum\limits_i {{k_{i,\alpha }}{A_i}} } \right)\left[ {1 + 1.75 \times {{10}^{ - 5}}\left( {T - 800} \right)} \right]\quad ,$$
 $${a_\gamma } = \left( {3.6306 + 0.78 \times {\chi _\gamma } + \sum\limits_i {{k_{i,\gamma }}{A_i}} } \right)\left[ {1 + \left( {24.9 - 50 \times {\chi _\gamma }} \right) \times {{10}^{ - 6}}\left( {T - 1000} \right)} \right]\quad ,$$
 $${a_\theta } = 4.5234\left[ {1 + \left( {5.311 \times {{10}^{ - 6}} - 1.942 \times {{10}^{ - 9}} \times T + 9.655 \times {{10}^{ - 12}} \times {T^2}} \right) \times \left( {T - 293} \right)} \right]\quad ,$$
 $${b_\theta } = 5.0883\left[ {1 + \left( {5.311 \times {{10}^{ - 6}} - 1.942 \times {{10}^{ - 9}} \times T + 9.655 \times {{10}^{ - 12}} \times {T^2}} \right) \times \left( {T - 293} \right)} \right]\quad ,$$
 $${c_\theta } = 6.7426\left[ {1 + \left( {5.311 \times {{10}^{ - 6}} - 1.942 \times {{10}^{ - 9}} \times T + 9.655 \times {{10}^{ - 12}} \times {T^2}} \right) \times \left( {T - 293} \right)} \right]\quad ,$$
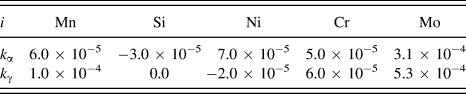
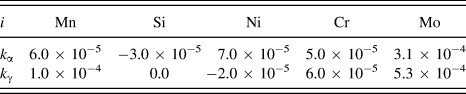
where k i,α and k i,γ are the coefficients for the effects of alloying element i on the ferrite and austenite lattice parameters in at.%, as listed in Table III.Reference Lee, Clarke and Van Tyne6A i is the at.% of alloy element i. χγ is the at.% of carbon in austenite.
Coefficients for the effects of alloying elements on the lattice parameter (in nm).
Considering that the carbon content of the steel is 0.12 wt%, the carbon concentration in austenite w γ during this transformation can be estimated from the mass conservation as follows:
 $${w_\gamma } = {{\left( {0.12 - {f_\alpha }{w_\alpha }} \right)} \mathord{\left/ {\vphantom {{\left( {0.12 - {f_\alpha }{w_\alpha }} \right)} {{f_\gamma }}}} \right. \kern-\nulldelimiterspace} {{f_\gamma }}}\quad .$$
From Eq. (10), a value of w γ = 0.72 wt% at the critical temperature of A cp(A rp) can be obtained from f α = 0.86 and f γ = 0.14, and by assuming a constant carbon content in ferrite of w α = 0.0218 wt%.
The at.% of C, Si, and Mn in austenite can be calculated as follows,
 $${\chi _\gamma } = {{{w_\gamma }} \over {12}}{\left[ {\sum\limits_i {{{{w_i}} \mathord{\left/ {\vphantom {{{w_i}} {{\omega _i}}}} \right. \kern-\nulldelimiterspace} {{\omega _i}}}} + {{\left( {100 - {w_\gamma } - \sum\limits_i {{w_i}} } \right)} \mathord{\left/ {\vphantom {{\left( {100 - {w_\gamma } - \sum\limits_i {{w_i}} } \right)} {56}}} \right. \kern-\nulldelimiterspace} {56}}} \right]^{ - 1}}\quad ,$$
 $${A_i} = {{{w_i}} \over {{\omega _i}}}{\left[ {{{{w_\gamma }} \over {12}} + \sum\limits_i {{{{w_i}} \mathord{\left/ {\vphantom {{{w_i}} {{\omega _i}}}} \right. \kern-\nulldelimiterspace} {{\omega _i}}}} + {{\left( {100 - {w_\gamma } - \sum\limits_i {{w_i}} } \right)} \mathord{\left/ {\vphantom {{\left( {100 - {w_\gamma } - \sum\limits_i {{w_i}} } \right)} {56}}} \right. \kern-\nulldelimiterspace} {56}}} \right]^{ - 1}}\quad ,$$
where w i and ωi are the weight percent and atomic weight of alloy element i, respectively.
The volume fractions of ferrite and cementite in pearlite are based on a Fe–Fe3C phase diagram and the densities of the two phases at room temperature. The mass fractions for the two phases, F(%) and Fe3C(%), are calculated from the phase diagram, as follows:
 $${\rm{F}}\left( \% \right) = {{\left( {6.69 - {\rm{C}}\% } \right)} \mathord{\left/ {\vphantom {{\left( {6.69 - {\rm{C}}\% } \right)} {6.69}}} \right. \kern-\nulldelimiterspace} {6.69}}\quad ,$$
 $${\rm{F}}{{\rm{e}}_3}{\rm{C}}\left( \% \right) = {{{\rm{C}}\% } \mathord{\left/ {\vphantom {{{\rm{C}}\% } {6.69}}} \right. \kern-\nulldelimiterspace} {6.69}}\quad ,$$
where C% is the weight percentage of carbon in the steel, and the C% in ferrite is assumed to be zero at room temperature.
The volume fractions of ferrite and cementite in pearlite are then equal to
 $${f_{\alpha {\rm{P}}}} = {{{{{\rm{F}}\left( \% \right)} \mathord{\left/ {\vphantom {{{\rm{F}}\left( \% \right)} {{\rho _\alpha }}}} \right. \kern-\nulldelimiterspace} {{\rho _\alpha }}}} \over {{{{\rm{F}}\left( \% \right)} \mathord{\left/ {\vphantom {{{\rm{F}}\left( \% \right)} {{\rho _\alpha }}}} \right. \kern-\nulldelimiterspace} {{\rho _\alpha }}} + {{{\rm{F}}{{\rm{e}}_3}{\rm{C}}\left( {\rm{\% }} \right)} \mathord{\left/ {\vphantom {{{\rm{F}}{{\rm{e}}_3}{\rm{C}}\left( {\rm{\% }} \right)} {{\rho _{{\rm{F}}{{\rm{e}}_3}{\rm{C}}}}}}} \right. \kern-\nulldelimiterspace} {{\rho _{{\rm{F}}{{\rm{e}}_3}{\rm{C}}}}}}}}\quad ,$$
 $${f_{\theta {\rm{P}}}} = {{{{{\rm{F}}{{\rm{e}}_3}{\rm{C}}\left( {\rm{\% }} \right)} \mathord{\left/ {\vphantom {{{\rm{F}}{{\rm{e}}_3}{\rm{C}}\left( {\rm{\% }} \right)} {{\rho _{{\rm{F}}{{\rm{e}}_3}{\rm{C}}}}}}} \right. \kern-\nulldelimiterspace} {{\rho _{{\rm{F}}{{\rm{e}}_3}{\rm{C}}}}}}} \over {{{{\rm{F}}\left( \% \right)} \mathord{\left/ {\vphantom {{{\rm{F}}\left( \% \right)} {{\rho _{\rm{\alpha }}}}}} \right. \kern-\nulldelimiterspace} {{\rho _{\rm{\alpha }}}}} + {{{\rm{F}}{{\rm{e}}_3}{\rm{C}}\left( {\rm{\% }} \right)} \mathord{\left/ {\vphantom {{{\rm{F}}{{\rm{e}}_3}{\rm{C}}\left( {\rm{\% }} \right)} {{\rho _{{\rm{F}}{{\rm{e}}_3}{\rm{C}}}}}}} \right. \kern-\nulldelimiterspace} {{\rho _{{\rm{F}}{{\rm{e}}_3}{\rm{C}}}}}}}}\quad ,$$
where  ${\rho _{{\rm{F}}{{\rm{e}}_3}{\rm{C}}}}$ and ρα are the mass densities of cementite and ferrite, as follows,Reference De Andres, Caballero, Capdevila and Alvarez7
 $${\rho _{{\rm{F}}{{\rm{e}}_3}{\rm{C}}}} = 7686.45 - 6.63 \times {10^{ - 2}} \times T - 3.12 \times {10^{ - 4}} \times {T^2}\quad ,$$
 $$\!{\rho _\alpha } = 7875.95 - 0.2975 \times T - 6.62 \times {10^{ - 5}} \times {T^2}\quad .$$
Assuming that the pearlite ↔ austenite and ferrite ↔ austenite transformations are carried out with successive steps of heating and cooling, the volume fractions of ferrite (f α) and pearlite (f P) during the transformations are given byReference Suh, Oh, Han and Kim8
 $${f_\alpha } = {{V - {V_\gamma }} \over {{V_\alpha } - {V_\gamma }}}\;{\rm{and}}\;\left( {{f_\alpha } + {f_\gamma } = 1} \right)\quad ,$$
 $${f_{\rm{P}}} = {{V - {V_\gamma } + {f_\alpha }\left( {{V_{\rm{P}}} - {V_\alpha }} \right)} \over {{V_{\rm{P}}} - {V_\alpha }}}\;{\rm{and}}\;\left( {{f_\alpha } + {f_\gamma } + {f_{\rm{P}}} = 1} \right)\quad .$$
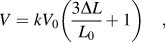
If the volume change associated with the phase transformation is isotropic and relatively small, the change in the atomic volume of the sample is related to the change in length, as measured by dilatometry, as follows,Reference Suh, Oh, Han and Kim8
 $${{\Delta V} \over {{V_0}}} = {{V - {V_0}} \over {{V_0}}} = {V \over {{V_0}}} - 1 = {{3\Delta L} \over {{L_0}}}\quad ,$$
and
 $$V = k{V_0}\left( {{{3\Delta L} \over {{L_0}}} + 1} \right)\quad ,$$
where V 0 and ΔV are the initial atomic volume and change in atomic volume, respectively, and k is a scaling factor. Ideally the value of this scaling factor is 1, but a number of issues could cause it to be different, such as inaccuracies in the measuring system, or nonisotropic contraction/expansion in the sample due to the presence of texture and transformation induced plasticity effects.
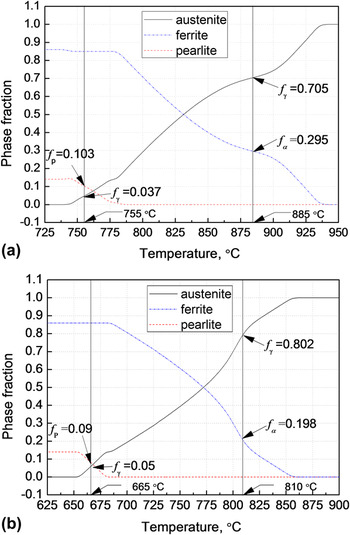
Eqs. (19) and (20) were numerically solved for f α, f γ, and f P in temperature steps of 1 °C. Figure 5 shows the evolution of the fractions of each phase during heating and cooling at a temperature change rate of 15 °C/min.
The evolution of the fractions of each phase: (a) heating and (b) cooling.

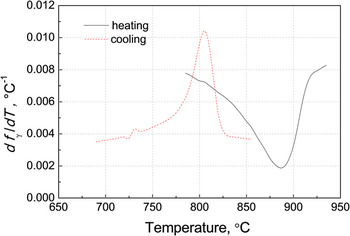
The phase transformation rate K γ of austenite is calculated using Eq. (3), as shown in Fig. 6. It can be seen that the phase transformation speeds (K γ) of ferrite ↔ austenite are different in the heating and cooling process. The K γ value on heating decreases and reaches the minimum value at 885 °C (corresponding to peak 2 in Fig. 4), and then subsequently increases along with the temperature on further heating. However, the phase transformation speed of austenite (K γ) to ferrite increases and reaches the maximum value at 810 °C (corresponding to peak 2′ in Fig. 4), and then decreases as the temperature falls on cooling. The phase fraction of austenite [f γ = 0.705, in Fig. 5(a)] on heating is smaller than that on cooling [f γ = 0.802, in Fig. 5(b)]. It means that the transformation rate difference resulted in the thermal expansion coefficient difference.
df γ/dT versus T on heating and cooling.

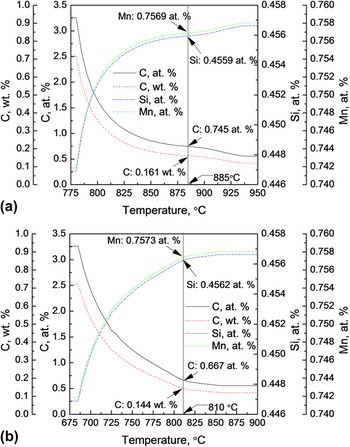
The evolution of the C, Si, and Mn contents in austenite are calculated using Eqs. (10)–(12), as shown in Fig. 7. It can be seen in Fig. 7(a) that the carbon content in austenite rapidly decreases in the initial phase transformation stage and then slowly declines in the later stage on heating. At the same time, the Si and Mn contents in austenite rapidly increase at the initial phase transformation stage and then slowly increase in the later stage. Figure 7(b) shows that the carbon content in austenite increases slowly in the initial phase transformation stage and then rapidly increases as the temperature declines, with the Si and Mn contents in austenite slowly decreasing in the initial phase transformation stage and then rapidly decreasing in the later late stage.
The evolution of the C, Si, and Mn contents in austenite: (a) heating and (b) cooling.

In addition, the average linear expansion coefficient,  $\overline \alpha = {{\left[ {{{\left( {L - L_0 } \right)} \mathord{\left/ {\vphantom {{\left( {L - L_0 } \right)} {\left( {T - T_0 } \right)}}} \right. \kern-\nulldelimiterspace} {\left( {T - T_0 } \right)}}} \right]} \mathord{\left/ {\vphantom {{\left[ {{{\left( {L - L_0 } \right)} \mathord{\left/ {\vphantom {{\left( {L - L_0 } \right)} {\left( {T - T_0 } \right)}}} \right. \kern-\nulldelimiterspace} {\left( {T - T_0 } \right)}}} \right]} {L_0 }}} \right. \kern-\nulldelimiterspace} {L_0 }}$,Reference James, Spittle, Brown and Evans5 is shown in Fig. 4(c), with the temperature changing at a rate of 15 °C/min. By comparing Figs. 4(b) and 4(c), it can be seen that the expansion coefficients are significantly different between
 $\overline \alpha$ and αT. This difference is because the increase in length ΔL has been averaged based on the average linear expansion coefficient,
 $\overline \alpha = {{\left( {{{\Delta L} \mathord{\left/ {\vphantom {{\Delta L} {\Delta T}}} \right. \kern-\nulldelimiterspace} {\Delta T}}} \right)} \mathord{\left/ {\vphantom {{\left( {{{\Delta L} \mathord{\left/ {\vphantom {{\Delta L} {\Delta T}}} \right. \kern-\nulldelimiterspace} {\Delta T}}} \right)} {L_0 }}} \right. \kern-\nulldelimiterspace} {L_0 }}$, which obscures the phase transformation and expansion characteristics at some of the temperature range. By contrast, the differential thermal expansion coefficient αT presents the amount of expansion between the two test temperature points, more accurately than the average linear expansion coefficient
 $\overline \alpha$ is able to. Therefore, if the average linear expansion coefficient
 $\overline \alpha$ is used to simulate the stress/strain, then this will produce misleading results.
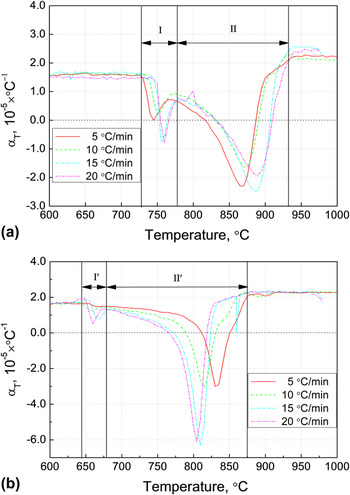
Figure 8 shows the differential thermal expansion coefficient as a function of temperature. There is a linear relationship between the thermal expansion coefficient and temperature during the phase reign of pearlite + ferrite (below the A c1 and A rp) and single austenite (above the A c3 and A r3), and the heating or cooling rate has little effect on the expansion coefficient. The thermal expansion coefficients (αT) at the phase reign of pearlite + ferrite and single austenite were about 1.61 × 10⁻⁵ and 2.25 × 10⁻⁵ °C−1, respectively. This αT of single austenite measured in this study agrees well with those reported in the previous works, such as 2.09 × 10⁻⁵,Reference Onsøien, M'hamdi and Mo25 2.31 × 10⁻⁵,Reference Petrov, Kestens and Houbaert26 2.065 × 10⁻⁵,Reference Caballero, Capdevila and García De Andrés27 and 2.1 × 10⁻⁵ °C−1.Reference Long, Dong, Chen, Zhang and Zhang18 As can be seen in Fig. 8, when A c1 (A rp) < T < A c3 (A r3), the relationship between the thermal expansion coefficient and temperature is significantly nonlinear, and the value of αT is between −6.31–2.25 × 10⁻⁵ °C−1 for the different rates of temperature change. More specifically, the αT of the pearlite dissolution process (stage I) is between −0.90–1.61 × 10⁻⁵ °C−1 during the heating process, and that of the austenization process (stage II) is between −2.49–2.25 × 10⁻⁵ °C−1. At the same time, the αT value of the eutectoid reaction process (stage I) is between 0.52–1.61 × 10⁻⁵ °C−1 during the cooling process, and that of the austenite decomposition process (stage II) is between −6.31–2.25 × 10⁻⁵ °C−1. The peak αT values for the pearlite dissolution process (heating) or eutectoid reaction (cooling) are significantly smaller than those for the austenization process (heating) or ferrite precipitate process (cooling).
Differential thermal expansion coefficients as a function of temperature: (a) heating and (b) cooling.

By comparing Figs. 8(a) and 8(b), it can be seen that the αT values of the same temperature point were inconsistent in the heating and cooling processes. The difference (│ΔαT│) of the maximum │αT│ between the heating and cooling processes increases along with rate of temperature change. Specifically, with the V c of 5, 10 , 15, and 20 °C/min, the values of │ΔαT│ are 0.70 × 10⁻⁵ °C −1, 1.43 × 10⁻⁵, 3.82 × 10⁻⁵, and 4.17 × 10⁻⁵ °C −1, respectively.
IV. CONCLUSIONS
This study examined the effects of thermal history, including different heating or cooling rates (5–20 °C/min), heating and cooling, on the phase transformation and thermal expansion coefficient of C–Mn as-cast steel. The results are summarized as follows:
(1) As the heating or cooling rate (V c) increased, the characteristic temperatures of A c1, A cp, and A c3 all rose, while those of A r3, A r1, and A rp decreased. In addition, as the heating or cooling rate rose, the phase transformation temperature range (A c3–A c1) increased, while (A r3–A rp) decreased.
(2) The maximum thermal expansion coefficients│αT│ between the heating and cooling processes during phase transformation showed significant differences, and the difference (│ΔαT│) in the maximum │αT│ between the heating and cooling processes rose along with the heating or cooling rate, due to the different phase transformation rates of austenite to ferrite on cooling and ferrite to austenite on heating.
(3) The evolution of carbon and substitutional alloying elements (Si and Mn) in austenite during heating and cooling showed significant differences.
(4) The average linear expansion coefficient cannot reflect the true thermal strain of strands. This suggests that using the differential thermal expansion coefficient for stress field simulations of strands can be beneficial to accurate results.
(5) The differential thermal expansion coefficients at the phase reign of pearlite + ferrite and single austenite were 1.61 × 10⁻⁵ and 2.25 × 10⁻⁵ °C−1, respectively.
ACKNOWLEDGMENTS
The work was financially supported by the National Natural Science Foundation of China (NSFC, project No. 51374260, No. 61303208) and The Aim for the Top University Project of National Cheng Kung University (project No. D103-23014).