Implications
Trace minerals are related to productive performance and health status. However, few studies have been conducted that assess the role of different forms and amounts of trace minerals in oxidative metabolism of dairy cows. We hypothesized that amount and source of trace mineral would affect indices of oxidative status, immune response and performance. Our results indicate that the varying level and source of trace minerals in diets fed to midlactation cows have short-term effects on the aspects of oxidative metabolism and do not affect clinical responses to lipopolysaccharide (LPS) challenge.
Introduction
Reactive oxygen species (ROS) are well-recognized for having both potentially beneficial and negative effects on physiology (Valko et al., Reference Valko, Leibfritz, Moncol, Cronin, Mazur and Telser2007; Sordillo and Aitken, Reference Sordillo and Aitken2009). Although the production of ROS is critical for proper function of immune cells and signalling, production of ROS in excess of antioxidant mechanisms results in oxidative stress, which can cause cellular damage (Valko et al., Reference Valko, Leibfritz, Moncol, Cronin, Mazur and Telser2007; Sordillo and Aitken, Reference Sordillo and Aitken2009). Although the body produces a number of endogenous antioxidants, including ceruloplasmin, transferrin, lactoferrin, albumin, haptoglobin and hemopexin (Sies, Reference Sies1991), their ability to eliminate ROS can be exceeded under high oxidant status, which leads to oxidative stress and potentially health disorders (Sordillo and Aitken, Reference Sordillo and Aitken2009). In dairy cows, involvement of oxidative stress in etiologies of certain disorders is suggested by several studies: reduction in incidence of retained placenta and mastitis when dietary source of antioxidants such as vitamin E and selenium are supplemented (Miller et al., Reference Miller, Brzezinska-Slebodzinska and Madsen1993; Allison and Laven, Reference Allison and Laven2000) and lower blood vitamin C level in animals with mastitis when compared with healthy ones (Ranjan, Reference Ranjan2005; Kaygusuzoglu, Reference Kaygusuzoglu2012). Other studies also have shown that oxidative stress is associated with immune dysfunction or diseases in dairy cows (Lykkesfeldt and Svendsen, Reference Lykkesfeldt and Svendsen2007; Sordillo et al., Reference Sordillo, O’Boyle, Gandy, Corl and Hamilton2007; Aitken et al., Reference Aitken, Karcher, Rezamand, Gandy, VandeHaar, Capuco and Sordillo2009). A number of micronutrients are involved in the antioxidant defense system, and trace minerals play a key role to control the balance between ROS and antioxidants, mainly through the components of antioxidant enzymes such as superoxide dismutase (SOD) containing zinc (Zn), copper (Cu) and manganese (Mn); glutathione-peroxidase (GSH-Px) containing selenium; and catalase containing iron Fe (Failla, Reference Failla2003; Spears and Weiss, Reference Spears and Weiss2008).
Major nutrients and macrominerals have been studied in various aspects including performance, prevention of deficiency and oxidative status in dairy cattle (National Research Council (NRC), 2001); however, few studies have been conducted that assess the role of trace minerals in the relationship among oxidative stress and performance in dairy cows. Therefore, further research for trace mineral supplementation from the standpoint of oxidative metabolism and responses to immune system activation through intramammary LPS challenge may elucidate the opportunity to prevent diseases related to oxidative stress and thereby improve performance in dairy cows. Results suggest that organic trace minerals are more bioavailable than common inorganic sources (NRC, 2001); however, whether this translates into altered indices associated with oxidative status and response to acute immune challenge is not known. The objective of this experiment was to determine whether amount and source of supplemental trace minerals affected aspects of oxidative metabolism, responses to intramammary LPS infusion and performance in lactating dairy cattle.
Material and methods
Experimental animals, treatments and procedures
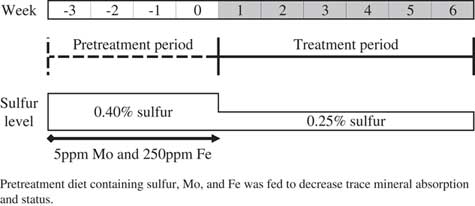
The Cornell University Institutional Animal Care and Use Committee approved all procedures involving animals. A total of 48 multiparous Holstein cows were utilized in this experiment. A minimum sample size of 10 cows per treatment was calculated based on the determination of a 10% difference in plasma thiobarbituric acid reactive substances (TBARS) as measured by Bernabucci et al. (Reference Bernabucci, Ronchi, Lacetera and Nardone2005), using an α of 0.05 and a power of 80%. Cows were housed in individual tiestalls at the Cornell University Teaching and Research Center beginning at 60 to 140 days in milk and fed a diet formulated to meet or exceed NRC nutrient requirements for all nutrients (NRC, 2001) except for trace minerals of interest (Zn, Cu and Mn), which were supplied from basal ration ingredients only. In addition, all cows were fed a pretreatment diet for 4 weeks (week 3 to week 0; Figure 1), containing 0.40% sulfur (DM basis, ration addition), 5 ppm of molybdenum (Mo) from sodium molybdate (topdress) and 250 ppm of Fe from iron sulfate (topdress) to decrease trace mineral absorption and status (Figure 1). After this 4-week pretreatment period, the sulfur content of the basal diet was reduced to 0.25% (Figure 1), the topdress of the Mo and Fe ceased and cows were assigned to one of four dietary treatments for 6 weeks (week 1 to week 6; Figure 1) in a randomized complete block design: (1) NRC inorganic (NRC 2001 levels using inorganic trace mineral supplements only); (2) NRC organic (NRC 2001 levels using organic trace mineral supplements only); (3) commercial inorganic (commercial levels (approximately 2×NRC requirement) using inorganic trace mineral supplements only); and (4) commercial organic (commercial levels using organic trace mineral supplements only). The original target concentrations of Zn, Cu and Mn in the diet were 48, 11 and 14 ppm, respectively, for the NRC (2001) level and 68, 19 and 33 ppm, respectively, for the commercial level. Cows were enrolled in groups and blocked by week of enrollment. The groups consisted of five blocks (n=16 for block 1 and n=8 each for blocks 2 through 5). Within blocks, cows were stratified by milk yields and assigned randomly to treatments. Supplemental inorganic Zn, Cu and Mn were supplied using zinc sulfate monohydrate, cupric sulfate pentahydrate and manganese sulfate monohydrate, respectively. Organic trace minerals were supplied as Zn, Cu and Mn chelated to 2-hydroxy-4-(methythio)-butanoic acid (HMTBa) as MINTREX trace minerals (Novus International, Inc., St. Charles, MO, USA). Trace mineral treatments were delivered once daily by topdress at the time of feeding.
Overall schematic of design of experiment evaluating the effects of trace mineral level and source in lactating dairy cows, indicating pretreatment and treatment periods, changes in dietary sulfur level and topdress of molybdenum (Mo) and iron (Fe) only during pretreatment period.

Blood and tissue sampling
Blood samples were collected from coccygeal vessels once weekly at 1000 h from week 1 through week 6 and placed immediately on ice. Two evacuated 10-ml heparinized tubes (Vacutainer; Becton Dickinson, Franklin Lakes, NJ, USA) were used to collect 14 ml of blood (7 ml per tube) and whole blood was used for packed cell volume (PCV) measurement determined by reading percentage of erythrocyte layer in capillary tubes following centrifugation in a capillary centrifuge. Erythrocytes were isolated from 2 ml of whole blood according to the method described by Bernabucci et al. (Reference Bernabucci, Ronchi, Lacetera and Nardone2005): after centrifugation (2800×g for 15 min at 4°C) and removal of plasma, remaining erythrocytes were washed four times with 0.9% NaCl and lysed using 2 ml of cold water (Bernabucci et al., Reference Bernabucci, Ronchi, Lacetera and Nardone2005). The erythrocyte lysate was snap-frozen in liquid nitrogen and stored at −80°C for later analysis of SOD and GSH-Px. Plasma was also harvested as described above and stored at −20°C until analysis for plasma TBARS, plasma total antioxidant capacity (TAC) and plasma immunoglobulin G (IgG).
Oxidative metabolism indices and plasma immunoglobulin G
Superoxide dismutase activity in erythrocyte lysate from the blood samples collected on a weekly basis was measured using a commercial kit (Superoxide DismuTACe Assay kit; Cayman Chemical Company, Ann Arbor, MI, USA). Frozen erythrocyte lysate was thawed and diluted 1 : 50 with 50 mM Tris-HCl, pH 8.0. The absorbance of a red formazan dye formed by oxidation of a tetrazolium salt was read at 450 nm after 45-min incubation at room temperature. As described by Bernabucci et al. (Reference Bernabucci, Ronchi, Lacetera and Nardone2005), SOD was expressed in units per milliliter of PCV. Glutathione-peroxidase activity in erythrocyte lysate from the blood samples collected on a weekly basis was measured using a commercial kit (Glutathione Peroxidase Assay kit; Cayman Chemical Company). Frozen erythrocyte lysate was thawed and diluted 1 : 50 with 50 mM Tris-HCL, pH 7.6, containing 5 mM EDTA and 1 mg/ml bovine serum albumin. The absorbance of NADPH was read once per minute for 5 consecutive minutes at 340 nm at room temperature. As described by Bernabucci et al. (Reference Bernabucci, Ronchi, Lacetera and Nardone2005), GSH-Px activity was expressed in nanomoles/min per millilitre of PCV. Plasma TBARS was measured in samples collected on a weekly basis using a commercial kit (TBARS Assay kit; Cayman Chemical Company). Formed malondialdehyde-thiobarbituric acid adduct was measured colorimetrically at 530 nm. Thiobarbituric acid reactive substances was expressed in malondialdehyde (MDA) µM concentration. Plasma TAC was also measured in the same weekly samples using a commercial kit (Antioxidant Assay kit; Cayman Chemical Company). Plasma samples were diluted 1 : 20 with assay buffer (5 mM potassium phosphate, pH 7.4, containing 0.9% sodium chloride and 0.1% glucose) before assay. The amount of oxidized 2,2ʹ-Azino-di-3-ethylbenzthiazoline sulphonate was read at 750 nm. Total antioxidant capacity was expressed in millimolar concentration. All spectrophotometric measurements were conducted using an ELX800 plate reader (BioTek Instruments Inc., Winooski, VT, USA).
Plasma IgG was measured in samples collected on a weekly basis using a commercial kit (Bovine IgG ELISA Quantitation Kit; Bethyl Laboratories, Montgomery, TX, USA). Briefly, ELISA assay plates (NUNC-IMMUNE plate, NUNC, Denmark) were coated with 100 μl of 1 μl/ml capture antibody (sheep anti-bovine IgG) per well. The coated plate was incubated for 60 min. After incubation, the capture antibody was poured out and each well was washed with 200 μl of Wash Solution. Washing was repeated three times. Blocking solution (200 μl) was added to each well. After 30 min of incubation, the solution was poured out and each well was washed three times. Plasma samples (100 μl), which were diluted 1:2 00 000, and IgG standard (100 μl), which ranged from 7.8 to 500 ng/ml, were transferred to assigned wells. After 60 min of incubation, the samples and standards were poured out and each well was washed five times. Detection antibody (100 μl of sheep anti-bovine IgG conjugated with horseradish peroxidase), which was diluted 1:1 25 000, was transferred to each well. After 60 min of incubation, the detection antibody was poured out and each well was washed five times. Substrate solution (100 μl) was transferred to each well. The plate was incubated for 20 min. To stop the reaction, 100 μl of 2 M sulfuric acid was transferred to each well. The wavelength was read at 450 nm using a Versamax tunable microplate reader (Molecular Devices, Sunnyvale, CA, USA) and the concentration of IgG (mg/dl) was calculated. The intra- and inter-assay CV were 6.04% and 9.53%, respectively. Plasma cortisol was measured in samples collected during the LPS challenge using a commercial radioimmunoassay kit (Coat-A-Count Cortisol kit; Siemens Healthcare Diagnostics, Tarrytown, NY, USA). Total counts, non-specific binding and calibrators were counted in triplicates whereas plasma samples were in duplicates. The intra-assay CV was 13.7%.
Intramammary lipopolysaccharide challenge and sampling
At the end of week 2 of treatment, all cows were administered a commercially available vaccine for environmental mastitis (J5 Bacterin; Pfizer, New York, NY, USA). At the end of week 5 of treatment, all cows were fitted with a single indwelling jugular catheter 1 day before an intramammary LPS challenge as described by Waldron et al. (Reference Waldron, Kulick, Bell and Overton2006). Briefly, 25 mg of LPS (Escherichia coli 0111:B4; Sigma-Aldrich Chemical Co., St. Louis, MO, USA) was dissolved in 500 ml of sterile 0.9% NaCl solution to yield a stock solution concentration of 50 μg of LPS/ml. This stock LPS solution was stored at 4°C for the duration of the experiment. One day before the experimental day, 5 ml of the LPS stock solution was added to 20 ml of sterile 0.9% NaCl to create a 10-μg LPS/ml solution that was stored overnight at 4°C. The solution (10 ml) containing 100 μg of LPS was administered into each teat canal of left two homolateral mammary gland quarters using a 12-cc syringe tipped with an ethylene oxide-sterilized, J-12 teat infusion cannula (Jorgensen Laboratories, Inc., Loveland, CO, USA). Teat ends were wiped thoroughly with sterile gauze moistened with 70% ethanol prior to cannula insertion. After infusion, mammary quarters were firmly massaged for 30 s to promote treatment dispersion throughout the infused quarters. Samples of blood (12 ml) were collected using syringes from the jugular catheter at 30-min intervals beginning immediately prechallenge and continuing for the 8-h period following LPS administration. The samples were transferred into heparinized test tubes containing Na-heparin for a final concentration of 30 U/mL of Na-heparin as an anticoagulant and placed on ice. Samples of blood also were collected by coccygeal venipuncture at 24 and 48 h post-challenge using heparinized evacuated tubes (Vacutainer, Becton Dickinson, Franklin Lakes, NJ, USA). Hematocrit was measured on whole blood, plasma was harvested by centrifugation (2800×g for 15 min at 4°C), and two 1-ml aliquots were prepared, snap-frozen in liquid nitrogen, and stored at −20°C until analysis. Rectal temperatures and heart rates were monitored and recorded at 30-min intervals concurrently with the blood collection.
Productive performance
Milk yields were recorded at all milkings beginning at week 2 of pretreatment period. Milk samples were collected on 1 day/week from all three milkings. Samples were composited and stored at 4°C with a preservative (Bronopol tablet; D&F Control System, San Ramon, CA, USA) until analyzed (Dairy One Cooperative Inc., Ithaca, NY, USA) within 24 h for fat, protein, lactose, total solids and milk urea nitrogen using IR analysis (method 972.160; Association of Official Analytical Chemists (AOAC) 2000), and somatic cell counts by an optical fluorescent method (method 978.26; AOAC, 2000).
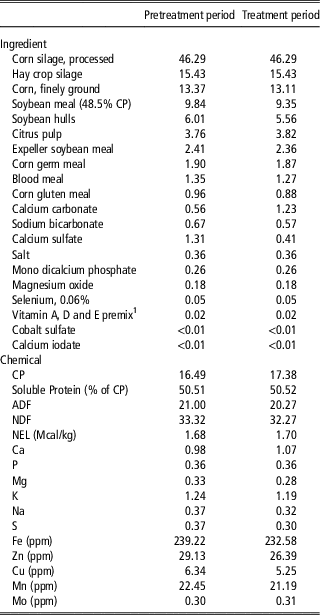
Ingredient and chemical composition of the diets fed during the pretreatment and treatment periods of the experiment are described in Table 1. All non-forage ingredients were blended by a commercial feed mill into separate concentrate mixtures, and diet mixing at the farm consisted of mixing the component forages with the appropriate concentrate mixture. Fresh feed was provided each morning at 1000 h, orts were weighed and recorded daily and water was made available at all times. Samples of the forages and concentrate mixtures were obtained weekly throughout the experiment, and DM content determined by drying at 55°C until static weight was achieved. Amounts of individual feed components in the total mixed ration (TMR) were adjusted weekly based on changes in the DM content of these feed components. Dry matter content of these TMR were used in calculation of dry matter intake (DMI) for the corresponding week. The weekly samples of forages, concentrate mixtures and TMR were composited into 4-week composite samples and submitted to a commercial laboratory for wet chemistry analysis (Dairy One Cooperative Inc., Ithaca, NY, USA). Samples were analyzed for DM (AOAC, 2000; method 930.15), CP (AOAC, 2000; method 990.03), ADF and NDF (Van Soest et al., Reference Van Soest, Robertson and Lewis1991), soluble CP and macro- and microminerals (Sirois et al., Reference Sirois, Reuter, Laughlin and Lockwood1994). Body condition score (BCS) was assessed (1 to 5 scale; Wildman et al., Reference Wildman, Jones, Wagner, Boman, Troutt and Lesch1982) using the average of two individual scorers and BW of each animal was measured using a weigh scale at weeks 0, 3 and 6 of treatment.
Ingredient and chemical composition (dry matter (DM) basis, % of DM unless otherwise noted) of experimental diets fed during the pretreatment and treatment periods to dairy cows and topdressed with inorganic v. organic sources of trace minerals at two different levels

NEL=net energy for lactation.
1 Contained 37 113 IU/kg of vitamin A, 7216 IU/kg of vitamin D and 72 165 IU/kg of vitamin E.
Statistical analyses
Data for milk yield and DMI were reduced to weekly means before analysis. Effects of mineral treatments on weekly variables (oxidative metabolism indices, IgG and productive performance) were evaluated using the MIXED procedure of SAS version 9.1 (SAS Institute, Cary, NC, USA) for a randomized complete block design with a 2×2 factorial arrangement of treatments. Cow was the experimental unit. Model terms were block, level, source, week and two- and three-way interactions of the main effects with week. Data obtained during the last week of the pretreatment period were used as covariates during their respective analyses and retained in the model if P-value was <0.20. The random effect was cow nested within the interaction of level and source of trace mineral. For each variable, four covariance structures (first-order autoregressive, heterogeneous first-order autoregressive, compound symmetry and heterogeneous compound symmetry) were tested and the structure yielding the smallest Akaike’s information criterion was selected. The method of Kenward–Rogers was used for calculation of denominator degrees of freedom. In addition, statistical analysis was conducted using data from week 1 only (represents immediate effects of trace mineral supplementation) and week 6 only (represents 1 week following LPS challenge) using the MIXED procedure of SAS. Terms in the model included block, level, source and the interaction of level and source. Effects of treatment on responses after LPS challenge were evaluated as above using SAS for both area under the curve analysis (calculated using cubic spline interpolation and the trapezoidal rule using the EXPAND procedure of SAS) and repeated measures analysis. Values at time 0 were used as covariates. Significance was declared at P<0.05 and trends toward a significant different at 0.05<P<0.15. Least squares means are presented throughout.
Results and discussion
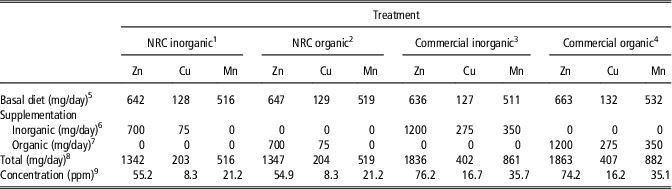
One cow assigned to the NRC organic source treatment was removed from the data set of weekly variables because of hip dislocation. Therefore, the number of cows per treatment were 11 for NRC organic and 12 each for NRC inorganic, Commercial inorganic and Commercial organic. Analyses of the experimental diets (Table 1) indicated that the profiles of macro- and micronutrients were similar during the pretreatment and treatment periods with the exception of sulfur, which was higher during the pretreatment period as designed. Because Fe and Mo were topdressed during the pretreatment period and not during the treatment period, the smaller difference of sulfur than intended between the pretreatment and treatment periods likely did not affect the results of the present study. Excessive sulfur can interfere with absorption of other elements, especially Cu and selenium (NRC, 2001). Iron can also interfere with the other minerals, primarily Cu and Zn. Feeding 250 ppm of Fe has been implicated as a cause of Cu depletion in cattle (Bremner et al., Reference Bremner, Humphries, Phillippo, Walker and Morrice1987; Phillippo et al., Reference Phillippo, Humphries and Garthwaite1987). Molybdenum and sulfur can interact and synergistically inhibit Cu absorption (NRC, 2001). As for Mo itself, as little as 5 ppm of Mo has been demonstrated to cause Cu depletion in heifers (Bremner et al., Reference Bremner, Humphries, Phillippo, Walker and Morrice1987; Phillippo et al., Reference Phillippo, Humphries and Garthwaite1987). Thus, the combination of 0.40% of sulfur, 250 ppm of Fe and 5 ppm of Mo used in our study was considered sufficient for practical purposes to lower trace mineral status, although we cannot assess whether status was actually depleted. Based upon actual analysis of the forage and concentrate ingredients fed and dividing the topdressed supplement amounts across the actual DMI for cows assigned to the different treatment groups, actual concentrations for the NRC level averaged 55, 8 and 21 ppm for Zn, Cu and Mn, respectively, and 75, 16 and 36 ppm for the commercial level. The amounts of Zn, Cu and Mn from basal and supplemental sources consumed by cows assigned to the four treatment groups are provided in Table 2.
The calculated amounts of zinc (Zn), copper (Cu) and manganese (Mn) consumed by cows fed supplemental trace minerals at National Research Council (NRC, 2001) or commercial levels from either inorganic or organic sources

1 NRC (2001) levels using inorganic trace mineral supplements only.
2 NRC (2001) levels using organic trace mineral supplements only.
3 Commercial levels (approximately two times NRC requirement) using inorganic trace mineral supplements only.
4 Commercial levels using organic trace mineral supplements only.
5 Calculated from actual dry matter intake (DMI) and mineral composition during treatment period.
6 Zinc sulfate monohydrate, cupric sulfate pentahydrate and manganese sulfate monohydrate for Zn, Cu and Mn, respectively.
7 Zn, Cu and Mn chelated to 2-hydroxy-4-(methylthio)-butanoic acid.
8 Sum of basal diet and supplementation.
9 Calculated from sum divided by actual DMI.
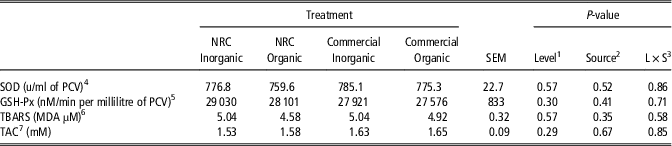
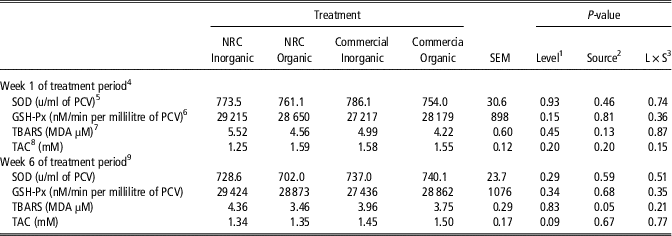
Effects of treatment on activities of SOD and GSH-Px in erythrocyte lysate and concentrations of TBARS and TAC in plasma were not significant when evaluated across the entire experimental period (Table 3). Although the activity of SOD was not affected by treatment when evaluated during only week 1 or 6 after assignment to treatment (Table 4), a trend (P=0.15) existed for decreased GSH-Px activity in erythrocyte lysate for cows fed the commercial level of trace minerals during week 1 of treatment. Differences among treatments in GSH-Px activity evaluated during week 6 of treatment only were not significant. As described by Sies (Reference Sies1991), SOD and GSH-Px are enzymatic antioxidants and both of them are mineral-dependent enzymes. In our study, however, effects of trace mineral level and source on SOD activity were not significant, despite a recent report that serum SOD and GSH-Px were higher in cows fed HMTBa-chelated forms than those fed sulfate forms when 50 ppm of Zn, 12 ppm of Cu and 20 ppm of Mn were supplemented for 6 months (Zhao et al., Reference Zhao, Li, Wang, Xing, Wang, Wang and Wang2015). Bengoumi et al. (Reference Bengoumi, Essamadi, Charcornac, Tressol and Faye1998) reported that no correlation was detected between plasma Cu concentration and erythrocyte SOD activity, whereas there were positive relationships between plasma Zn concentration and the activity when supplementing 1000 mg/day of Zn and 240 mg/day of Cu for 3 months, which are twice the daily calculated requirements for the cows. Differences among results of studies may relate to the duration of supplementation in the context of turnover time of these enzymes as well as supplementation level.
Least squares means for indices of oxidative metabolism from weekly blood samples collected from cows fed zinc, copper and manganese at National Research Council (NRC, 2001) or commercial levels from either inorganic or organic sources

L=level; S=source; SOD=superoxide dismutase; PCV=packed cell volume; GSH-Px=glutathione peroxidase; TBARS=thiobarbituric acid reactive substances; MDA=malondialdehyde; TAC=total antioxidant capacity.
1 Effect of level: NRC (2001) level v. commercial level (approximately two times NRC requirement).
2 Effect of source: inorganic v. organic.
3 Effect of interaction between L and S.
4 SOD, expressed in units/ml of PCV.
5 GSH-Px, expressed in nM/min per millilitre of PCV.
6 Plasma TBARS, expressed in malondialdehyde (MDA) µM concentration.
7 Plasma TAC.
Least squares means for indices of oxidative metabolism at weeks 1 and 6 of treatment period from weekly blood samples collected from cows fed zinc, copper and manganese at National Research Council (NRC, 2001) or commercial levels from either inorganic or organic sources

L=level; S=source; SOD=superoxide dismutase; PCV=packed cell volume; GSH-Px=glutathione peroxidase; TBARS=thiobarbituric acid reactive substances; MDA=malondialdehyde; TAC=total antioxidant capacity.
1 Effect of level: NRC (2001) level v. commercial level (approximately two times NRC requirement).
2 Effect of source: inorganic v. organic.
3 Effect of interaction between L and S.
4 Represents blood samples collected at week 1 of treatment only.
5 SOD, expressed in units/mL of packed cell volume (PCV).
6 GSH-Px, expressed in nM/min per millilitre of PCV.
7 Plasma TBARS, expressed in MDA µM concentration.
8 Plasma TAC.
9 Represents blood samples collected at week 6 of treatment only.
Trace mineral level and source did not affect plasma TBARS as assessed over the 6-week supplementation period (Table 3); however, cows supplemented with organic trace minerals tended (P=0.13) to have lower TBARS during week 1 of treatment and had lower (P=0.05) TBARS during week 6 of treatment (Table 4). Thiobarbituric acid reactive substances had been considered to represent a composite index of lipid oxidative end products including MDA and used as an indicator of oxidative stress in dairy cattle (Bernabucci et al., Reference Bernabucci, Ronchi, Lacetera and Nardone2005; Tanaka et al., Reference Tanaka, Kamiya, Suzuki and Nakai2011); however, it has been suggested more recently that the TBARS assay is rather unspecific for MDA (Celi, Reference Celi2011). The non-specificity for MDA might be one of reasons for a lack of significant treatment effects. Further research is needed to elucidate the effects of trace minerals on lipid peroxidation using additional indices that may have greater utility as discussed by Celi (Reference Celi2011).
Total antioxidant capacity represents total endogenous antioxidant capacity including enzymatic antioxidants, non-enzymatic proteinaceous antioxidants and non-enzymatic small molecular antioxidants. Effects of treatment on TAC were not significant when evaluated across the entire treatment period (Table 4). However, a trend (P=0.15) existed for an interaction of trace mineral level and source during week 1 of treatment, such that cows fed inorganic trace minerals at NRC (2001) recommended levels had lower TAC than cows fed organic trace minerals at NRC levels or cows fed either source at commercial levels (Table 4). In addition to responses during week 1, plasma TAC tended (P=0.09) to be higher during week 6 of treatment for cows supplemented with the commercial levels of trace minerals, regardless of source (Table 4), perhaps suggesting improved recovery from or better maintenance of status following LPS challenge.
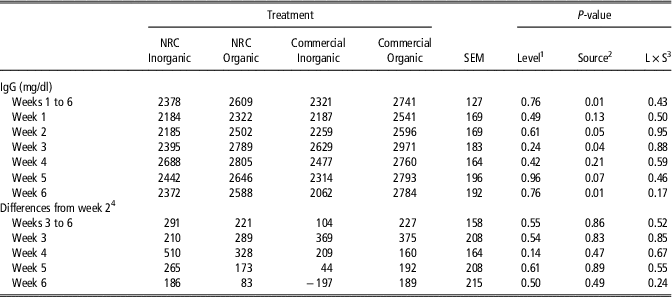
Results for plasma IgG concentrations over both the entire experimental period and by individual weeks of the treatment period are presented in Table 5. Cows fed organic trace minerals had higher plasma concentrations of IgG during the entire period, which was reflected by responses or trends toward responses during many of the individual weeks. Because treatment differences were apparent before J5-Bacterin vaccination, data are also presented for weeks 3 to 6, expressed as a difference from week 2 (Table 5, lower panel). When expressed in this manner, differences in plasma IgG among treatments were not significant. Although all cows in the current study were routinely administered J5 vaccination during the periparturient period per herd standard operating procedures, reasons for the increased circulating IgG levels in cows fed organic trace minerals throughout the treatment period are not known. The production of antibodies for some specific antigens other than J5 antigen might be supported by organic trace mineral treatments. Nemec et al. (Reference Nemec, Hidiroglou, Nielsen and Proulx1990) reported that vitamin E supplementation in beef heifers showed a tendency for higher titers against Salmonella Typhimurium even before vaccination challenge of Brucella abortus than no supplementation and selenium supplemented groups. Presumably, vitamin E supplementation enhanced the production of antibody in several cows whose humoral system had been activated by previous exposure to S. Typhimurium (Nemec et al., Reference Nemec, Hidiroglou, Nielsen and Proulx1990). Although we did not investigate the type of pathogen exposure of the cows before enrollment in our study other than the periparturient J5 vaccination, organic minerals might affect immune system to enhance the production of antibodies to the pathogens in a manner analogous to vitamin E. When administered a killed rabies vaccination, which was designed to allow for exposure to a novel antigen, cows fed organic trace minerals had significantly increased vaccine antibody titer compared with those fed inorganic trace minerals (Nemec et al., Reference Nemec, Richards, Atwell, Diaz, Zanton and Gressley2012). Therefore, a relatively novel antigen might elicit clearer IgG level response to vaccination. Further studies are needed to investigate whether organic minerals enhance the production of antibodies specific to J5 antigen as well as previous exposure. Although we described patterns of response of plasma IgG during the experimental period, our experimental approach of the J5 booster vaccination before the LPS challenge was intended to increase the chance that cows fed different levels and sources of trace minerals would respond differently to the intramammary LPS challenge. As expected, LPS challenge elicited significant increases in plasma cortisol, which peaked at 240 min post-challenge; however, differences of responses to LPS challenge among treatments assessed either by treatment by time interactions or as calculated area under the curve (Table 6) were not significant.
Least squares means for plasma immunoglobulin G (IgG) level from weekly blood samples collected from cows fed zinc, copper and manganese at National Research Council (NRC, 2001) or commercial levels from either inorganic or organic sources

L=level; S=source; IgG=immunoglobulin G.
1 Effect of level: NRC (2001) level v. commercial level (approximately two times NRC requirement).
2 Effect of source: inorganic v. organic.
3 Effect of interaction between L and S.
4 Represents a difference of IgG (mg/dl) from the level at week 2.
Least squares means for area under the curve for cortisol and clinical parameters after lipopolysaccharide (LPS) challenge administered to cows fed zinc, copper and manganese at National Research Council (NRC, 2001) or commercial levels from either inorganic or organic sources

1 Effect of level: NRC (2001) level v. commercial level (approximately two times NRC requirement).
2 Effect of source: inorganic v. organic.
3 Effect of interaction between L and S.
4,5,6 Represents area under the curve for cortisol, body temperature and heart rate after LPS challenge from time 0 to 2880 min.
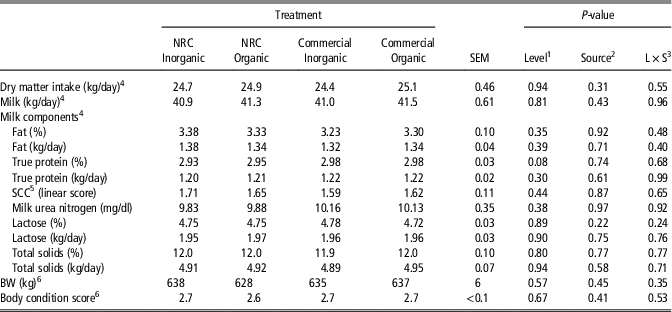
Productive performance data (DMI, milk yield, milk components, BCS and BW) are presented in Table 7. Responses of productive variables to treatment were not significant.
Least squares means for productive performance of cows fed zinc, copper and manganese at National Research Council (NRC, 2001) or commercial levels from either inorganic or organic sources

L=level; S=source; SCC=somatic cell count.
1 Effect of level: NRC (2001) level v. commercial level (approximately two times NRC requirement).
2 Effect of source: inorganic v. organic.
3 Effect of interaction between level L and S.
4 Represents data from weeks 1 to 4 only.
5 SCC: linear score=logarithm of (SCC/1000) to base 10.
6 Represents data during 6-week treatment period.
In conclusion, feeding NRC (2001) or commercial (1.5 to 2 times NRC) levels of Zn, Cu and Mn from inorganic v. organic sources resulted in little change in indices of oxidative metabolism in midlactation cows. Activities of antioxidant enzymes (GSH-Px and SOD) were not responsive to level or source of trace minerals. Although cows had a vigorous response to LPS administration as evidenced by changes in plasma cortisol concentrations and clinical indices, trace mineral feeding level and source did not affect responses of these variables to LPS challenge. Productive performance was not affected by treatments in this experiment. Overall, results suggest that varying level and source of dietary trace minerals in a short-term experiment did not alter indices of oxidative metabolism and did not affect clinical responses to activation of the immune system through intramammary LPS challenge in midlactation cows.
Acknowledgements
The authors sincerely appreciate the assistance of the following individuals in completing the study at Cornell University: J. Gavalchin, L. Warnick, K. Smith, M. Ramos, F. Soberon, K. Schoenberg, L. Winkelman, J. Huzzey, C. Ryan, J. Lukas, D. Gentile, M. Hurley and the staff at the Cornell University Dairy Teaching and Research Center. This study was funded in part by Novus International.
Declaration of interest
The co-authors Bowman, Vázquez-Añon, Richards and Atwell are currently or were employees of Novus International at the time of conduct of this experiment, which is the manufacturer of the organic trace mineral sources used in this experiment.
Ethics statement
The Cornell University Institutional Animal Care and Use Committee reviewed and approved all procedures involving animals.
Software and data repository resources
None of the data were deposited in an official repository.