Quantitative research is prevalent in second language acquisition (SLA) research, as well as the broader discipline of applied linguistics (AL) (Gass, Reference Gass, Ritchie and Bhatia2009; Khany & Tazik, Reference Khany and Tazik2019; Lazaraton, Reference Lazaraton2000; Loewen & Gass, Reference Loewen and Gass2009; Plonsky, Reference Plonsky, Loewen and Sato2017; Plonsky & Gass, Reference Plonsky and Gass2011). Crucial to quantitative analysis are statistical techniques, such as descriptive statistics (e.g., measures of central tendency, variance), basic inferential statistics (e.g., t-tests, correlations, analysis of variance), and more sophisticated techniques used to model complex relationships (e.g., structural equation modeling, mixed-effects models, cluster analysis). When coupled with strong research designs and informative reporting, quantitative research has the potential to yield generalizable and synthesizable findings that advance theory and inform practice. However, poor statistical analyses can provide misleading information and threaten the epistemological integrity of AL and SLA as academic disciplines.
Despite the importance of statistical analysis, AL and SLA researchers are not always confident in their ability to interpret and use statistics (Gonulal, Loewen, & Plonsky, Reference Gonulal, Loewen and Plonsky2017; Lazaraton, Riggenbach, & Ediger, Reference Lazaraton, Riggenbach and Ediger1987; Loewen et al., Reference Loewen, Lavolette, Spino, Papi, Schmidtke, Sterling and Wolff2014), which might reflect a lack of statistical knowledge. Consequently, we note the potential value of a discipline periodically taking stock of its methodological training and knowledge (e.g., Lazaraton et al., Reference Lazaraton, Riggenbach and Ediger1987; Loewen et al., Reference Loewen, Lavolette, Spino, Papi, Schmidtke, Sterling and Wolff2014) to ensure methodological rigor and to guide professional development (Gonulal et al., Reference Gonulal, Loewen and Plonsky2017). Even though statistical knowledge is crucial for producers and consumers of AL and SLA research, to our knowledge no study has attempted to measure it; thus, the current study aims to assess the basic statistical knowledge of AL and SLA researchers who have completed their professional, graduate training.
STATISTICAL KNOWLEDGE IN SLA
A “methodological turn” in SLA (Byrnes, Reference Byrnes2013, p. 825) has placed increased attention on the quality of research conducted and published in the field. Constructively, researchers have produced discipline-specific statistical resources (e.g., Larson-Hall, Reference Larson-Hall2010; Mackey & Gass, Reference Mackey and Gass2015; Plonsky, ed., 2015) to promote statistical knowledge and best practices. More critically, several researchers have written position papers about specific statistical practices they feel need to be either abandoned, such as Null Hypothesis Significance Testing (Norris, Reference Norris2015), or more frequently incorporated, such as calculating and reporting effect sizes (Plonsky, Reference Plonsky and Plonsky2015). Additionally, several studies (e.g., Plonsky, Reference Plonsky2013, Reference Plonsky2014; Plonsky & Gass, Reference Plonsky and Gass2011) have analyzed methodological quality in published AL and SLA literature, and have called for increased rigor in analysis and reporting, such as calculating and reporting confidence intervals around means and effect sizes. Misuse and misunderstandings of statistics threaten the credibility of quantitative AL and SLA research, and undermine the legitimacy of the field. The widely known “Replication Crisis” in the sister discipline of psychology, which is attributed in part to statistical errors and misuse of statistics, illustrates the seriousness of such a threat (Shrout & Rodgers, Reference Shrout and Rodgers2018). While authors (e.g., Norris, Reference Norris2015; Plonsky Reference Plonsky2013, Reference Plonsky2014; Plonsky & Gass, Reference Plonsky and Gass2011) draw attention to methodological issues surrounding published SLA studies and provide information about how to improve quantitative AL and SLA research, little research has investigated the statistical knowledge of AL and SLA researchers who must understand and apply statistics to generate and synthesize knowledge in the field.
A few scholars (Gonulal et al. Reference Gonulal, Loewen and Plonsky2017; Lazaraton et al., Reference Lazaraton, Riggenbach and Ediger1987; Loewen et al., Reference Loewen, Lavolette, Spino, Papi, Schmidtke, Sterling and Wolff2014) have investigated the self-reported statistical knowledge of SLA professorsFootnote 1 and graduate students using surveys and questionnaires. For example, Lazaraton et al. surveyed 121 members of the Teachers of English to Speakers of Other Languages (TESOL) organization, finding that on average professors and researchers had taken two courses in statistics. Importantly, only 26% of respondents felt that their training was adequate. Confidence in interpreting statistical terms was stronger for more basic concepts (e.g., mean) than more technical or advanced terms (e.g., Rasch model). Twenty-seven years later, the results of Loewen et al.’s (Reference Loewen, Lavolette, Spino, Papi, Schmidtke, Sterling and Wolff2014) partial replication of Lazaraton et al. painted a similar picture: the 157 professors and 158 graduate students had taken a median of two statistics courses (M = 2.3) and had low confidence in their understanding of more advanced statistics terminology. In comparison with Lazaraton et al.’s (Reference Lazaraton, Riggenbach and Ediger1987) participants, however, higher confidence was reported for many basic and several advanced terms (e.g., effect size, factor analysis, power). Additionally, in Loewen et al. (Reference Loewen, Lavolette, Spino, Papi, Schmidtke, Sterling and Wolff2014), approximately two-thirds of researchers felt their statistical training was at least somewhat adequate, whereas two-thirds of researchers in Lazaraton et al. (Reference Lazaraton, Riggenbach and Ediger1987) felt their training was not adequate.
In a similar study, Gonulal et al. (Reference Gonulal, Loewen and Plonsky2017) investigated 50 SLA graduate students’ perceptions of the development of their statistical knowledge during semester-long, discipline-specific statistics courses. The results from the self-report data showed that students claimed to have increased their knowledge of basic descriptive and common inferential statistics, whereas weak gains in knowledge of advanced statistics were reported. Although providing insight into the state of statistical knowledge in the field, these studies relied on self-reports rather than empirical measures of statistical knowledge, which may or may not correspond. In a more recent study, Gonulal (Reference Gonulal2019) used the same statistical knowledge test used in the current study to examine the statistical knowledge and training of SLA doctoral students in North America. Participants achieved an overall score of 59%. Their knowledge of basic statistical concepts and common inferential statistics was good but their ability to interpret statistical procedures was lower.
PURPOSE AND RESEARCH QUESTIONS
Examining the statistical knowledge of AL and SLA researchers by empirically investigating their ability to understand and interpret basic statistical information is a logical, but underinvestigated step in understanding and subsequently improving the use of statistics in the field. Consequently, the present study seeks to describe and evaluate the basic statistical knowledge of AL and SLA researchers by asking the following questions:
1. What knowledge do AL and SLA researchers who have finished their graduate training possess about basic statistics?
2. What is the relationship between actual and self-perceived knowledge of basic statistics?
3. To what degree do researcher background variables explain differences in statistical knowledge?
With respect to RQ1, we expect AL and SLA researchers to demonstrate general mastery of basic statistical knowledge. Such knowledge is vital not just to conducting one’s own quantitative research, but also for appropriately and critically interpreting research in the field. In this study, basic statistical knowledge is operationalized as a test based on statistical concepts that are featured in introductory quantitative research methods courses (Gonulal et al., Reference Gonulal, Loewen and Plonsky2017) and are commonly used in L2 research (Gass, Reference Gass, Ritchie and Bhatia2009; Khany & Tazik, Reference Khany and Tazik2019). Our expectation is that PhD-holding professionals should have basic-level mastery of these concepts.
Previous studies on the statistical knowledge of L2 researchers utilized confidence ratings and/or perceptions of statistical knowledge. RQ2 connects those studies to the present study by linking our objective measure of statistical knowledge to researcher perceptions of knowledge elicited with confidence ratings. A strong relationship between objective and self-perceived measures of statistical knowledge would imply that self-ratings may serve as a useful proxy for assessing statistical knowledge while moderate-to-weak relationships would question that approach.
RQ3 explores the influences of training and practices relevant to developing basic statistical knowledge for L2 research. We expect that more statistics courses and quantitative research experience will be associated with greater levels of statistical knowledge. Findings from this question can provide guidance for graduate programs and professional development programs for faculty.
METHOD
The current study is exploratory in nature and employs a cross-sectional survey design. Thus, we sought to describe characteristics of the participants being studied and uncover potential relationships among variables of interest.
DATA COLLECTION AND PARTICIPANTS
Data Collection Procedures
The population was identified as PhD-holding researchers in AL and SLA. AL is a broad field of enquiry investigating language-related issues in society, and its disciplinary boundaries are fluid (e.g., Hall, Smith, & Wicaksono, Reference Hall, Smith and Wicaksono2017). SLA is one subfield of AL that has been strongly influenced by methodological concerns. Participants were asked to self-report their major field of study; however, we did not ask for further disciplinary information. It is beyond the scope of this study to sort out disciplinary boundaries; therefore, we rely on the participants’ self-designations of their disciplinary perspectives in the following discussions.
Data were collected in two waves, the first in 2015 and the second in 2017.Footnote 2 The first wave targeted AL and SLA researchers located in North America, and the second wave targeted researchers in Europe. In both waves, we used snowball sampling (Dörnyei & Csizér, Reference Dörnyei, Csizér, Mackey and Gass2012) whereby targeted recruitment e-mails were passed along by participants to other members of the population. Because previous research on statistical knowledge in AL and SLA has involved primarily participants located in North America and Europe, we limited our investigation to these regions. While many excellent AL and SLA researchers work outside of North America and Europe, less is known about statistical training in these regions. Consequently, we did not target researchers in these geographic regions in our recruitment efforts, and data from any such participants who responded due to snowball sampling (i.e., 5 from Australasia, 22 from Asia) were removed from the analysis.
For the first wave, we recruited participants online through (a) broad AL-related and SLA-related listservs, such as LTEST-L and Linguistlist, and specific listservs such as the Center for Applied Linguistics Listserv and the Northern Arizona University Applied Linguistics Listserv, and (b) targeted personal e-mails to known AL and SLA professionals in North America, who were encouraged to circulate the e-mail to other colleagues. The second wave followed similar data collection procedures. Recruitment e-mails were sent to listservs such as for the British Association for Applied Linguistics (BAAL), the European Second Language Association (EUROSLA), and the Spanish Society for Applied Linguistics (AESLA), as well as AL and SLA listservs specific to other countries such as Austria, Finland, Germany, Italy, and the Netherlands. E-mails were also sent to known AL and SLA researchers working in Europe, with the same encouragement to pass along the invitation to eligible peers and colleagues.
Participants
In total, we recruited from 15 listservs (Wave 1 = 4, Wave 2 = 11) and sent out e-mails to 635 (232 + 403) individuals. Due to our use of snowball sampling, it is difficult to estimate the response rate. We received 676 preliminary responses, consisting minimally of clicking the link to access the survey (Wave 1 = 220, Wave 2 = 456). After eliminating all participants who did not complete the entire survey or otherwise failed to meet inclusion criteria (e.g., had not yet obtained a doctorate, indicated their academic field was not related to SLA), 198 participants (29.3%) remained. Information from the background questionnaire indicated the following. The mean participant age was 43.01 years old (SD = 10.04), and the average year of earning a doctoral degree was 2006 (M = 2006.77, SD = 8.48, median = 2009). More participants were female (n = 126, 63.6%) and located in Europe (n = 125, 63%, including countries such as Croatia, Germany, Greece, Italy, Spain, the United Kingdom).
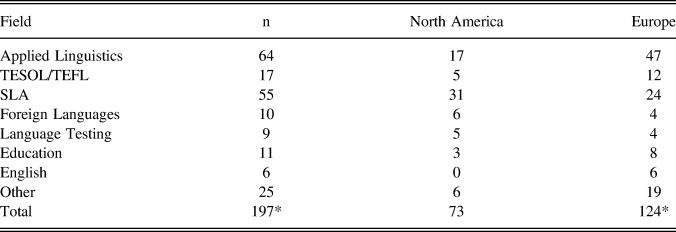
Participants largely self-identified as researchers (M = 3.52, SD = 0.88, 95% CI [3.40, 3.65] on a scale from 0 [not at all] to 5 [exclusively]). From a list of options shown in Table 1, most participants indicated their major field of research as either AL (n = 64) or SLA (n = 55). A smaller number selected more specific SLA subfields, and 27 participants wrote in “Other” subfields, such as “first language acquisition/bilingualism” and “developmental psycholinguistics” or emphasized two major research areas, such as “Hispanic linguistics/SLA.” Further information about disciplinary background was not collected.
Participants’ major fields of research

* One participant did not indicate a major field, but indicated that they had taken a statistics course in a linguistics department.
MATERIALS
Statistical Knowledge Test
The main instrument in this study was the statistical knowledge test (SKT), an online survey administered using Qualtrics survey software (Gonulal, Reference Gonulal2016) (see online supplementary materials). The SKT used SLA-specific material to measure researchers’ ability to understand basic statistical concepts and procedures, to select and interpret statistical analyses, and to critically evaluate statistical information and data-related claims. The instrument was developed based on several existing statistical resources, including (a) Finney and Schraw’s (Reference Finney and Schraw2003) statistics self-efficacy survey, (b) several SLA-oriented statistics or research methods textbooks (e.g., Larson-Hall, Reference Larson-Hall2010; Mackey & Gass, Reference Mackey and Gass2015), and (c) statistics course syllabi collected from several North American SLA programs. An initial instrument with 30 multiple-choice items was piloted and modified, based on feedback from two experienced, quantitatively oriented SLA researchers who have written about quantitative research methodology. The operational version of the survey contained 28 items, with 8 items addressing basic statistical concepts, 10 items descriptive statistics, and 10 items inferential statistics (see Appendix A for a detailed breakdown of the test). The items were arranged into six scenarios with two to seven items per scenario. Each scenario focused on a different set of related statistical concepts. In addition, the scenarios presented common SLA research issues, such as the relationship between formal instruction or individual difference factors, on the one hand, and L2 development, on the other. However, no knowledge of SLA theory or research was necessary to understand the statistical concepts. The scenarios were presented in random order to minimize ordering effects; however, the order of items within each scenario was held constant because some items built on information tested in previous items. Following each item, a prompt elicited participants’ confidence in their answer on a 0–10 Likert-type scale (“Not Confident at All” to “Very Confident”); these confidence ratings were averaged for each participant to obtain an overall confidence score for their basic statistical knowledge. In addition, the study employed a background questionnaire that targeted demographic information and the training participants had received in quantitative research methods. Reliability and validity measures of the SKT are presented in the “Analyses” section.
PROCEDURE
Participants first completed the online background questionnaire and then the SKT. At the end of the SKT, participants could leave further comments about the test and their quantitative training.
ANALYSES
Test Scores
To analyze the results of the SKT, individual item responses were examined using a dichotomous Rasch model (Rasch, 1960/1980) which explains variance in item responses according to person abilities and item difficulties.Footnote 3 Rasch models have the useful feature of placing the ability of individual participants and the difficulty of items on the same, interval-level scale measured in logits (log-odds units). This measurement allows for the meaningful comparison of person abilities and item difficulties. For example, a participant whose ability is measured at 1 logit has a .5 probability of correctly answering an item with a difficulty of 1 logit. Someone with an ability of 3 logits has a .88 probability of correctly answering that same item. As a result, the Rasch model allowed us to ascertain which statistical concepts individuals with different levels of knowledge were likely to know. All Rasch analyses were run in Winsteps version 3.81.0 (Linacre, Reference Linacre2014).
To determine Rasch model fit, several pieces of evidence are commonly obtained. First, the Rasch model assumes unidimensionality, meaning that the test should measure a single construct (in this case statistical knowledge). By examining model residuals, it is possible to see whether patterns in unexplained variance are consistent and substantial enough to compromise unidimensionality. On the 28-item SKT, Rasch parameters for person ability and item difficulty explained 40.9% of observed response variance. A principal components analysis (PCA) of Rasch model residuals was used to detect patterning among residuals (i.e., variance unexplained by the unidimensional Rasch model parameters) that might suggest the existence of additional, undesired dimensions of measurement (Linacre, Reference Linacre2014). The first contrast in the PCA had an eigenvalue of 2.09 (surpassing a recommended threshold of 2.0), accounting for 4.4% of total variance in responses. More detailed examination of the first contrast did not yield any distinct patterning among items. Thus, there did not appear to be any substantial additional dimensions of measurement and the unidimensionality assumption was considered satisfied.
Second, person reliability, which describes the probability of people with similar abilities scoring comparably on the same items, should ideally be above .80. The 28-item SKT had a Cronbach’s alpha of .92, based on 198 respondents. While this reliability index is high, we also took a Rasch approach to examining measurement qualities. The Rasch person separation reliability was .86 (separation index = 2.45), exceeding minimum standards.
Last, the fit of items and people to the model are examined, and poorly fitting items or people may be removed. Rasch utilizes two fit statistics, infit and outfit, to diagnose the fit of items and people to the model. Infit is calculated based on unexpected responses to items with difficulty near an individual’s ability (i.e., items of generally moderate difficulty), whereas outfit is based on unexpected responses to items with difficulty far from an individual’s ability (i.e., unexpected responses to relatively very easy/hard items). Infit and outfit values are on a scale of 0 to positive infinity with an ideal value of 1; values between .7 and 1.3 are generally considered to show good fit (Wright & Linacre, Reference Wright and Linacre1994). To further ensure quality measurement of the statistical knowledge construct, we investigated and removed items with poor fit. Items 5 and 22, which had moderate difficulty (Item 5 = .78 logits, Item 22 = .69 logits), misfit the Rasch model (Item 5 infit = 1.46, outfit = 1.78; Item 22 infit = 1.29, outfit = 1.69). Upon examination, these two items each appeared to have two plausible responses. Moreover, respondents who chose the plausible alternative had average abilities equal to (Item 5) or greater than (Item 22) respondents who selected the correct response. Thus, these two items were removed and the Rasch model was reestimated.
The removal of Items 5 and 22 did not result in a substantial reduction in measurement quality: person reliability dipped only slightly to .85 (separation index = 2.39) while retaining a Cronbach’s alpha of .92. Beneficially, the total proportion of variance explained by the Rasch model increased to 44.5% (up from 40.9% in the 28-item SKT). Rasch person measures (i.e., interval-scaled logits representing a respondent’s ability) correlated with raw-score totals at .97. All subsequent results are based on this 26-item version of the SKT. While a handful of other items misfit to some degree, we determined that (a) the items were constructed appropriately and that (b) removing them did not substantially improve the fit of the Rasch model.
Correlation
To examine the relationship between objective and self-perceived basic statistical knowledge, we submitted the Rasch measures from the SKT and average confidence ratings to a Pearson product-moment correlation.
Regression
We used linear, hierarchical multiple regression to explore factors that predicted statistical knowledge among AL and SLA researchers (Gelman & Hill, Reference Gelman and Hill2007). The outcome variable was the logit-scaled measure of statistical knowledge from the Rasch analysis. We entered predictor variables that we reasonably expected to influence statistical literacy: indicators of formal statistical training (number of courses taken), research orientation (quantitative and qualitative), and use of various statistical resources. Accordingly, statistical significance was not a requirement for inclusion in our final model, but predictor variables with very small and imprecise estimates were not retained.
We carried out model diagnostics including multicollinearity tests, graphical examinations of model residuals, and influential case analyses. Collinearity did not appear to be an issue and plots generally indicated satisfactory model fit. While there appeared to be three outliers in the data, removing them did not substantially change the regression results, so we report model estimates with these potential outliers included.
RESULTS
STATISTICAL LITERACY (RQ1)
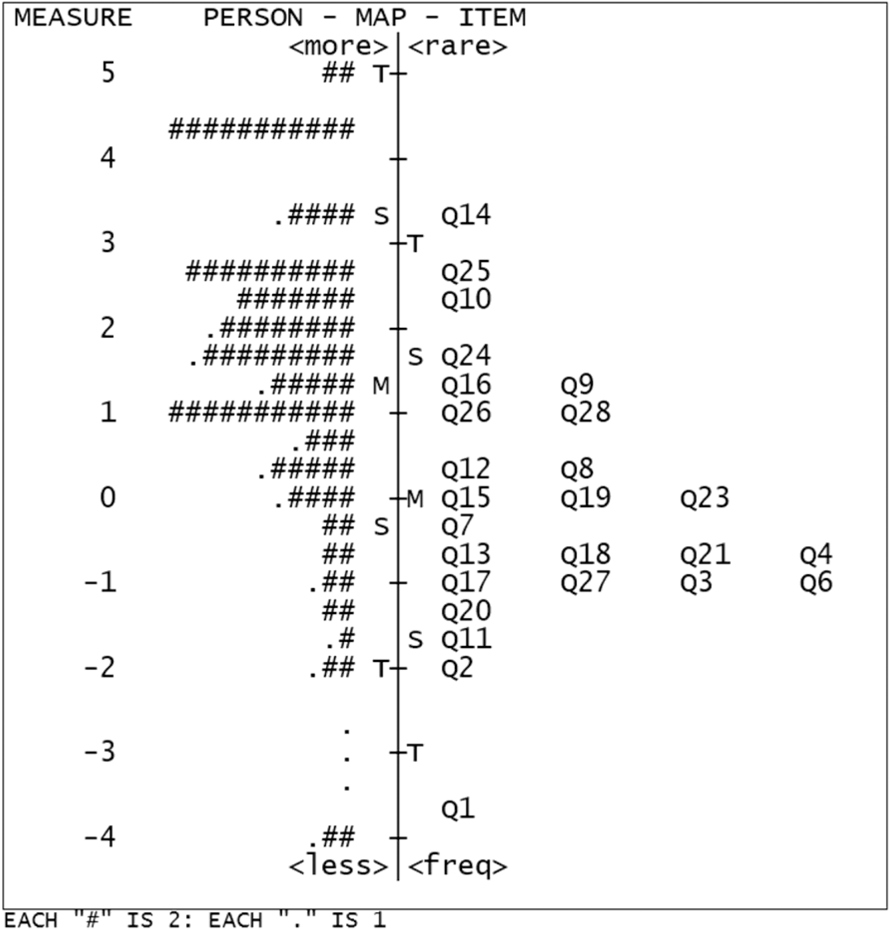
Overall on the SKT, participants scored 69% (M = 17.93, SD = 6.40, 95% CI [17.03, 18.83], range: 0–26) with a median of 77% (20 out of 26). Rasch analysis was used to examine person ability and item difficulty on the same interval scale. Figure 1 presents a Wright map, with person ability (i.e., statistical knowledge) on the left side and item difficulty on the right side. Vertically, more knowledgeable individuals and more difficult items are near the top, and less knowledgeable individuals and easier items are near the bottom; the MEASURE scale on the far left indicates corresponding logit values. Where a person and an item are parallel, the probability of that person answering the question correctly is .5. The mean person ability was 1.42 logits (SD = 2.03) whereas mean item difficulty was .00 logits (SD = 1.51), indicating that on average, participants’ ability exceeded the difficulty of items.
Wright map showing the abilities of respondents and difficulty of items on the same logit scale. M indicates mean measure, S indicates 1 standard deviation, and T indicates 2 standard deviations.

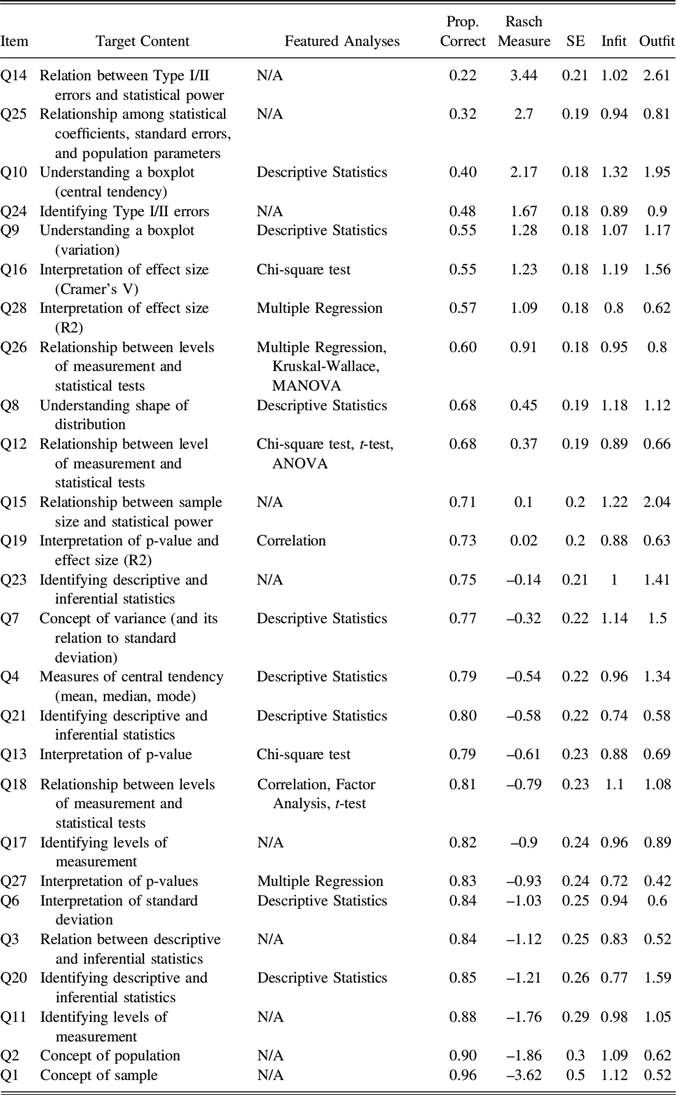
Only four items (i.e., Items 24, 10, 25, and 14; in ascending order) had difficulty measures above the mean person ability (see Appendix A for detailed item statistics). Item 24 required understanding of Type I/II errors. Item 10 required knowing that the bold horizontal line in a boxplot indicates the median, rather than the mean (a common misperception). Item 25 required detailed knowledge about the relationship between statistical coefficients, standard errors, and population parameters. Item 14 was a detailed question about statistical power and the probability of a Type II error.
Items that presented a moderate challenge to the average respondent (i.e., items with difficulty measures near the mean of person ability) included content related to the magnitude of a chi-square test effect size (Item 16), variance and homogeneity of variance (Item 9), the meaning of an effect size (R 2, Item 28), and the shape of a distribution (Item 8). Several items were located near the bottom of the map, indicating lower difficulty. These items dealt with foundational concepts such as sample (Item 1) and population (Item 2), levels of measurement (Item 11, Item 17), descriptive statistics such as means (Item 20) and standard deviations (Item 6, Item 21), and the difference between descriptive and inferential statistics (Item 3). In sum, items that were most difficult for respondents appeared to require detailed knowledge rather than basic familiarity or understanding, and sometimes required the integration of several concepts. Items that presented a reasonable challenge for the average respondent tended to involve the interpretation of inferential statistical results and understanding of distributions, while easier items entailed simple application of basic statistical concepts and descriptive statistics.
RELATIONSHIP BETWEEN ACTUAL AND SELF-PERCEIVED STATISTICAL KNOWLEDGE (RQ2)
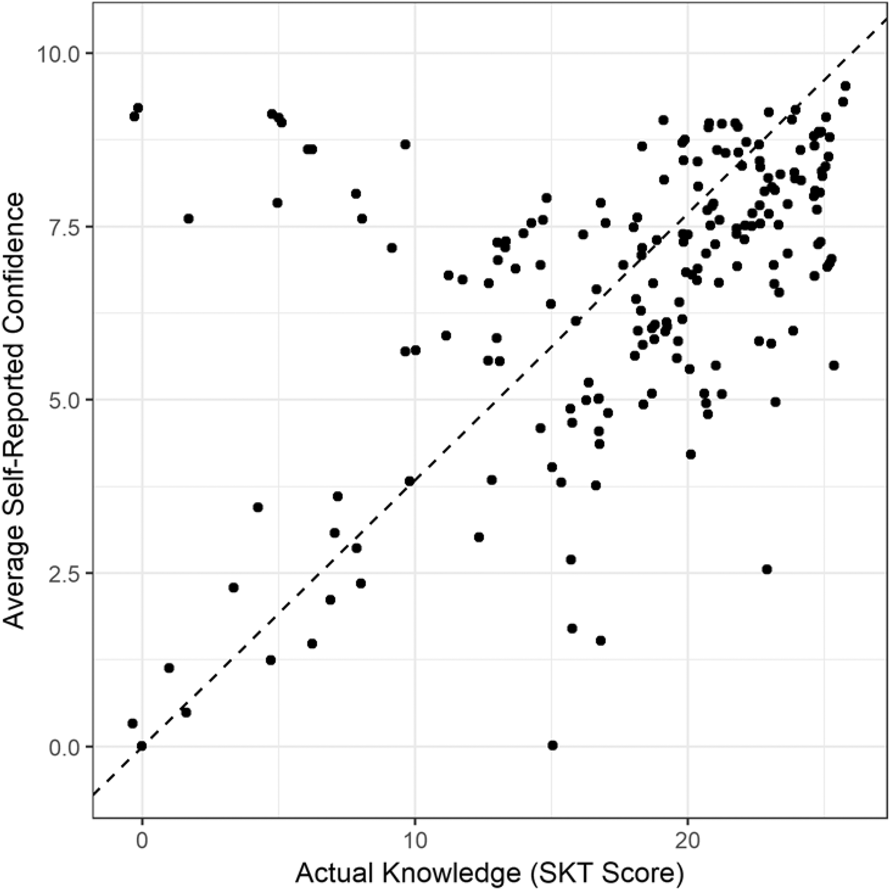
Across participants, the mean overall confidence level in response to SKT questions was 6.66 out of 10 (SD = 2.08, 95% CI [6.37, 6.95], median = 7.22). The correlation between participants’ confidence and SKT score was r = .47 (df = 196, p < .001, 95% CI [.36, .58]) with an R 2 value of .22. Figure 2 plots participants’ confidence levels and SKT scores; the dashed line indicates an idealized one-to-one relationship between actual and self-perceived statistical knowledge. Individuals above the diagonal were overconfident in their statistical knowledge, while individuals below the diagonal were underconfident in their statistical knowledge.
Scatterplot of SKT scores and average self-reported confidence. The dashed diagonal represents an ideal one-to-one relationship between the two measures. Points have been adjusted slightly to avoid overlapping.

PREDICTORS OF STATISTICAL KNOWLEDGE (RQ3)
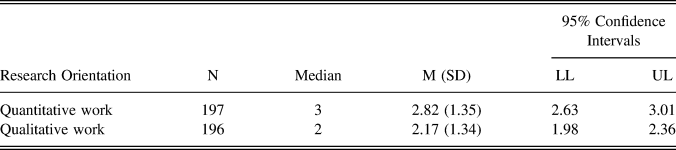
Addressing RQ3, we considered the influence of researcher background, statistical training, and statistical practices on statistical knowledge. Table 2 indicates that participants reported conducting quantitative research (M = 2.82) more than they did qualitative research (M = 2.17).
Research orientation

Note: 0 = not at all, 5 = exclusively.
In terms of courses on quantitative analysis or statistics, participants reported taking an average of about 2.5 (n = 192, M = 2.48, SD = 2.35, 95% CI [2.14, 2.81]). The median score was 2, with a range from 0 to 12. Almost half of participants had taken statistics courses in either Applied Linguistics (26%) or Linguistics (21%) departments. In addition, 11% of participants felt that their statistical training was adequate whereas approximately 55% were not satisfied with their statistical training. Thirty-four percent were somewhat satisfied.
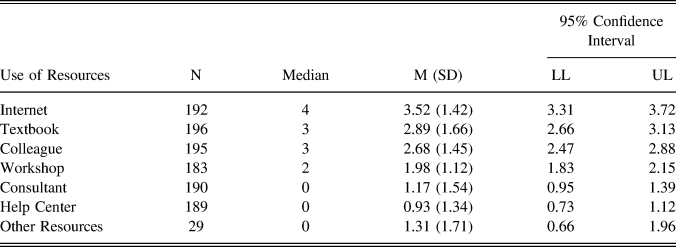
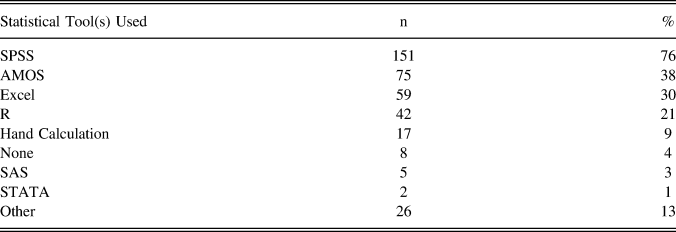
In response to questions regarding the type and frequency of statistical assistance they usually sought, participants reported that their first go-to source was the Internet, followed by statistical textbooks and colleagues (see Table 3). Consulting university help centers, attending workshops, or getting help from a professional statistics consultant were less common practices. In looking at methods of statistical computation, presented in Table 4, SPSS (and its add-on for structural equation modeling, AMOS), Excel, and R were the most frequently used computation methods. Other tools were less popular. Interestingly, 9% of the sample reported calculating statistics by hand.
Frequency of statistics resources use

Note: 0 = not at all, 5 = exclusively.
Statistical tool use

Prior to running regression models, we initially examined group differences in statistical knowledge between European and North American researchers, due to different educational practices such as the requirement of coursework for doctoral degrees. Researchers in North America (mean Rasch score = 1.90) were more knowledgeable than those working in Europe (mean Rasch score = 1.13, t = 2.72, df = 171.26, p = .007). However, these groups also differed somewhat (though not statistically) in the number of statistics courses they had taken (North America: m = 2.73, sd = 2.65; Europe: m = 2.34, sd = 2.15). When geographic location was entered into the initial regression model, its effect was small and imprecise, especially compared to the more substantially relevant variables of statistical training, use of various statistical resources, and research orientation. Consequently, geographic location was not entered into the final regression models.
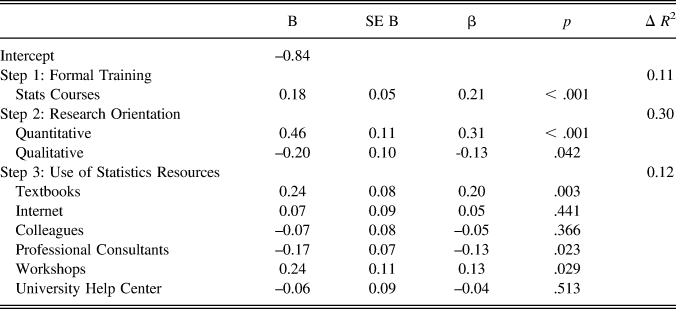
A hierarchical linear multiple regression model was constructed to explore the influence of statistical training, research orientation, and use of statistical resources on participants’ levels of statistical knowledge (Table 5). Overall, the model accounted for more than 50% of variation in statistical knowledge, leaving a little less than half of the variance unexplained. Perhaps not surprisingly, statistics courses and quantitative research orientation were substantial predictors of statistical knowledge, with the latter having the largest positive influence. The use of statistics textbooks and workshops were also predictive of greater statistical knowledge. By contrast, those who conducted more qualitative research and relied more on professional consultants for statistical help tended to have lower levels of statistical knowledge.
Summary of regression model

Note: n = 170, df = 161, Model R 2 = 0.53, Adjusted R 2 = 0.51.
DISCUSSION
Statistical knowledge is critical for both producers and consumers of L2 research; however, the current study found mixed evidence of AL and SLA researchers’ ability to use and interpret basic descriptive and inferential statistical information in a discipline-specific context. The average raw score of roughly 69% (18/26) on the SKT is somewhat difficult to interpret, in large part because there are few discipline-specific measures of statistical knowledge. However, the score is slightly better than the 59% that Gonulal (Reference Gonulal2019) found among North American doctoral students. Even so, a score of 69% or even 77% (the median score) would not typically be considered a satisfactory test grade in most quantitative research methods courses. Additionally, there were individuals with abilities well below the group average. If we also consider the self-selection bias in the data, with quantitatively oriented researchers more likely to complete the SKT, the level of statistical knowledge in the field is even less encouraging. Consequently, individual researchers may have difficulty complying with the calls for increased statistical rigor in the field (e.g., Larson-Hall & Plonsky, Reference Larson-Hall and Plonsky2015; Norris, Reference Norris2015).
However, when considering the content of the individual items, there is some reason for optimism. The average respondent had a strong grasp of basic concepts like sample and descriptive statistics (mean, standard deviation). Indeed previous studies (e.g., Lazaraton et al., Reference Lazaraton, Riggenbach and Ediger1987; Loewen et al., Reference Loewen, Lavolette, Spino, Papi, Schmidtke, Sterling and Wolff2014) have shown that SLA researchers typically self-report knowledge of basic descriptive statistics, and such basic knowledge is helpful for interpreting many quantitative studies published in SLA. For example, Khany and Tazik (2019) estimated that basic statistical knowledge is adequate for understanding roughly 69% of studies reported in applied linguistics journals over the past three decades. However, Khany and Tazik, as well as other researchers (e.g., Loewen & Gass, Reference Loewen and Gass2009) note that the field is seeing an increase in the use of more sophisticated statistical techniques over time, suggesting that researchers need to keep expanding their statistical knowledge to keep up with developments in the field. Indeed, results from the SKT indicate that AL and SLA researchers may struggle with even moderately more complex statistics, suggesting that there is still considerable room for progress. Without the ability to understand quantitative research, some researchers might feel left behind and the division between quantitative and qualitative research might become even greater.
The relationship between actual and self-perceived statistical knowledge arguably reinforces these concerns. While the correlation between the two was not trivial at r = .47, the two measures shared only 22% of variance. In other words, there was limited overlap between what researchers thought they knew about statistics and what they knew, as assessed by the SKT. Additionally, only 11% of respondents considered their statistical training to be adequate. However, in spite of these low numbers, multiple participants with moderate to low levels of knowledge in basic statistics appeared to overestimate what they knew (Figure 2). These results suggest caution when considering the self-reported confidence data in Lazaraton et al. (Reference Lazaraton, Riggenbach and Ediger1987) and Loewen et al. (Reference Loewen, Lavolette, Spino, Papi, Schmidtke, Sterling and Wolff2014) in which 26% and 30% of participants, respectively, reported feeling that their statistical training was adequate.
Other studies of self-assessment have found similar correlations. For example, in a meta-analysis of 60 correlational studies comparing self- and other-assessed language skills, Ross (Reference Ross1998) reported a median effect size of .49 for reading, .47 for listening, .53 for speaking, and .56 for writing. The current study’s correlation of .47 is close to the median effect sizes for the receptive skills reported by Ross, which perhaps stands to reason because researchers in the current study were interpreting statistical data rather than producing statistical analyses. Other studies suggest that a correlation of .47 might even be slightly higher than the norm, given that “across different skill sets, mean correlations between expected and observed performance fluctuate around .29, with correlations in sports being the highest and in the social domain, such as interpersonal skills, the lowest” (Trofimovich, Isaacs, Kennedy, Saito, & Crowther, Reference Trofimovich, Isaacs, Kennedy, Saito and Crowther2015, p. 122). Consequently, we argue that while self-report data of statistical self-efficacy can be informative, more direct and objective measures are also necessary when investigating researchers’ statistical knowledge.
Regarding participants’ overall statistical training and experiences, the current study echoes the findings of Loewen et al. (Reference Loewen, Lavolette, Spino, Papi, Schmidtke, Sterling and Wolff2014), with a similar average (∼3) and median (2) of statistics courses reportedly taken by participants in both studies. Furthermore, roughly 40% of people in both studies had taken statistics courses in language-related departments. It is not necessarily the case that statistics courses in language-related departments are superior to courses in other departments; that is a question for further empirical investigation. However, students studying statistics in language-related programs have the advantage of exploring how statistics are used in their own discipline as well receiving potentially more accessible examples of when to use specific statistics. Furthermore, these findings might provide a reason to be optimistic about the current state of statistical training in the field, especially because Gonulal et al. (Reference Gonulal, Loewen and Plonsky2017) found that graduate students in discipline-specific quantitative methods classes reported increased knowledge of basic descriptive and common inferential statistics.
In terms of predictors of statistical knowledge, the results are in line with previous studies. Similar to Loewen et al. (Reference Loewen, Lavolette, Spino, Papi, Schmidtke, Sterling and Wolff2014) and Gonulal (Reference Gonulal2018), a quantitative research orientation and a higher number of statistics courses were positive predictors of better performance on the SKT, while a qualitative orientation predicted lower scores. Additionally, the use of textbooks and attending workshops predicted higher scores, while using professional consultants was associated with lower scores. These findings suggest that quantitatively oriented researchers are able to build on their existing statistical knowledge through experience and utilizing outside resources. Additionally, the lower SKT scores associated with the use of professional consultants might indicate that researchers who use these services do not develop their own statistical understanding. Finally, it should be remembered that almost half of the variance in the regression model was unexplained, suggesting that additional variables not measured in this study are also important. For example, future studies might want to explore the effects of statistics anxiety or extensive reading of quantitative research studies in developing statistical knowledge.
Although qualitatively oriented researchers performed worse on the SKT, it is perhaps unfair to judge them on their knowledge and ability in their nondominant research paradigm. Presumably, they are experts in their own epistemological and methodological traditions. Additionally, the regression results indicated an association between use of professional statistical consultants and qualitatively oriented researchers, so even though they may not possess the knowledge (as reflected on the lower SKT scores), they may seek help when they need it. However, the results also suggest that using professional consultants does not necessarily result in an increase in researchers’ own statistical knowledge. These findings suggest that further training may be needed, especially due to the growing popularity of mixed methods research (e.g., King & Mackey, Reference King and Mackey2016) and the need for researchers who are adept at multiple types of scientific investigation. The methodological knowledge needed by SLA researchers to consume and/or produce knowledge arguably cuts across paradigms.
Even though the current study provides empirical evidence regarding the current state of statistical knowledge in the field, there are several limitations that should be kept in mind. The first pertains to the participants. The amorphous boundaries of the fields of AL and SLA and the snowball recruitment technique make it difficult to ascertain the representativeness of the sample. Participants presumably had different theoretical and methodological foci, even if they claimed to be associated with AL or SLA. Nevertheless, discipline specific knowledge was not necessary to understand the statistical concepts in the SKT, suggesting that regardless of specific disciplinary focus, the current study provides a snapshot of the statistical knowledge of a group of AL- and SLA-focused researchers.
Another drawback related to the participants is that the majority were quantitatively oriented, which may in part reflect the nature of the field; however, the sample is also presumably biased, with quantitative researchers more likely participating in the study. Participants with weaker statistical knowledge may not have accessed the SKT at all, or they may have discontinued the SKT if they felt they were unable to perform well. Indeed, only 30% of individuals who clicked on the survey link completed it. These observations suggest that the overall level of statistical knowledge in SLA may be even lower than is reflected in this study, and increases the severity of concerns raised in this article.
It is also important to consider the limitations of the SKT. Although a strength of this study is that it employed a direct, objective measure of statistical knowledge, the instrument is not without shortcomings. For example, with only 26 items, the SKT covers only a small portion of basic statistical knowledge. Furthermore, the SKT does not assess knowledge of more advanced and less commonly used statistical methods (e.g., factor analysis, multilevel regression analysis, structural equation modeling, Bayesian statistics) that, although uncommon, are being used more frequently in AL and SLA research (e.g., Khany & Tazik, Reference Khany and Tazik2019; Plonsky & Gonulal, Reference Plonsky and Gonulal2015). Participants’ statistical knowledge could have been better measured by including more items, especially ones related to more advanced statistical techniques and concepts for the higher ability participants who were not challenged by most items. It is certainly the case that not all quantitative researchers employ advanced statistical techniques equally; nevertheless, as consumers of research, individuals may encounter statistical analyses beyond their first-hand experiences. Thus, the knowledge necessary to assess the quality, validity, and reliability of individual studies is important. Without such knowledge, readers must rely on the authors’ interpretations of the data and analyses.
Despite these limitations, this study provides valuable information about AL and SLA researchers’ level of statistical knowledge. The results indicate that there is still considerable need for the development of researchers’ statistical knowledge, which is critical if the field is to advance theoretically and epistemologically. Clearly, current researchers can continue to develop their knowledge effectively through ongoing training, and the current emphasis on methodological rigor may encourage researchers to expand their statistical knowledge. Additionally, it is essential to consider the statistical knowledge that graduate students develop during their apprenticeship as researchers. Although Gonulal (Reference Gonulal2019) provides a snapshot of the current state of statistical training of doctoral students in North America, very little is known about such training; however, if graduate programs do not effectively and rigorously promote quantitative research and statistical knowledge, their graduate students may be at a disadvantage in their advancement to becoming independent researchers. Based on these results, AL and SLA graduate programs may wish to consider the number of quantitative methods courses offered and the coverage of those courses. Other opportunities for developing statistical knowledge, such as pre-/postconference workshops, extracurricular statistical seminars, and quantitative reading groups, are also strongly encouraged.
In sum, this study suggests the field has made some progress in improving researchers’ statistical knowledge, as evidenced by the review of the growing number of methodologically focused research studies and commentaries; however, the SKT results indicate that there is also significant room for improvement in the statistical knowledge that researchers draw on to investigate theoretical claims and make pedagogical recommendations.
SUPPLEMENTARY MATERIAL
To view supplementary material for this article, please visit https://doi.org/10.1017/S0272263119000548
APPENDIX A
SKT item content and item statistics