I. Introduction
The dramatic globalization of the world's wine markets over the past two or three decades has generated countless new wine consumers. This has added to both the opportunities and the competitive challenges for producers seeking to differentiate their product to attract the attention of consumers. Consumers, in turn, are always looking for new types of wines and more so as wines within at least the lower-priced product ranges become more homogeneous, with the multinationalization of both wineries and wine retailers.
One strategy for producers has been to display grape varietal names on wine bottle labels. Its success, especially for lower-priced New World wines, has led to demands in the European Union (EU) for freeing up labeling laws so as to allow such labeling there also. Meanwhile, producers in the New World are increasingly realizing the marketing value of going beyond country of origin to regional labeling as another form of product differentiation—something that has long been practiced by Europe's traditional producers.
In addition to striving to differentiate their product, producers are also well aware of the impact that climate changes (higher temperatures, more extreme weather events) are having on their winegrapes. Adaptation strategies include switching to warmer-climate or more-resilient grape varieties and relocating to a higher latitude or altitude to retain the current mix of grape varieties. Especially in the New World, where regions are still trying to identify their varietal comparative advantages and where regulations do not restrict varietal choice, winegrowers are continually on the lookout for attractive alternative varieties that do well in climates similar to what they expect theirs to become in the decades ahead. Moreover, the biotechnology revolution is providing breeders with new opportunities, which is increasing the interest in exploring traits of little-known varieties.
Some people also are concerned that the diversity of winegrapes is narrowing to a few “international” varieties. Johnson and Robinson (Reference Johnson and Robinson2013, p. 8) note that vignerons are at last beginning to respond by reverting to neglected local varieties in the Old World and by exploring alternatives to the main “international” varieties in the New World. But how severe is the current concentration compared with earlier times, and how different is the concentration in the Old World compared with the New World?
These biodiversity concerns, together with marketing and climate adaptation needs, are generating a rapidly growing demand for information on which winegrape varieties are grown in the world's various wine regions. Since 1971, The World Atlas of Wine has provided a great deal of information about where winegrapes are grown (the seventh edition is Johnson and Robinson [Reference Johnson and Robinson2013]). That and other wine atlases have been complemented by a new book by Robinson, Harding, and Vouillamoz (Reference Robinson, Harding and Vouillamoz2012), which provides a detailed guide to 1,368 of the world's commercially grown “prime” varieties and their various synonyms, based on the latest DNA research. However, neither of those seminal books, nor any other wine atlas or wine encyclopedia, provides comprehensive global data on the bearing areas of winegrapes by region and variety.Footnote 1
This paper draws on a newly compiled global database (Anderson and Aryal, Reference Anderson and Aryal2013) to estimate several indicators that capture changes over the first decade of the twenty-first century in the varietal mix of the world's wine regions. It builds on an earlier study of more limited data for 2000 by Anderson (Reference Anderson2010) in several ways: it has data for 2010 as well as 2000; it includes more than 30 additional countries so that the sample now covers as much as 99 percent of global wine production; it is far more detailed in terms of having more than 600 regions and 2,000 varieties (of which almost 1,300 are “primes” and the rest are their synonyms), compared with only 166 regions and 258 varieties previously; and it has removed spurious differences in varietal mixes resulting from the use of different varietal names for what have recently been shown to be DNA-identical varieties (thanks to the painstaking scientific work that led to the book by Robinson et al., Reference Robinson, Harding and Vouillamoz2012).
The paper is structured as follows. Section II describes the database. Section III defines two key indexes that have been calculated to help summarize the data. Those data are then used to provide an empirical picture of the changing varietal distinctiveness of the world's wine regions. This is done in Section IV by answering a sample of questions which, in the process, provide a sense of the breadth of the database. (Space limitations prevent us from highlighting the depth of the database in terms of its within-country regional detail.) The final section discusses possible extensions and other uses of the database.
II. The New Database
Data on the bearing area of winegrapes are available by variety and region for most key wine-producing countries. In the case of the EU countries, area data are available from one source (Eurostat, 2013), while for other countries they are typically available online from a national wine industry body or the national statistical agency. The United States and Canada, where data are collected at the state/provincial level and only for those with significant wine production, are key exceptions.
The years chosen correspond to the most recent decadal agricultural census periods of the European Union, which were 1999 or 2000 and 2009 or 2010. For the non-EU countries, data have been sought for the earlier year in the Northern Hemisphere and the latter year in the Southern Hemisphere. Inevitably, not all other countries or regions had data for exactly those vintages, but in most cases the data refer to vintages that were only six months apart.
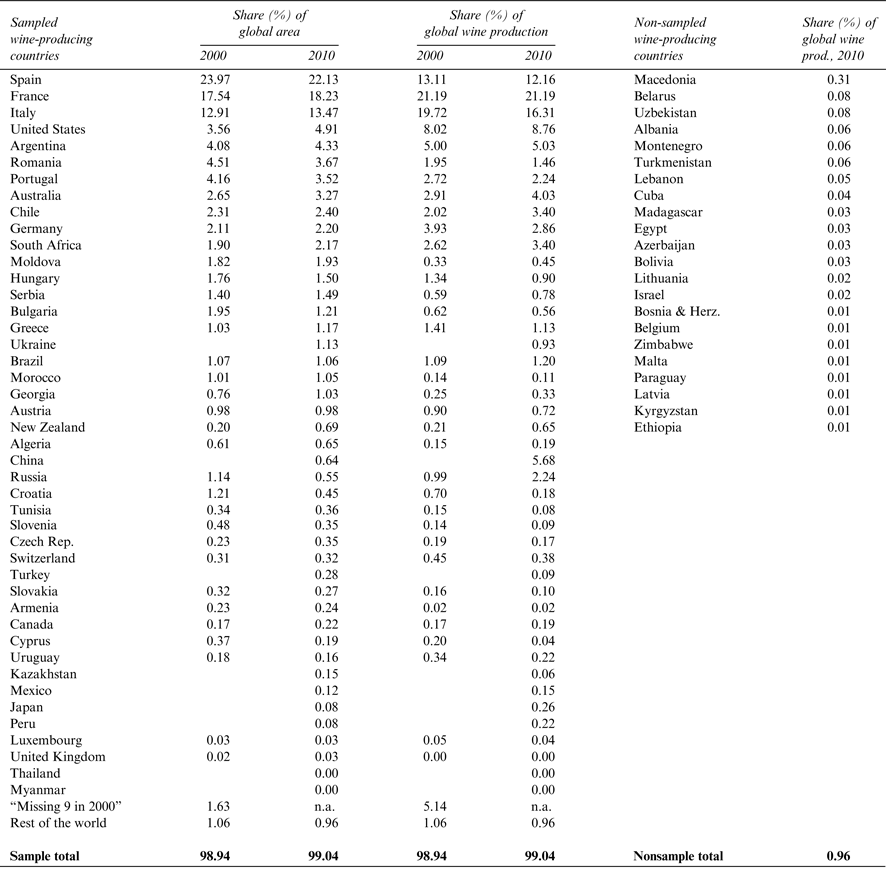
The raw data have been compiled by Anderson and Aryal (Reference Anderson and Aryal2013), and various indicators from that database have been assembled in comprehensive tables and figures by Anderson (Reference Anderson2013). Appendix Table 1 lists the countries included and their relative importance in the global bearing area of winegrapes and in wine production, and it also shows the other countries reported to be producing wine (although collectively the latter group accounts for just 1 percent of global wine output).
Of the 44 countries included in Appendix Table 1, reliable area data for 2000 were unavailable for nine of them (China, Japan, Kazakhstan, Mexico, Myanmar, Peru, Thailand, Turkey, and Ukraine). The combined share of global wine production of those nine countries in 2000 was only 1.6% (compared with 5.1% in 2010), but their varietal contributions are included as a group (called “Missing 9 in 2000”) by assuming each of them had (i) the same varietal distribution in 2000 as in 2010 and (ii) a national area that was the same fraction of its 2010 area then as was its national wine production volume. As well, the global bearing area of the world's 50 most important varieties in 1990 has been estimated using data in Fegan (Reference Fegan2003).
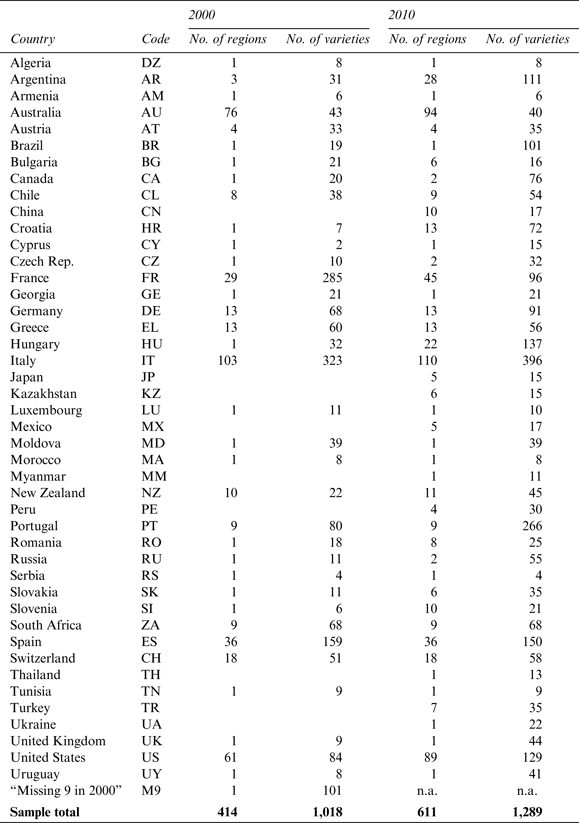
The number of winegrape regions in each country for which bearing area data are available varies greatly across the sample of 44 countries (Appendix Table 2). And the number is not the same for each country in the two chosen years, which means that some regional detail is necessarily lost through aggregation when we seek to compare varietal mixes of each region in the two sample years. Nonetheless, even for that comparative exercise there are as many as 410 matching regions globally.
Thus the database on which this volume draws involves two years (2000 and 2010, plus some 1990 data), more than 600 regions (in 44 countries), and nearly 1,300 varieties. Such a large three-dimensional database potentially has 1.5 billion numbers in its cells (many of which are zeros). It can be sliced in three ways: across regions, years, or varieties. To assist in digesting such large spreadsheets, it is helpful to summarize the data by calculating a pair of indexes.
III. Two Indexes
In addition to regional and varietal shares, two indexes that are used in the next section are defined in turn in this section: the varietal intensity index, and the varietal similarity index.
A. Varietal Intensity Index
A varietal intensity index is defined as a variety's share of a region's winegrape area divided by that variety's share of the global winegrape bearing area. The varietal intensity index is thus a complement to share information in that it indicates the importance of a variety in a region not relative to other varieties in that region but, rather, relative to that variety in the world.
Specifically, define f im as the proportion of the bearing area of grape variety m in the total winegrape-bearing area in region or country i such that the proportions fall between 0 and 1 and sum to 1 (i.e., there is a total of M different grape varieties across the world, and 0 ⩽ f im ⩽1 and Σmfim=1). For the world as a whole, f m is the bearing area of grape variety m as a proportion of the total global winegrape area, and 0 ⩽ f m ⩽1 and Σmfm=1. Then the varietal intensity index, Vim for variety m in region i, is:
 $$V_{im} = f_{im} /f_m $$
B. Regional Similarity Index
An index of varietal similarity has been defined by Anderson (Reference Anderson2010) to measure the extent to which the varietal mix of one region or country matches that of another region or country or the world. It can also be used to compare the varietal mix of a region or country over time. In defining the index, Anderson (Reference Anderson2010) borrows and adapts an approach introduced by Griliches (Reference Griliches1979) and Jaffe (Reference Jaffe1986). That approach has been used subsequently by Jaffe (Reference Jaffe1989), and by others, including Alston, Norton, and Pardey (Reference Alston, Norton and Pardey1998) and Alston et al. (Reference Alston, Andersen, James and Pardey2010, ch. 4), to measure interfirm or interindustry or interregional technology spillover potential.
The mix of grape varieties is a form of revealed preference or judgment by vignerons about what is best to grow in their region. That judgment is affected by not only terroir but also past and present economic considerations, including current expectations about future price trends, plus the sunk cost that would be involved in grafting new varieties onto existing rootstocks or grubbing out and replacing existing varieties.
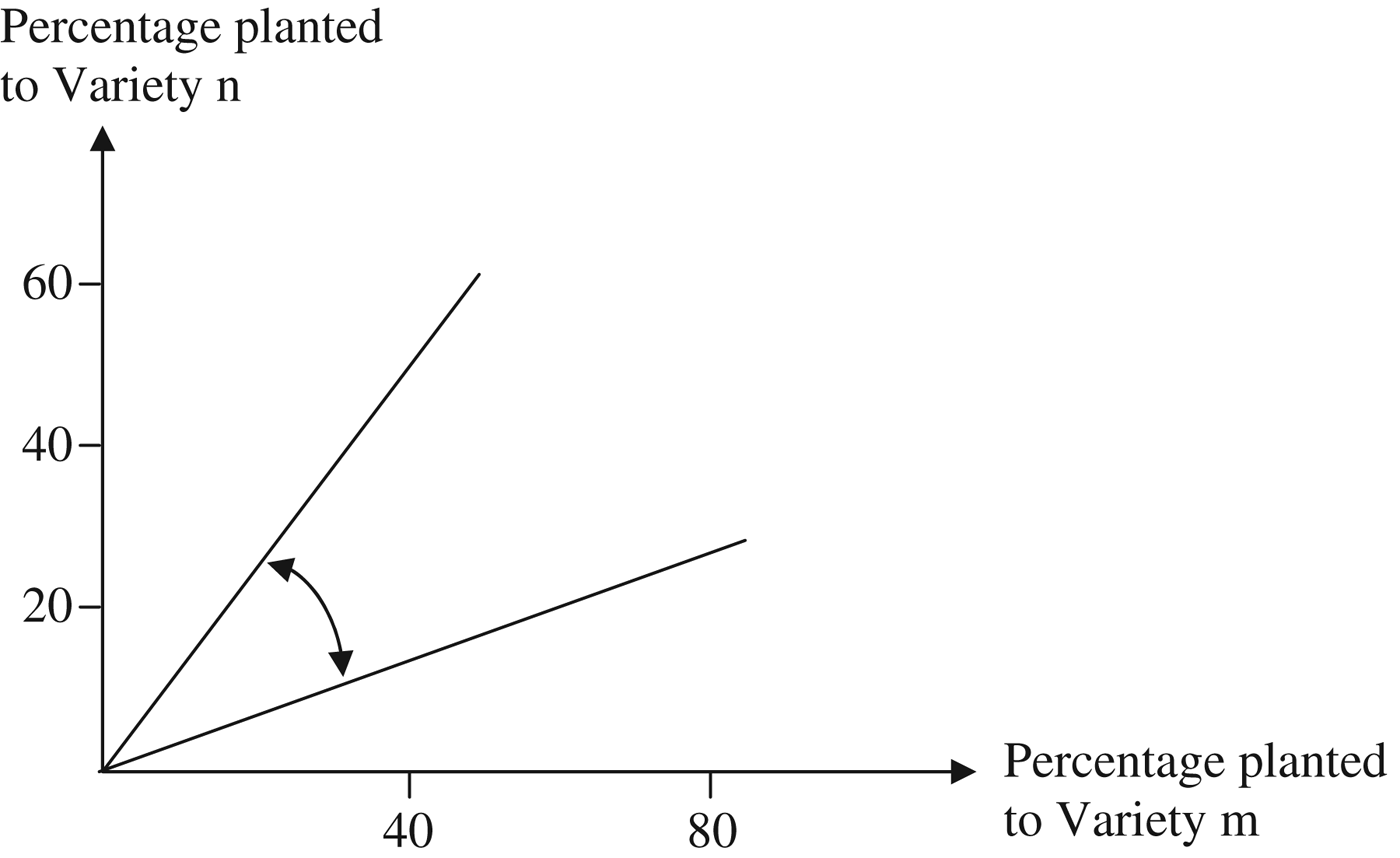
The vector of grape varietal shares defined above, f i=(f i1, … , f iM), locates region i in M-dimensional space. Noting that proximity is defined by the direction in which the f-vectors are pointing, but not necessarily their length, Jaffe (Reference Jaffe1989) proposes a measure called the “angular separation of the vectors,” which is equal to the cosine of the angle between them. If there were just two varieties, m and n, and region i had 80% of its total vine area planted to variety m whereas only 40% of region j was planted to variety m, then their index of regional similarity is the cosine of the arrowed angle between the two vectors (Figure 1). When there are M varieties, this measure is defined as:
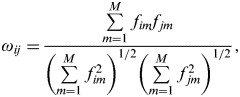 $$\omega _{ij} = \displaystyle{{\sum\limits_{m = 1}^M {\,f_{im} f_{\,jm}}} \over {\left( {\sum\limits_{m = 1}^M {\,f_{im}^2}} \right)^{1/2} \left( {\sum\limits_{m = 1}^M {\,f_{\,jm}^2}} \right)^{1/2}}}, {\rm} $$
where again f im is the area of plantings of grape variety m as a proportion of the total grape plantings in region i such that these proportions fall between 0 and 1 and sum to 1 (i.e., there is a total of M different grape varieties across the world, and 0 ⩽ f im ⩽1 and Σmfim=1). This makes it possible to indicate the degree of varietal mix “similarity” of any pair of regions. The index also can be generated for each region relative to the average of the world's N regions, which we call ω. In short, ω ij measures the degree of overlap between f i and f j. The numerator of Equation (2) will be large when i's and j's varietal mixes are very similar. The denominator normalizes the measure to unity (that is, 1) when f i and f j are identical. Hence, ω ij will be 0 for pairs of regions with no overlap in their grape varietal mix, and 1 for pairs of regions with an identical varietal mix. For cases in between those two extremes, 0 < ω ij <1. It is conceptually similar to a correlation coefficient. Like a correlation coefficient, it is completely symmetrical in that ω ij=ω ji and ω ii=1. Thus the results can be summarized in a symmetrical matrix with values of 1 on the diagonal, plus a vector that reports the index for each region relative to the global varietal mix.
Angular Separation Between Two Regions, Each Growing Two Grape Varieties

IV. The Changing Varietal Distinctiveness of the World's Wine Regions
There are vast differences between countries in their winegrape-bearing areas. The three biggest, France, Italy, and Spain, accounted for 54% of the world's winegrape vineyard area in both 2000 and 2010. The next biggest is the United States, but its share is less than 5%. The same four countries dominate global wine production volume and valueFootnote 2 (accounting for 60% in aggregate). However, the 2010 rankings among them in wine production differ considerably from that in winegrape area: France and Italy are ahead of Spain in wine production volume, and France and the United States are well ahead of Italy and Spain in terms of the value of wine production, followed by Germany and Australia. One reason for these differing rankings is that the huge La Mancha region of Spain has bush vines sparsely planted to the drought-resistant but low-quality Airén variety, much of whose grapes are often used to produce brandy rather than wine.
The global area of winegrapes has declined by almost 6% over the first decade of the twenty-first century. This is despite increases of around 30% in the United States and Georgia, 40% in the Czech Republic, and 220% in New Zealand. The biggest decreases were in Spain (13%), Portugal (20%), and several countries in southeastern Europe. That overall decline continues an earlier trend: the global area fell 8% in the final decade of the twentieth century.
A glimpse of how the varietal distinctiveness of the world's wine regions has changed over the decade to 2010 can be seen by interrogating the database to answer the following questions:
• Has varietal diversity of the world's vineyard increased or decreased over that decade? Did the change in the New World differ from that in the Old World?
• How are those changes reflected in the global area rankings of varieties?
• Are red winegrapes becoming more prominent? In just some or many countries?
• How has the varietal intensity of each country changed since 2000?
• How similar is each country's varietal mix to that of other countries and to the world aggregate mix? How much has each country's varietal mix changed since 2000?
A. Changing Varietal Diversity of the World's Vineyard
The extent of varietal concentration in the world's vineyard increased nontrivially between 2000 and 2010. This increase in concentration/decrease in diversity can be seen in Figure 2a, where the 2010 cumulative curve is well above that for 2000. Indeed the six-percentage-point difference for most of the first 40 varieties continues right through to the 1290th variety. Moreover, that decline in diversity is almost equally as strong in the Old World as in the New World, even though the extent of diversity is greater in the Old World (Figure 2b).
Cumulative Varietal Shares of Global Winegrape Area, 2000 and 2010 (%)
Another way to explore the diversity issue is to examine what share of the global area is devoted to varieties by their country of origin. Between 2000 and 2010, the global winegrape share devoted to varieties of French origin rose from 26% to 36%. Particularly striking is the high and increasing dominance of French varieties in the New World's vineyards: that share averaged 67% in 2010, up from 53% in 2000. It compares with an increase from 20% to 27% for the Old World's vineyards. The next most important country of origin is Spain, accounting for 26% of the world's area in 2010, down from 28% in 2000, which is just a little above Spain's own share of the global bearing area of 22–24%. Third is Italy, whose country of origin share is almost the same as the country's share of global area, 13%.Footnote 3 No other country can lay claim to being the origin of more than 3% of the world's winegrape varieties in terms of bearing area.
Varietal concentration is also reflected in the share of the total area of winegrapes for a country or the world that is held by the top variety, or the cumulative shares of the top few varieties. Globally, the top 35 varieties accounted for 59% of the world's winegrape bearing area in 2000, but by 2010 that share was 66%. At the national level, in 2010 as many as 12 of the 44 countries had more than one-third of their total area under just their top variety. Perhaps even more striking is that only 6 of the 44 countries have less than one-third of their total winegrape area under their top three varieties. Those numbers of countries had changed from 7 and 7 in 2000, respectively, again indicating a rapid increase in varietal concentration.
B. Changes in Global Area Rankings of Varieties
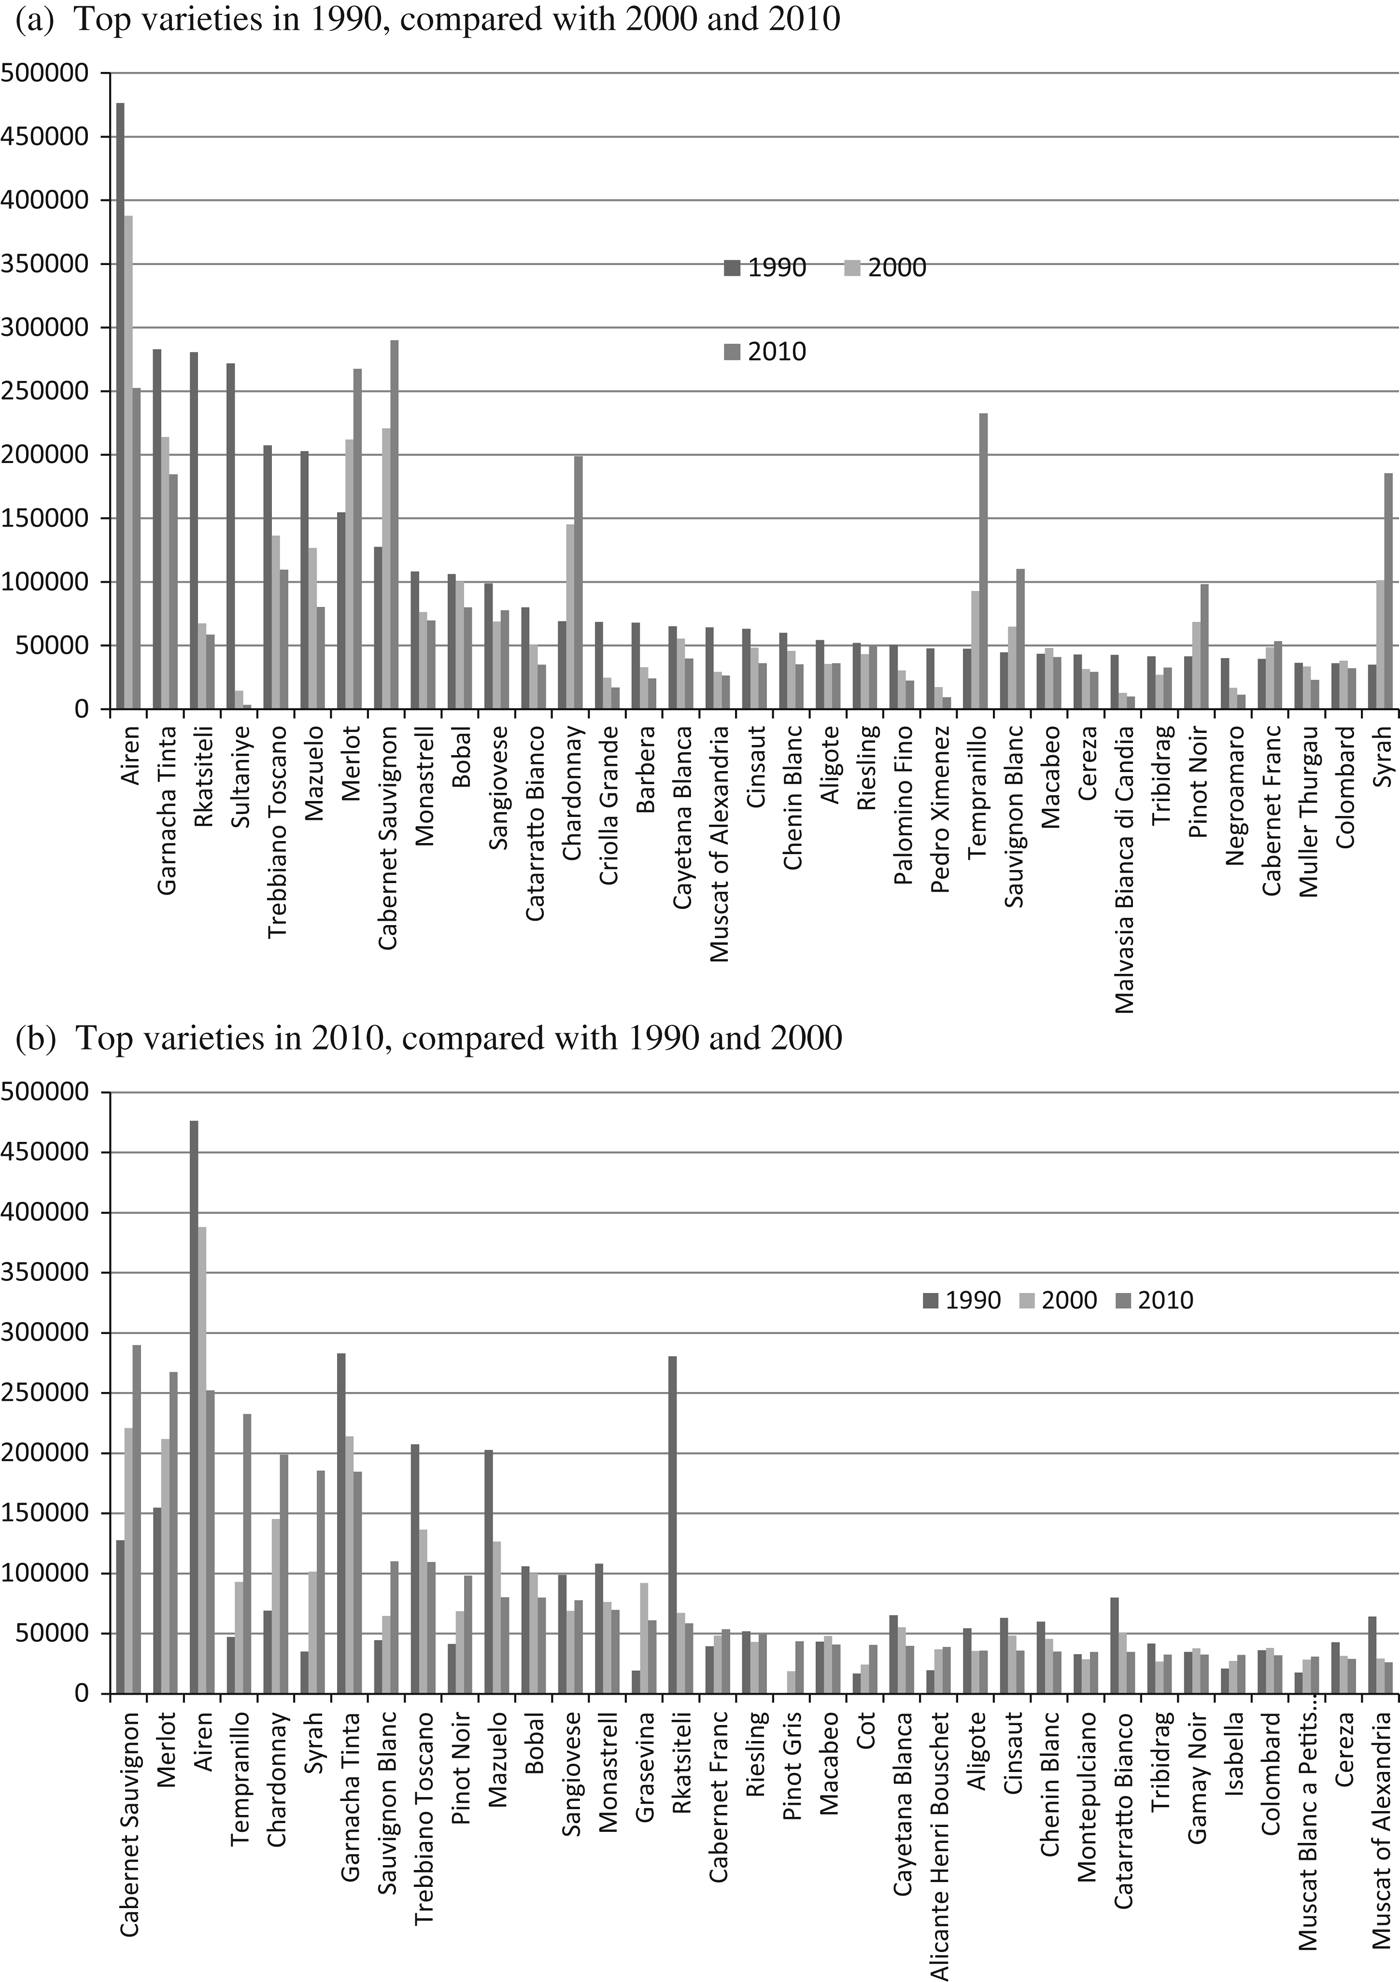
The changes in varietal concentration in the world's vineyard are reflected in the marked changes in the global rankings of varieties over the period between 1990 and 2010. Cabernet Sauvignon and Merlot have more than doubled their shares to take them from 8th and 7th to 1st and 2nd places, and Tempranillo and Chardonnay have more than trebled their shares to take 4th and 5th places, while syrah has jumped from 35th to 6th. Sauvignon Blanc and Pinot Noir are the other two to move into the top ten. These have all been at the expense of Airén, which has fallen from 1st to 3rd, Garnacha from 2nd to 7th, Trebbiano Toscana from 5th to 9th, and Sultaniye (main synonym: Thompson seedless) from 3rd to more than 35th. As a consequence, the world's top 35 varieties as ranked in 1990 shows a quite different mix and rank ordering to the comparable chart for 2010 (Figure 3).
World's Top 35 Varieties in 1990, 2000 and 2010 (ha)
C. Changes in Shares of Red and White Varieties
Among other things, these changes in varietal diversity have been accompanied by a rise in the overall share of red varieties in the global winegrape area: from 49% to 56% in the decade to 2010. That share varies hugely across countries, though, from 96% in China and even higher in North Africa to just 12% in Georgia and 8% in Luxembourg (Figure 4a). And the red/white mix has changed far more in some countries than in others, whether looked at in terms of red's share of the national total or in national hectares. Of the countries that have increased the share of red varieties in their national mix, the majority are in the Old World (Figure 4b). In hectares, the largest rises in winegrape area are in Spain, the United States, and Italy while the largest falls are in Romania, Bulgaria, and France. Within the red and white winegrape categories, the cumulative shares indicate that the varietal concentration increased almost equally for red and white winegrapes over the 2000 to 2010 period.
Changing Importance of Red Varieties in National Winegrape Area, 2000 to 2010 (%)
D. Changes in Varietal Intensity Indexes
The varietal intensity index, defined above as a variety's share of a country's total winegrape area divided by that variety's share of the global winegrape area, complements national share information in that it indicates the importance of a variety in a country not relative to other varieties in that country but, rather, relative to that variety in the world. It also complements information on a country's share of the global area for a variety.
As an example, Cot (main synonym: Malbec) was the third-largest variety in terms of area in Argentina in 2000 but the largest variety in 2010 (15.4% of the national winegrape area), when it accounted for 76% of the world's Cot plantings. Since that variety represented only 0.88% of the global area of all varieties in that year, Argentina's Varietal Intensity Index (VII) for that variety was (0.154/0.088=) 17.5 in 2010, which compares with 16.2 in 2000. For Argentina, Cot is not even in the top ten varieties ranked according to the VII, though, because there are numerous varieties that are unique to Argentina and that therefore have an even higher VII. In fact when a variety is grown only in that country, its VII is necessarily the inverse of the proportion of the global winegrape area accounted for by that country—and so is identical for each unique variety in that country and year (so 1/0.043=22.9 for Argentina in 2010).
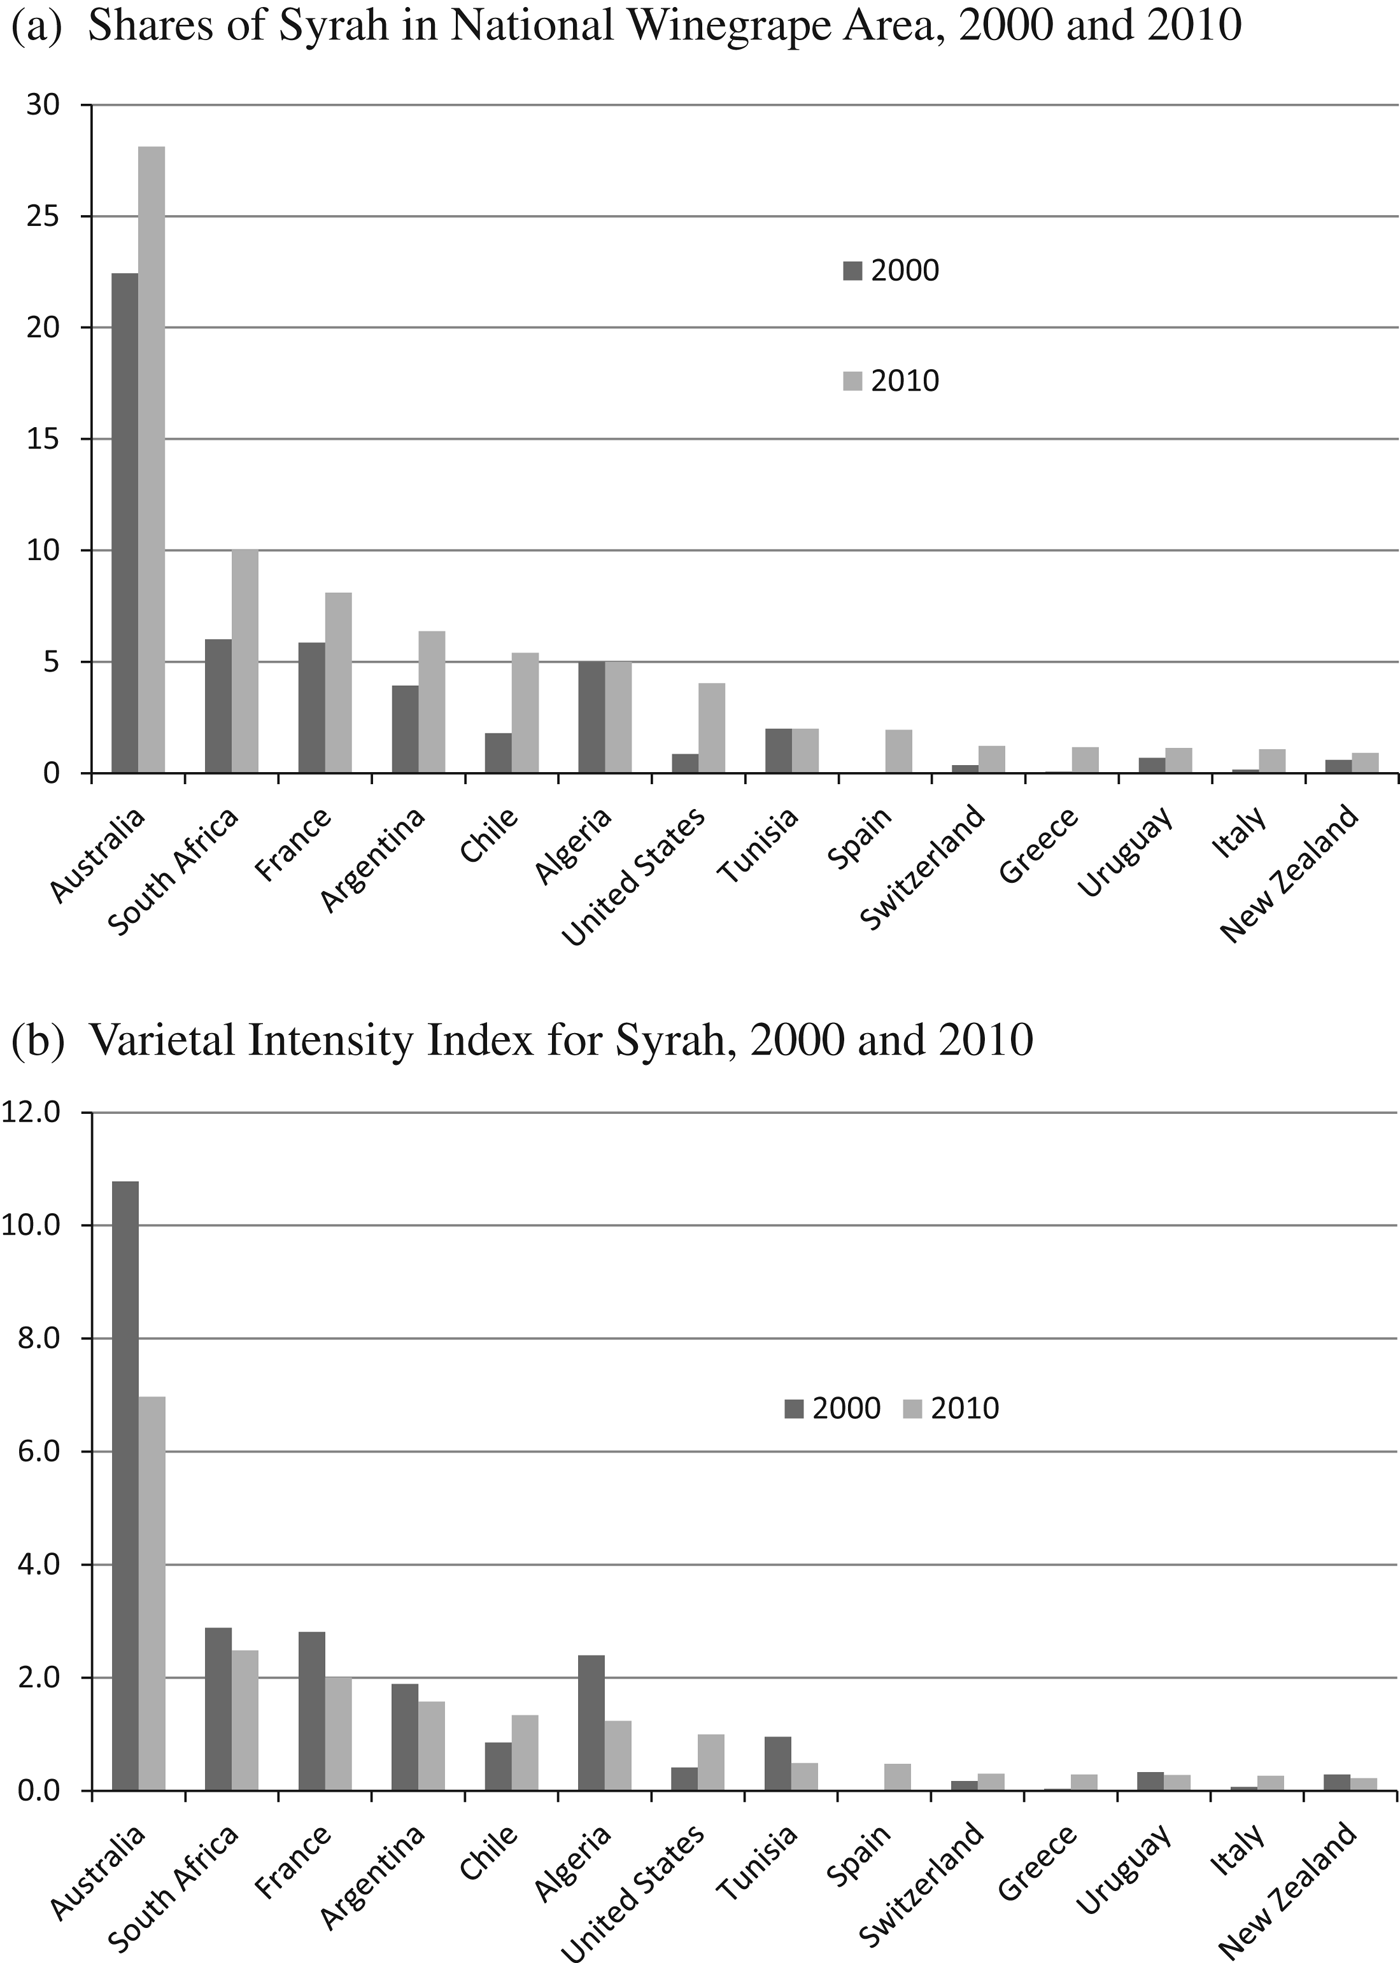
Another example that helps to illustrate the difference between the national share of a variety and its VII is Syrah (main synonym: Shiraz). This is the most important variety in Australia, and its share of Australia's total winegrape area rose from 22% to 28% in the decade to 2010. However, over that period Syrah became more important in numerous other countries as well (Figure 5a). Its share of the global vineyard area thus rose from 2.1% in 2000 to 4.0% in 2010. As a result, Australia's share of Syrah's global area fell from 29% to 23% and so Syrah's VII for Australia fell from 11 to 7 over that decade (while the VII for countries such as the Chile and the United States rose—see Figure 5b).
Changing Importance of Syrah in Selected Countries, 2000 and 2010
A fall in the VII for Australia is not unique to Syrah. Indeed, of all 15 varieties for which there were more than 1,000 hectares in production in Australia in 2010, there are only four whose VII rose after 2000. Only a small fraction of that can be explained by an increase in size of Australia's share of the global area, since its share rose only marginally over that decade (from 2.7% to 3.3%). The much more important reason for the decline in VII for most of the key varieties in Australia is that the country's mix of varieties is becoming more similar to the global average (see next subsection).
E. Changes in Varietal Similarity Indexes
An index of similarity of varietal mix between countries or over time, as defined in Section III.B, provides an indication of how closely the shares of different varieties in the winegrape area in one location match the shares in another location or in the world (or in that same location in another time period). The closer (further away) that match, the closer the index is to 1 (0). That is, the index will be 0 for pairs of countries with no overlap in their winegrape varietal mix, and 1 for pairs of regions with an identical varietal mix. For the in-between cases, the index is conceptually similar to a correlation coefficient and, like a correlation coefficient, it is symmetrical.
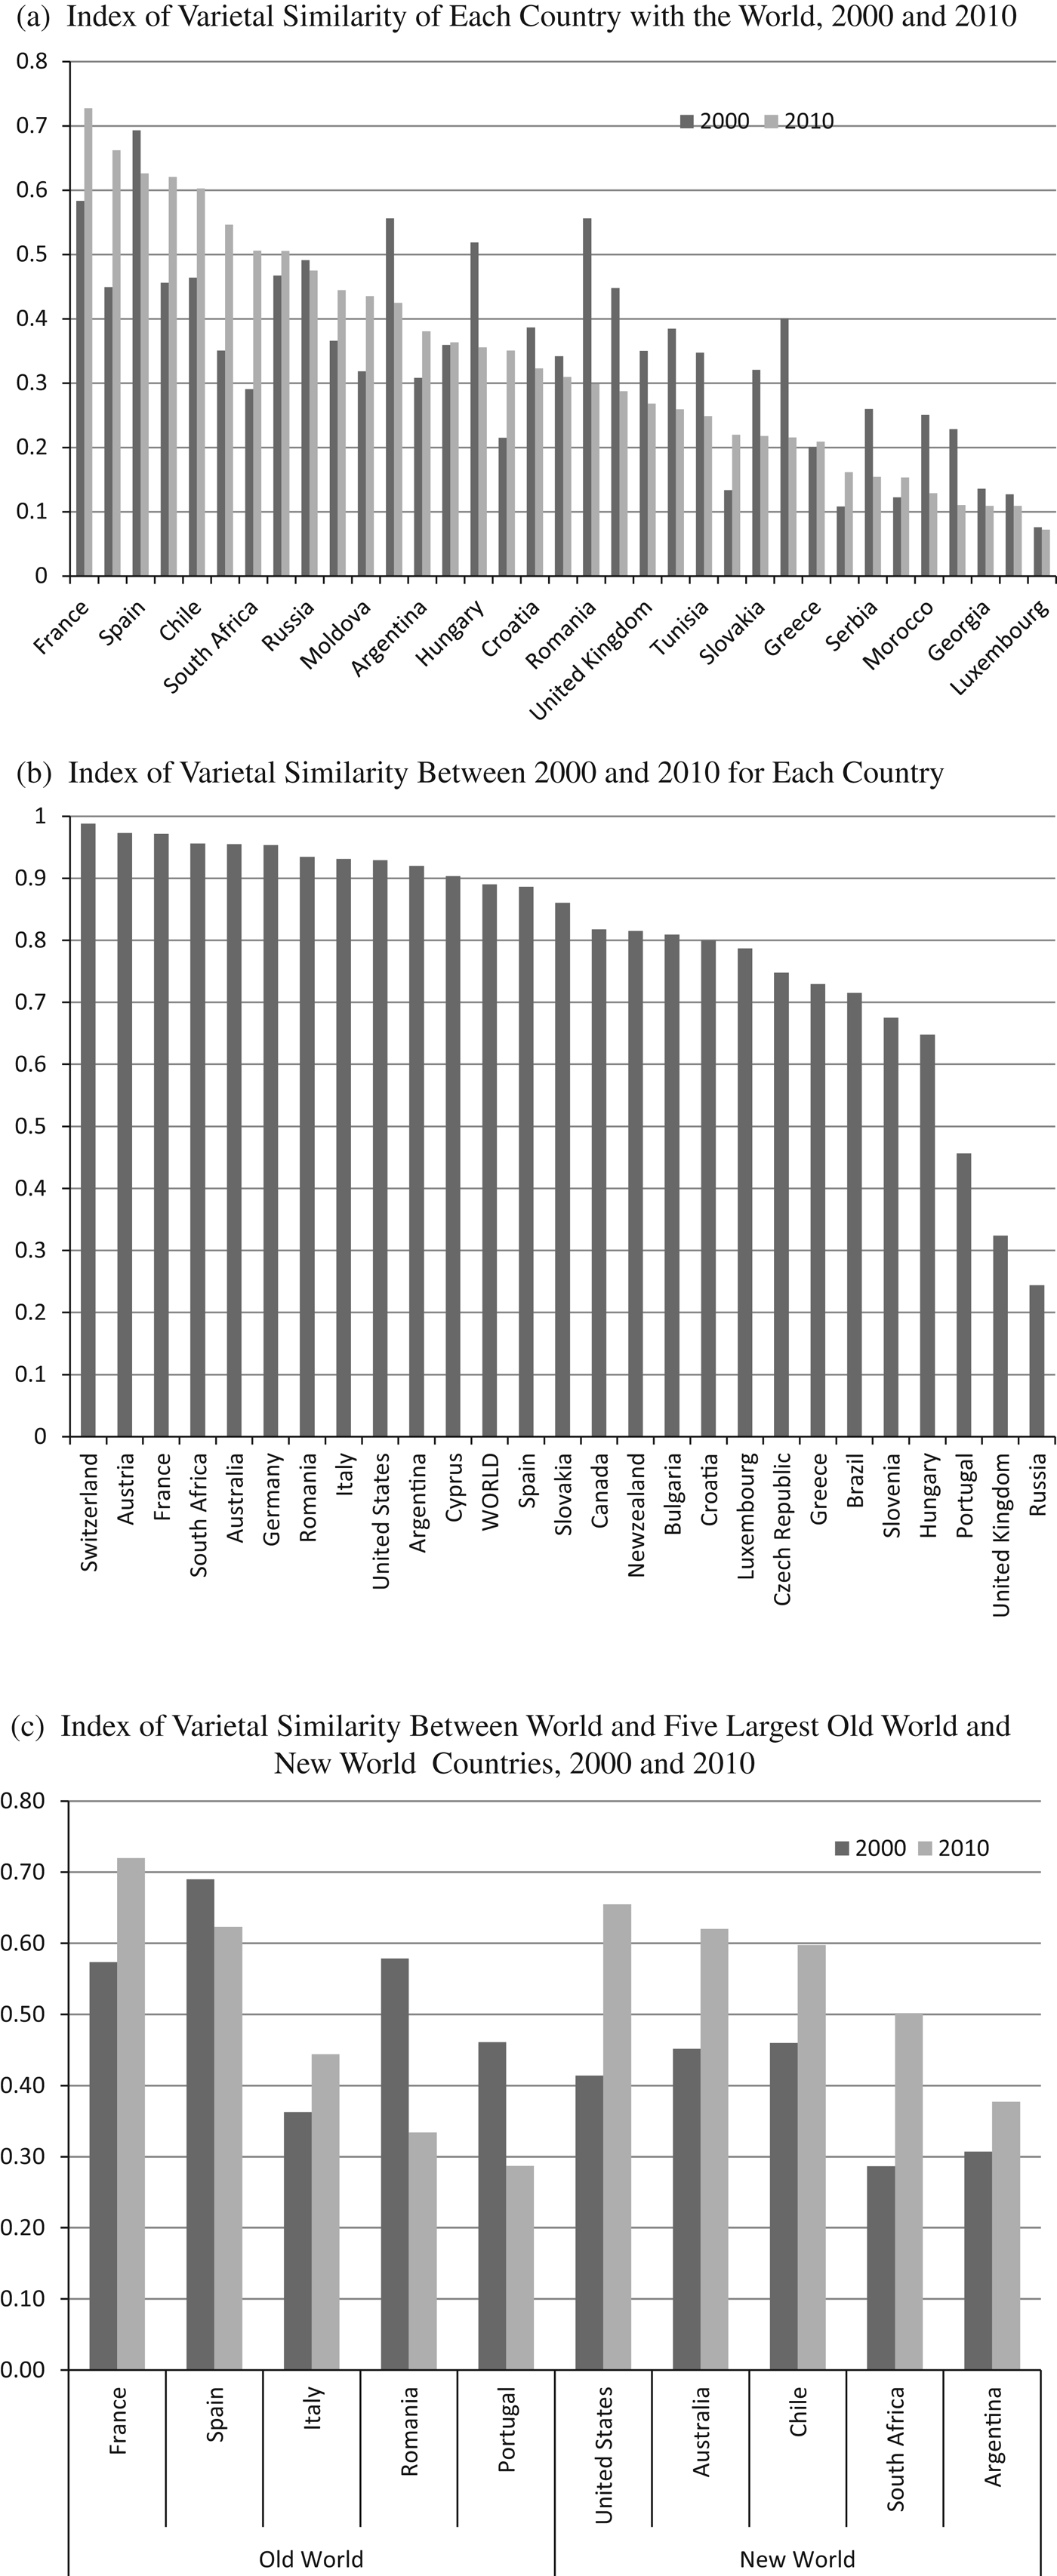
Given the heterogeneity across regions and even countries in their varietal mix, several types of questions can be answered with the help of the varietal similarity index (VSI). The first is: how similar (or different) is each country's mix of varieties from the global average? For Australia, for example, its VSI was 0.45 in 2000, but it rose to 0.62 by 2010. That is, as suggested at the end of the previous section, Australia's varietal mix moved a long way toward the global average varietal mix in the first decade of the twenty-first century. Indeed, France and (marginally) the United States are the only two countries with a closer match to the world average in 2010, whereas nine other countries had a higher VSI than Australia in 2000 (Figure 6a). Bear in mind, though, that there is still a wide range of VSIs across the regions within Australia vis-à-vis the world, ranging from 0.25 to 0.61 in 2000 and from 0.30 to 0.70 in 2010.
Changing Indexes of Varietal Similarity, by Country, 2000 and 2010
A second use of the VSI is in examining, for any one region or country, how close its varietal mix in 2010 is to that in 2000. Figure 6b shows that while some countries have an across-time VSI close to 1, for others it is much lower, which reflects considerable changes in the varietal mix of their bearing areas over that decade. The RSIs between the two years range from highs of 0.99 (Switzerland) and 0.97 (France and Austria) to lows of 0.32 (United Kingdom) and 0.25 (Russia). The fact that the VSI with the world rose between 2000 and 2010 for each of the five biggest New World countries and for two of the three biggest Old World countries (Figure 6c) is a further reflection of the recent increase in varietal concentration in the world's vineyard over that decade.
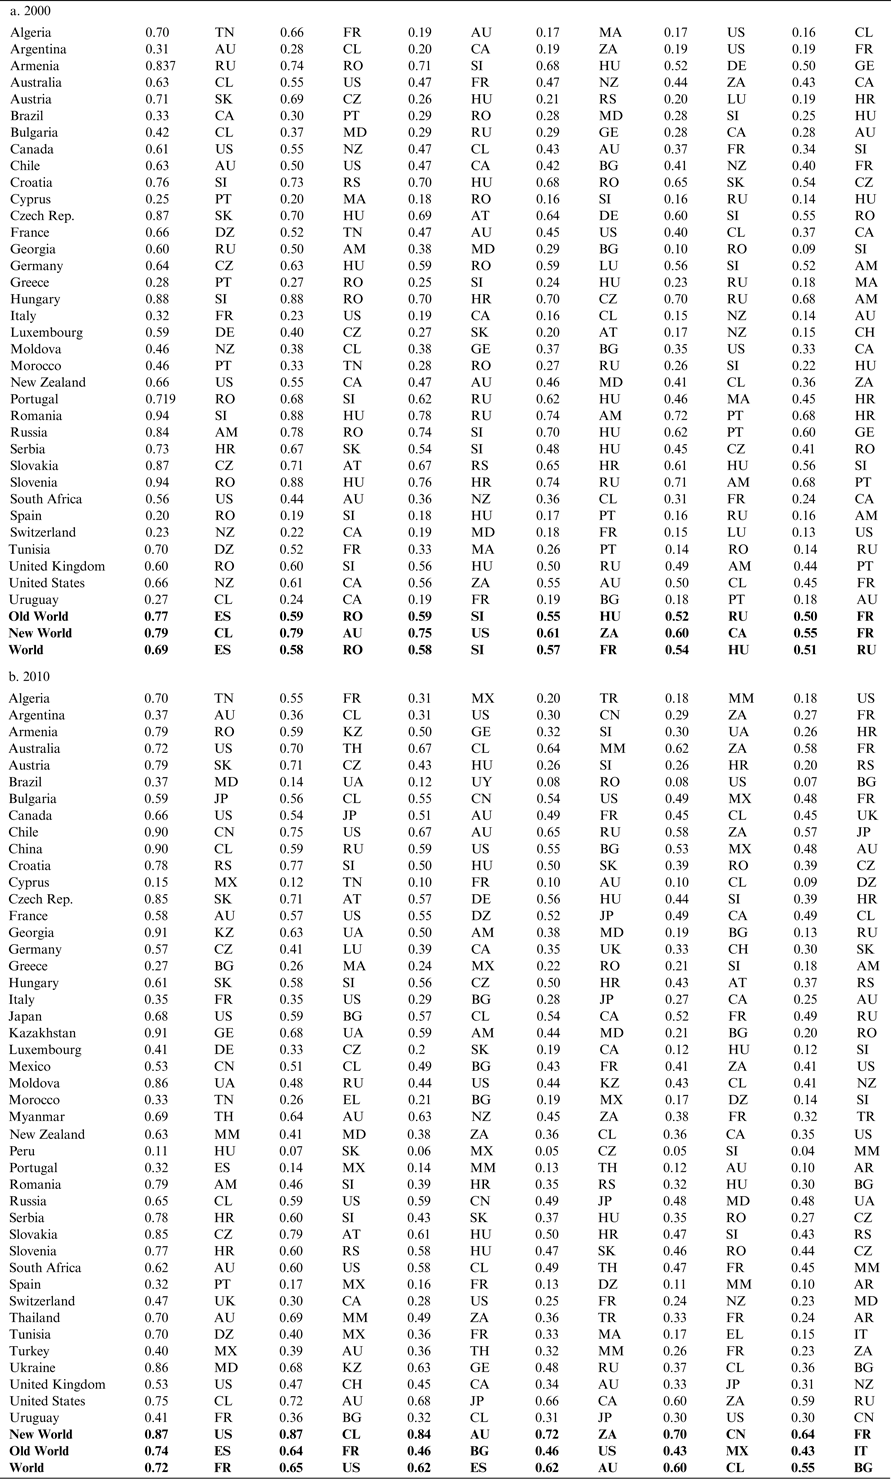
A third use of the VSI is in examining the extent to which a country has a varietal mix similar to that of other countries. In both 2000 and 2010, the New World countries have varietal mixes closest to other New World countries, whereas the varietal mixes of Old World countries are closest to one of their neighbors (Table 1).
Each Country's Six Most-Similar Winegrape Countries in the World According to the Varietal Similarity Index, 2000 and 2010
Key: Algeria (DZ), Argentina (AR), Armenia (AM), Australia (AU), Austria (AT), Brazil (BR), Bulgaria (BG), Canada (CA), Chile (CL), China (CN), Croatia (HR), Cyprus (CY), Czech Rep. (CZ), France (FR), Georgia (GE), Germany (DE), Greece (EL), Hungary (HU), Italy (IT), Japan (JP), Kazakhstan (KZ), Luxembourg (LU), Mexico (MX), Moldova (MD), Morocco (MA), Myanmar (MM), New Zealand (NZ), Peru (PE), Portugal (PT), Romania (RO), Russia (RU), Serbia (RS), Slovakia (SK), Slovenia (SI), South Africa (ZA), Spain (ES), Switzerland (CH), Thailand (TH), Tunisia (TN), Turkey (TR), Ukraine (UA), United Kingdom (UK), United States (US), Uruguay (UY)
V. Possible Extensions and Other Uses of the Database
Space limitations prevent our drilling down to the regional level within countries, but Anderson (Reference Anderson2013) also provides similar share, VII and VSI information for more than 600 regions within 29 of the 44 countries discussed here, full details of which are accessible at Anderson and Aryal (Reference Anderson and Aryal2013).
The regional VSI information in particular may be helpful for producers thinking of altering their varietal mix or relocating to a region with a higher latitude or altitude so as to maintain their firm's current varietal mix in view of global warming. If predictions of climate change were compiled for those 600+ regions, along with their consequent expected changes in the location and productivity of production of the various winegrape varieties across the world, a projected set of VSIs could be calculated to provide a sense of the prospective changes in any region's competition from any other regions that have had, or in the future will have, a similar pattern of varietal specialization.
Likewise, new technological developments—including as an adaptive response to climate change—will alter the VIIs and VSIs, depending on the extent of those new technologies’ impact on the varietal mix of each region and any interregional and international spillovers of those new technologies. Indeed, the VSI could be useful in providing a basis for gauging the potential for interregional spillovers of new variety-specific technologies. If those possible changes in international competitiveness were aggregated to the national level, they could be fed in as shocks to the supply side of a model of the world's wine markets (such as that used by Anderson and Wittwer [Reference Anderson and Wittwer2013]) to project their impact on grape and wine prices and on wine production, consumption, and trade.
While this paper provides a great deal of information about which winegrapes have been grown in various parts of the world during the first decade of the twenty-first century, it leaves open the question of why those varieties have been produced where they are. Is it driven mainly by what grows best in each location (the terroir explanation)? Gergaud and Ginsburgh (Reference Gergaud and Ginsburgh2008) argue that even in Bordeaux that has not been the main explanation. Is the increasing concentration on major French varieties because non-French producers—particularly in newly expanding wine-producing countries—find it easier to market them because of France's strong reputation in those varieties? Might part of the explanation also be that those varieties do well in a wide range of growing environments or have been found to be desirable for blending with traditional varieties of a region? These and other centripetal forces during the first decade of the twenty-first century apparently have dominated the possible centrifugal forces mentioned in the Introduction. It remains to be seen whether the latter will be strong enough to dominate the former over the next decade or so. If China is the country with the greatest expansion of winegrape area in the next few years, and if its new plantings remain focused on key French red varieties, the concentration of the world's varietal mix may continue to increase for some time yet.
National Shares of Global Winegrape Area and Wine Production Volume, 2000 and 2010
Number of Regions and Prime Varieties, by Country, 2000 and 2010