I. INTRODUCTION
Solar energy can provide sufficient power for all of our energy needs if it can be efficiently harvested. An elegant and potentially efficient route to storing solar energy is to convert light into chemical energy in the form of chemical bonds, which is a form of artificial photosynthetic process. Considering the abundance of H2O on the planet, water splitting is a natural pathway for artificial photosynthesis. Hematite (α-Fe2O3) is a candidate material to be used as a photoanode for water splitting due to intrinsic properties such as suitable band gap (2.0–2.2 eV) for visible light absorption, chemical and photoelectrochemical stability, abundance, and low cost. Reference Dare-Edwards, Goodenough, Hamnett and Trevellick1–Reference Murphy, Barnes, Randeniya, Plumb, Grey, Horne and Glasscock4 However, there are enormous challenges to be overcome before this material is available for technological applications. The main challenges in the implementation of this material are: (i) a large overpotential for water oxidation, (ii) a relatively low absorption coefficient requiring thick films (in the range of 400–800 nm) for efficient light absorption, (iii) a poor majority carrier conductivity (electrons), and (iv) a short diffusion length of the minority charge (hole). Reference Kennedy and Frese5–Reference Sivula, Le Formal and Grätzel8 Actually, many of these problems contribute in a direct or indirect way to the electron–hole recombination process. In recent years, a decrease in the electron–hole recombination and an increase in the surface area through the use of a nanostructured hematite film has been the focus of researchers to obtain a high-performance photoanode. Reference Sivula, Le Formal and Grätzel8–Reference Lin, Zhou, Sheehan and Wang10 Indeed, the electron–hole recombination can be minimized in very thin films; however, low light absorption produces low efficiency. Reference Le Formal, Gratzel and Sivula11,Reference Klahr, Martinson and Hamann12 Thus, two strategies can be used to improve the photocurrent in thick films with a maximum of visible light absorption. The first strategy is based on modifying the electronic structure by doping hematite. Reference Lukowski and Jin13–Reference Franking, Li, Lukowski, Meng, Tan, Hamers and Jin16 For instance, Ling et al. Reference Ling, Wang, Wheeler, Zhang and Li17 demonstrated that a hematite thin film doped with Sn(IV) can improve the performance of a hematite photoanode by changing carrier concentrations and carrier mobility. Sivula et al. Reference Sivula, Zboril, Formal, Robert, Weidenkaff, Tucek, Frydrych and Gratzel18 also showed that unintentional doping by tin (Sn4+) during the high temperature sintering process can improve the photocurrent of a hematite film processed by a colloidal route. The second alternative is to use the anisotropic conductivity of pure hematite, which shows higher conductivity along the (001) basal plane. Reference Iordanova, Dupuis and Rosso19–Reference Yanina and Rosso22 For example, this preferential orientation can be induced in a pure and doped hematite thin film using special deposition methods such as chemical vapor deposition, Reference Kay, Cesar and Gratzel23–Reference Campbell, Schwertmann, Stanjek, Friedl, Kyek and Campbell25 atomic ballistic deposition, Reference Hahn, Ye, Flaherty, Bard and Mullins26 nanorod goethite growth, Reference Vayssieres, Beermann, Lindquist and Hagfeldt27 or nanocrystal colloidal deposition. Reference Goncalves, Lima and Leite28 A high temperature also has a strong effect on the texture of a hematite thin film deposited on a transparent conductor oxide (TCO), which is independent of the method used. Reference Hahn, Ye, Flaherty, Bard and Mullins26,Reference Goncalves, Lima and Leite28 However, due to the necessity to use a TCO substrate [mainly SnO2:F (FTO) on glass], the growth of oriented hematite in a specific crystallographic direction is not a simple task.
The recent development of different synthetic routes to process pure and doped hematite photoanodes with controlled dimension and morphology offer practical solutions to improve the overall water oxidation activity. In particular, the processing of a hematite photoanode by nanoparticle deposition followed by a sintering step has attracted special attention due to its high photocurrent Reference Franking, Li, Lukowski, Meng, Tan, Hamers and Jin16 and low overpotential for water oxidation. Reference Goncalves, Lima and Leite28 Apart from this performance progress, many fundamental questions and open issues remain. For instance, there is no consensus about the beneficial impact on photoanode performance of preferential growth along the [110] axis. It is also not clear if the unintentional doping (by tin ions), which occurs during the high temperature sintering process, is important to promote the increase of water oxidation activity. Another point to be explored is the interface quality between the hematite film and the FTO substrate. Transmission electron microscopy (TEM) and scanning transmission electron microscopy (STEM) with analytical capabilities are powerful tools that can provide new information for these fundamental issues. Thus, in this study, an in-depth TEM/STEM analysis of hematite photoanode was performed with high water oxidation activity. This study will provide new insights into the importance of textured structure and unintentional doping on hematite photoanode performance and also will provide pioneer analysis of the hematite/FTO interface.
II. EXPERIMENTAL SECTION
A. Materials
The FTO quartz substrate was purchased from Solaronix S.A. (Aubonne VD, Switzerland). Iron acetylacetonate (99.999%) and oleyl alcohol (C18H36O) were purchased from Aldrich Chemical Co. (St. Louis, MO).
B. Thin film preparation method
The hematite thin film was prepared using the method described in Ref. Reference Goncalves, Lima and Leite28. In a typical process, 4 mg/mL of magnetite nanocrystals solution (in chloroform) was dropped on TCO substrate, with a circular mask (0.19 cm2), and dried at 50 °C. The magnetite film was sintered for 10 min at 550 °C. This deposition/sintering process was repeated twice. For the film sintered at 1000 °C, we used a presintered film at 550 °C (with 2 layers). After that, the presintered film was heat-treated at 1000 °C for 4 min, introducing the sample in the tubular furnace quickly.
C. FIB sample preparation
After photocurrent measurement, the hematite photoanode was washed with distilled water several times and dried. The focus ion beam (FIB) sample was produced from the hematite photoanode films sintered at 550 °C and 1000 °C. The sample preparation was performed in a Helios Nanolab, DualBeam (FIB/SEM), FEI Company (Eindhoven, Netherlands).
D. TEM/STEM characterization
The TEM and STEM/energy dispersive x-ray spectroscopy (EDS) characterization were acquired on TECNAI F20 X-Twin (Eindhoven, Netherlands), operating at 200 kV. For EDS map, a spot size of ∼1.5 nm was used. For the composition profile, the spectrum was recorded to assure 1000 counts on the region of interest and quantified using Cliff–Lorimer k-factor.
E. Photoelectrochemical characterization
Photocurrent measurements were carried out in a standard three-electrode cell using the hematite film as the working electrode (0.19 cm2) (Ag/AgCl in a KCl saturated solution as the reference electrode and platinum wire as a counter electrode). A 1.0-M NaOH (Aldrich, 99.99% in high pure water, pH = 13.6, 25 °C) solution was used as the electrolyte. A scanning potentiostat (Potentiostat/Galvanostat μAutolab III) was used to measure the dark and illumination currents at a scan rate of 50 mV/s. Sunlight (100 mW/cm2) was simulated with a 450-W xenon lamp (Osram, ozone free) and an AM1.5 filter. The light intensity was set at 100 mW/cm2. The incident photo-to-current conversion efficiency (IPCE) was measured as a function of the excitation wave length (λ) using a 300-W Xe lamp coupled to a Jobin-Yvon monochromator (Horiba Jobin Yvon, Edison, NJ) (typical light intensity of 940 μW/cm2 at 500 nm). The IPCE was calculated by considering the following Eq. 1 (Ref. Reference Kennedy and Frese5):
 $${\rm{IPCE}} = I({\rm{\lambda }}) \times 1240/E({\rm{\lambda }}){\rm{\lambda }}\quad {\rm{,}}$$
where I(λ) is the photocurrent density (μA/cm2) and E(λ) is the irradiance (μW/cm2).
III. RESULTS AND DISCUSSION
Hematite thin films were produced by a magnetite nanocrystal deposition process. Reference Goncalves, Lima and Leite28 The film was sintered at 550 and 1000 °C with rapid annealing to minimize damage to the substrate. Due to the high sintering temperature, FTO was deposited over pure silica glass as a TCO substrate. However, it is important to point out that the photocurrent data of the film sintered at 1000 °C showed low reproducibility. In this way, the film that showed the best photocurrent performance was used for further study. A high sintering temperature was intentionally used to intensify the tin diffusion on hematite film to understand the effect of this parameter on the texture and nanostructure of the film. The interface analysis characterization by TEM/STEM demands a cross-sectional analysis of the film/substrate. Due to the mesoporous nature of the hematite film, the conventional sample preparation technique is not appropriate to obtain thin samples. Thus, a FIB system was used to prepare high quality cross-sectional samples for HRTEM and STEM with EDS analysis. For HRTEM and STEM/EDS analyses, a TECNAI F20 FEI microscope was used which was operated at 200 kV. TEM/STEM analyses were performed on the same samples used for the photoelectrochemical characterization.
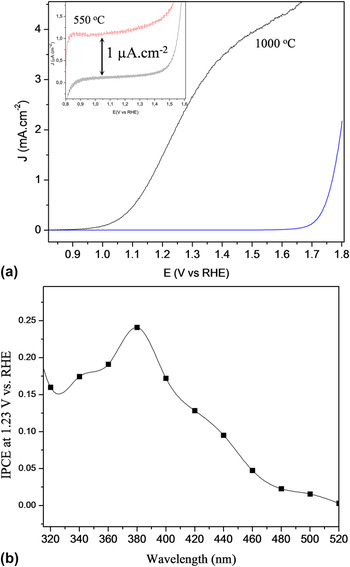
Figure 1(a) shows current potential curves of films sintered at 550 and 1000 °C under front-side illumination. Figure 1(a) illustrates that the photoanode prepared at 550 °C revealed very low activity for water oxidation (see inset); however, the photoanode sintered at 1000 °C resulted in very high activity. As a general trend, the hematite photoanode sintered at a high temperature under illumination produced a sharp increase in the photocurrent around 1.0 V RHE, which reached a plateau before the onset of the dark current. This photoanode reached a photocurrent of 1.8 mA/cm2 at 1.23 V RHE and 3.5 mA/cm2 at 1.4 V RHE. The incident photon conversion efficiency (IPCE) measurement [see Fig. 1(b)] confirms the high efficiency of the mesoporous photoanode under front-side illumination. The film sintered at 1000 °C has IPCE values at 1.23 V of 24% around 400 nm.
(a) Current potential curves of films sintered at 1000 °C under front-side under illumination and in the dark (blue line). The inset shows in detail the film sintered at 550 °C. (b) The IPCE measurement for the film sintered at 1000 °C.

The photoelectrochemical characterization clearly shows the influence of sintering temperature on the hematite photoanode activity. To understand this dependence, a detailed structural, chemical, and nanostructural characterization of the films sintered at 550 °C and 1000 °C was performed.
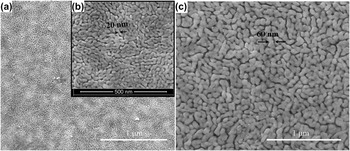
The top-view characterization by field-emission scanning electron microscopy (FE-SEM) (see Figure 2) shows the nanostructured nature of films sintered at different temperatures. Both films are composed of elongated grains (typical size of 60 nm for the film sintered at 1000 °C and 20 nm for the film sintered at 550 °C) and open porosity, which characterizes a mesoporous film.
The film morphology was characterized by FE-SEM (FEI Inspect F-50). FE-SEM images of (a) and (b) hematite thin film sintered at 550 °C, and (c) at 1000 °C.

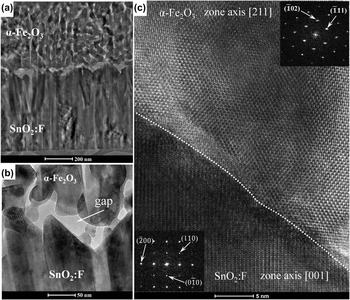
Figure 3 shows a TEM/HRTEM cross-sectional view of the hematite thin film sintered at 550 °C. The first information obtained from the low magnification bright-field (BF) TEM image [see Fig. 3(a)] is the very poor solid–solid contact between the hematite film and the FTO film; only a few contact points are visible. In the high magnification BF-TEM image [see Fig. 3(b)], unfilled spaces (gaps) between the FTO and hematite are evident with dimensions ranging from 20 to 5 nm. This very poor solid–solid contact is a direct consequence of a heating process that eliminates the solvent and organic compound and produces phase transformations (Fe3O4 is transformed to maghemite γ-Fe2O3, and γ-Fe2O3 is transformed to α-Fe2O3 around 450 °C). This microstructural observation clearly explains the very low activity measured for water oxidation for the photoanode sintered at 550 °C. In addition, the HRTEM image [see Fig. 3(c)] of a contact point between the hematite and the FTO shows an incoherent interface (an interface between two phases where there is no lattice matching). This image shows that the hematite is oriented along the [211] zone axis, and the FTO is oriented along the [001] zone axis.
Cross-sectional TEM images of the hematite thin film sintered at 550 °C. (a) Low magnification BF-TEM image, (b) high magnification BF-TEM image, and (c) HRTEM image of the FTO/α-Fe2O3 interface. A dashed line has been added at the interface as a guide to the eyes. Insets: fast Fourier transform (FFT) analysis of the hematite and SnO2, showing the zone axis of each phase.

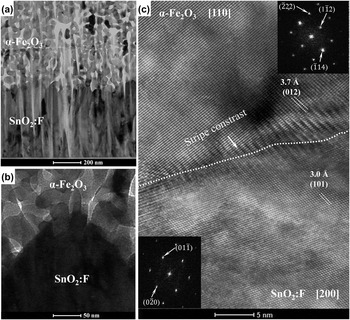
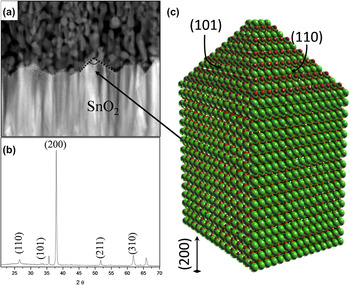
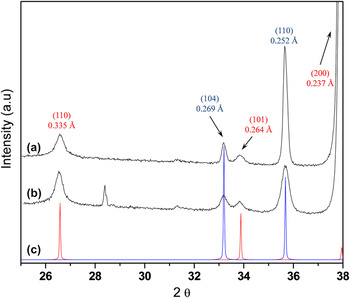
The photoanode sintered at 1000 °C was also characterized by TEM/HRTEM cross-sectional analysis. Figure 4(a) shows a low magnification BF-TEM image of this sample, and the first evident detail is the improvement of the hematite/FTO solid–solid interface and the formation of a mesoporous film with a columnar hematite structure. Figure 4(b) shows a high-magnification BF-TEM image of the interface highlighting the absence of an unfilled space and a much better solid–solid contact. Several hematite/FTO interfaces were analyzed by HRTEM, and incoherent and semicoherent interfaces were observed. Figure 4(c) shows the HRTEM image of a semicoherent interface between hematite (α-Fe2O3) and FTO. The image analysis shows that α-Fe2O3 and SnO2 phases are oriented along the [110] and [100] zone axes, which indicates an epitaxial interface relationship between the (012)α-Fe2O3 and (110)SnO2 planes ((012)α-Fe2O3//(110)SnO2). Also Fig. 4(c) shows a peculiar stripe contrast, which is related to the presence of dislocations at the interface. These dislocations are formed at the interface to offset some of the coherency strain required to maintain matching between crystalline planes. Considering that the relative strain (ε) due to the misfit of the lattice is given by ε ≈ |d(012)α-Fe2O3−d(110)SnO2|/d(012)α-Fe2O3, where d(012)α-Fe2O3 and d(110)SnO2 are the (110) and (012) unstressed interplanar distances of SnO2 and hematite, respectively, we can estimate ε ≈ 19%, which characterizes a semicoherent interface. For instance, a coherent interface is possible for the epitaxial interface relationship between the (110)α-Fe2O3 and (101)SnO2 planes ((110)α-Fe2O3//(101)SnO2), with ε ≈ 3.8% and (110)α-Fe2O3//(200)SnO2 with ε ≈ 4%; however, these interfaces were not observed in the present study. XRD and cross-sectional TEM analyses of the TCO used in this study [see Figs. 5(a) and 5(b)] indicate morphology and structure which are schematically illustrated in Fig. 5(c). An analysis of this figure reveals that this morphology and texture are not favorable for the formation of a coherent interface, which suggests that the TCO substrate morphology has a fundamental impact on the type of interfaces in the hematite photoanode. Any improvement in the interface between the hematite and the TCO will necessarily demand the development of a TCO with a different morphology and preferential orientation. Figure 6 shows an XRD analysis of the hematite films sintered at 550 °C and 1000 °C. In both samples, a preferential orientation of the hematite film in the [110] axis vertical to the substrate was observed. However, normalizing the peak intensity of the (110) plane by that of the (104) plane of hematite, the film sintered at 1000 °C shows a value of normalized intensity four times higher than the hematite thin film sintered at 550 °C, which indicates a higher degree of orientation. This result shows that the increase in the sintering temperature has a direct impact on the degree of orientation.
Cross-sectional TEM images of the hematite thin film sintered at 1000 °C. (a) Low magnification BF-TEM image, (b) high magnification BF-TEM image, and (c) HRTEM image of the FTO/α-Fe2O3 interface. A dashed line has been added at the interface as a guide to the eyes. Insets: FFT analysis of hematite and SnO2, showing the zone axis of each phase.

(a) XRD, (b) cross-sectional TEM analysis of the TCO used in this work (sample sintered at 1000 °C), and (c) schematic representation of the FTO morphology based on TEM and XRD analyses.

XRD pattern of a hematite thin film sintered at two different temperatures: (a) 1000 °C, (b) 550 °C; (c) standard of hematite (blue) (JCPDS-ICDD PDF card no. 33-0664) and standard of cassiterite (JCPDS-ICDD PDF card no. 41-1445) (red).

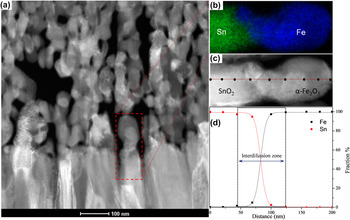
In our previous research, the unintentional doping by tin (Sn4+) was not detected by x-ray photoelectron spectroscopy and EDS analysis for a hematite film sintered at 820 °C. Reference Goncalves, Lima and Leite28 However, in the present study, the sintering temperature was intentionally increased to enhance the interdiffusion process in the hematite/FTO interface. To characterize this process, an STEM-EDS analysis was performed with a spatial resolution better than 1.5 nm and a high exposure time which assured a good signal-to-noise ratio and reliable results. For this study, EDS elemental mapping images and a concentration line profile analysis were used. The image drift during the acquisition process was correct when the initial high annular dark-field (ADF) image was used as a reference. Figure 7 illustrates the STEM-EDS analysis of the film sintered at 1000 °C. Figure 7(a) shows a low-magnification ADF image of the hematite/FTO interface, which highlights the region analyzed by EDS [see Figs. 7(b) and 7(c)]. Figure 7(b) shows the x-ray elemental map of the region illustrated in Fig. 7(a). A well-defined interface is evident between the hematite and the SnO2 (FTO), which suggests a very low interdiffusion region. To quantitatively estimate the interdiffusion region, a line profile analysis was performed in the region shown in Fig. 7(c) [as illustrated in Fig. 7(d)]. The results show a diffusion length of ∼40 nm for Sn in hematite and a ∼60-nm diffusion length for Fe in FTO. A line profile analysis of other interfaces produced very similar results. An important point is that EDS point analysis far from the interface which was run with a very high exposure time (more than 6 min) did not detect Sn in the hematite film. These results demonstrate that the diffusion of Sn occurs only in a limited region of the interface (only 40 nm). Thus, it is plausible to assume that the unintentional doping by Sn4+ is not significant for hematite photoanode performance for water oxidation because the hematite film has a thickness of 700 nm. Another critical point is that Fe diffusion into the FTO can cause modification in the TCO substrate electronic properties.
STEM-EDS analysis of a film sintered at 1000 °C. (a) Low magnification ADF-STEM image, (b) STEM-EDS elemental x-ray map for Sn (L-line) in green and Fe (L-line) in blue, (c) inset of ADF-STEM image where EDS line profile analysis was performed, and (d) profile of the composition for Fe and Sn at the interface region.

A detailed microstructural characterization of the film sintered at 1000 °C shows that the sintering temperature has a strong influence on the growth of a mesoporous hematite thin film with a columnar grain structure textured in the [110] zone axis. The grain and pore size analysis after the sintering process reveals an intense grain growth process, and the STEM-EDS analysis indicates the formation of an interdiffusion layer at the hematite/FTO interface, which is initiated by unintentional doping of ∼100 nm. The mechanism that promoted the textured thin film with a columnar morphology is unknown; however, it may be related to a grain growth process based on rearrangement between particles followed by coalescence. This rearrangement also promotes the formation of an interface free of unfilled space, which improves the solid–solid contact. The photoelectrochemical characterization also revealed that this photoanode has very good activity for water oxidation with a photocurrent of 1.84 mA/cm2 at 1.23 V RHE.
The excellent performance of the photoanode sintered at 1000 °C must be related to the preferential growth of the hematite film along the [110] axis as the influence of the unintentional doping of hematite with Sn4+ is limited to a thinner layer in the FTO interface. Actually, for the first time, the preferential growth direction with the water-splitting activity can be correlated without the interference of intentional or unintentional doping. Two beneficial effects of the preferential growth along the [110] axis of the hematite film in the performance of the photoanode can be identified. First, hematite has an anisotropic conductivity; i.e., the electronic conductivity along the (001) plane is four orders of magnitude higher than in any perpendicular plane. Reference Yanina and Rosso22 This high charge (electron) mobility must contribute to more efficient charge separation in the water oxidation process. Second, elongated textured hematite grains along the [110] axis have a high fraction of the (001) surface. It is generally accepted that, in relation to other hematite surfaces, the (001) surface is relatively inert (in water) to the protonation and deprotonation reactions required for charge accumulation. Reference Yanina and Rosso22 As proposed in our previous paper, Reference Vayssieres, Beermann, Lindquist and Hagfeldt27 this behavior can favorably decrease the hematite surface trapping state in a water-based electrolyte, which contributes to water photooxidation.
IV. CONCLUSION
In this study, HRTEM and STEM-EDS with high spatial resolution analyses were combined to obtain an in-depth nanostructural characterization of a textured hematite photoanode with columnar grains obtained by the colloidal deposition of magnetite nanocrystals. Our study is the first attempt to describe in detail the structure and chemistry of the α-Fe2O3/FTO interface which identifies semicoherent and incoherent interfaces as well as a localized interdiffusion layer of Sn and Fe at the interface (∼100 nm in length). Actually, the nanostructural characterization clearly shows that interface quality is an important issue that must be taken into account in future studies of hematite photoanodes. The correlation of the nanoscale morphology with photoelectrochemical characterization facilitates the identification of the beneficial effect of the preferential growth direction of the hematite film along the [110] axis in water-splitting efficiency. We anticipate that the results described in this study will also be relevant to the development of a hematite photoanode with higher efficiency and will foster the exploration and development of better (coherent) hematite/TCO interfaces as well as improve nanocrystal deposition to achieve columnar hematite completely oriented in the (110) direction.
ACKNOWLEDGMENTS
The financial support of FAPESP (projects 98/14324-0), FINEP, CNPq (INCT program), and CAPES (all Brazilian agencies) is gratefully acknowledged. We acknowledge Dr. David M. Donnet, Fernando Mendoza, and Nanoport-FEI Company for FIB sample preparation.