INTRODUCTION
Coffee is one of the most important commodities in international agricultural trade, representing a significant source of income for producer countries. Brazil is the world's largest coffee producer with a total yield of more than 43 million bags (60 kg) of green beans in 2014 (www.ico.org). During recent decades, drought was considered the major environmental stress affecting coffee production in several coffee-growing countries, including Brazil. In the frame of global climatic change, the occurrence of heat waves accompanying drought periods should increase and modify coffee production and localization (Davis et al. Reference Davis, Gole, Baena and Moat2012; Bunn et al. Reference Bunn, Läderach, Perez Jimenez, Montagnon and Schilling2015).
From an agro-meteorological point of view, drought refers only to a period in which rainfall fails to keep up with potential evapotranspiration. In the tropics, drought should be considered as a multidimensional stress because it is aggravated by both high solar radiation and high temperature (DaMatta Reference DaMatta and Hemantaranjan2003). Altogether, these environmental factors affect coffee plant physiology, and production may decrease as much as 80% in very dry years (DaMatta & Ramalho Reference DaMatta and Ramalho2006). For example, drought affected carbohydrate metabolism in seedlings of ‘Siriema’ (a hybrid of C. arabica × C. racemosa Lour.), increasing total soluble and reducing sugars and reducing starch content, both in leaves and roots of non-irrigated plants grown under greenhouse conditions (Chalfun-Junior et al. Reference Chalfun-Junior, Melo, Fernandes, Barquero and Alves2011). Drought is also known to affect coffee bean metabolism, accelerating fruit development and ripening, increasing the percentage of bean defects and consequently affecting coffee quality (DaMatta & Ramalho Reference DaMatta and Ramalho2006). The most adverse effects of drought are earlier leaf senescence and shoot die-back that can lead to fruit and flower premature abortion, affecting coffee yields directly and eventually causing plant death in the case of severe stress conditions (Waller et al. Reference Waller, Bigger, Hillocks, Waller, Bigger and Hillocks2007).
In addition to drought stress, nutritional disequilibrium is also known to alter not only the physiology of the coffee plant (i.e. photosynthesis, absorption and transport of nutrients and photo-assimilates), but also coffee fruit development and consequently final coffee beverage quality (Amorim Reference Amorim1970). Potassium (K), which is highly accumulated in coffee pulp, is considered a key component of coffee quality (Willson Reference Willson, Clifford and Willson1985; Cong et al. Reference Cong, Sat, Härdter, Horst, Schenk, Bürkert, Claassen, Flessa, Frommer, Goldbach, Olfs, Römheld, Sattelmacher, Schmidhalter, Schubert, Wirén and Wittenmayer2001). Silva et al. (Reference Silva, Nogueira, Guimarães, Chagas and Costa1999) observed high polyphenol oxidase activity and sugars in beans of good quality coming from coffee plants fertilized with potassium sulphate (K2SO4). However, the effects of fertilization are subject to discussion because coffee quality also depends on edaphic and climatic factors (Decazy et al. Reference Decazy, Avelino, Guyot, Perriot, Pineda and Cilas2003; Avelino et al. Reference Avelino, Barboza, Araya, Fonseca, Davrieux, Guyot and Cilas2005), as well as plant genetic background, bean development and post-harvest treatments (for a review, see Leroy et al. Reference Leroy, Ribeyre, Bertrand, Charmetant, Dufour, Montagnon, Marraccini and Pot2006).
Physiological stresses related to overproduction or nutritional deficiency reduce bean size as a result of carbohydrate competition among berries during bean filling (Cannell Reference Cannell, Clifford and Willson1985; Anand et al. Reference Anand, Kumar and D'souza2014). Such effects can be reduced greatly by growing coffee under agroforestry systems, with shaded coffee producing beans of larger size and also of higher beverage quality than those from plants grown in full-sun conditions (Vaast et al. Reference Vaast, Bertrand, Perriot, Guyot and Génard2006; Geromel et al. Reference Geromel, Ferreira, Davrieux, Guyot, Ribeyre, Dos Santos Scholz, Pereira, Vaast, Pot, Leroy, Androcioli Filho, Vieira, Mazzafera and Marraccini2008). Among the biochemical compounds of coffee bean, sucrose is one of the most important precursors of coffee flavour and aroma (De Maria et al. Reference De Maria, Trugo, Moreira and Werneck1994). Previous studies have shown that large variations in rainfall and temperature, but also other parameters such as altitude, affected bean sucrose content (Guyot et al. Reference Guyot, Gueule, Manez, Perriot, Giron and Villain1996). Other studies also pointed out a negative correlation between sucrose and lipid content in beans of C. arabica (Decazy et al. Reference Decazy, Avelino, Guyot, Perriot, Pineda and Cilas2003; Avelino et al. Reference Avelino, Barboza, Araya, Fonseca, Davrieux, Guyot and Cilas2005), whereas shade did not seem to affect caffeine, chlorogenic acid (CGA), proteins or trigonelline content significantly (Vaast et al. Reference Vaast, Bertrand, Perriot, Guyot and Génard2006; Geromel et al. Reference Geromel, Ferreira, Davrieux, Guyot, Ribeyre, Dos Santos Scholz, Pereira, Vaast, Pot, Leroy, Androcioli Filho, Vieira, Mazzafera and Marraccini2008).
In the past few decades, coffee production in Brazil has extended into the Cerrados, a large region with Savanna-type vegetation and characterized by well-defined dry and wet seasons (Ratter et al. Reference Ratter, Ribeiro and Bridgewater1997). This precipitation pattern, while challenging sustainable coffee production via the high risk of severe drought during the dry period, allows a controlled induction and relief of plant water stress in irrigated systems, with the advantage of a synchronized flowering period, uniform maturity at harvest and a potential increase in bean quality (Guerra et al. Reference Guerra, Rocha, Rodrigues, Sanzonowicz, Ribeiro Filho, Mera and Cordeiro2008).
Despite its evident agronomic importance, the effects of controlled irrigation on the biochemical composition, physical characteristics of coffee beans and consequent quality of the product have not been investigated extensively. To our knowledge, the most detailed study concerning the effects of irrigation on the biochemical composition and cup quality of coffee beans was done by Silva et al. (Reference Silva, Mazzafera, Brunini, Sakai, Arruda, Mattoso, Carvalho and Pires2005) who analysed the same cultivar, C. arabica L. ‘Obatã IAC 1669-20’, in different regions of the São Paulo state of Brazil, characterized by different annual means of temperature and rainfall. In that pioneering work, Silva et al. (Reference Silva, Mazzafera, Brunini, Sakai, Arruda, Mattoso, Carvalho and Pires2005) showed that sucrose content was higher in beans of non-irrigated coffee plants grown in warmer regions while an inverse relationship was observed for reducing sugars. On the other hand and whatever the environmental conditions, caffeine content always appeared to decrease with irrigation while no statistical differences were observed for lipid contents. Interestingly, amino acid contents were higher, but showed a tendency to decrease with irrigation, in beans of coffee plants grown in the warmer region, giving a low-quality beverage. In this region, high protease activities were proposed to be responsible for these changes. Even though the Silva et al. (Reference Silva, Mazzafera, Brunini, Sakai, Arruda, Mattoso, Carvalho and Pires2005) study was performed by analysing only one harvest, it clearly demonstrated that environmental conditions influenced the chemical composition and quality of coffee beans. In the present work, the influence of controlled irrigation and fertilization on coffee bean components was analysed during three consecutive harvests.
MATERIALS AND METHODS
Plant material and experimental area
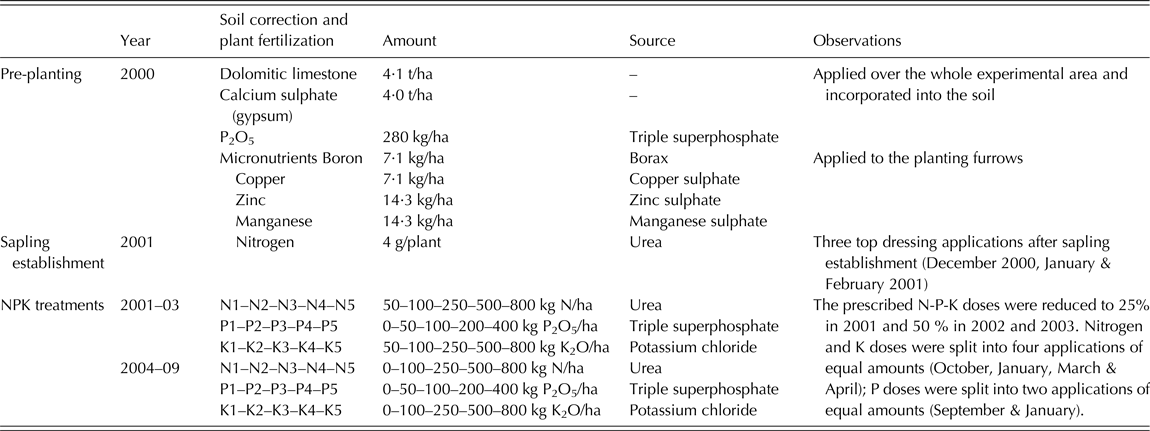
Saplings of Coffea arabica L. ‘Rubi MG1192’ were transplanted in December 2000 at a density of 7100 plants/ha (2·80 m between rows and 0·5 m between plants) at the experimental station of the Brazilian Agricultural Research Center (Embrapa Cerrados) in Planaltina, DF, Brazil (15°35′S, 47°43′W, 1007 m a.s.l.) in full-sun conditions. The soil is a Rhodic Hapludox (oxisol) according to the Brazilian System of Soil Classification (and US Soil Taxonomy) (Green et al. Reference Green, Stott, Cruz and Curi2007), previously covered with Brachiaria decumbens. Prior to planting, dolomitic limestone (4·1 t/ha), calcium sulphate (gypsum, 4·0 t/ha) and 280 kg/ha of P2O5 (triple-superphosphate) were incorporated in the whole area and the planting hole was fertilized with micronutrients according to commercial coffee production recommendations. Following plant establishment, 4 g nitrogen (N, as urea) per plant was applied as a top-dressing three times, at monthly intervals (in December 2000, January and February 2001). The complete history of fertilization applications is given in Table 1. These plants were grown under fertilization and irrigation conditions as described in the following sections and the first harvest was in May 2003. Plants were pruned after the third harvest (May 2005), leaving the main (orthotropic) axis at 1·60 m high and lateral (plagiotropic) branches at a maximum length of 0·40 m, and therefore unable to produce fruits in 2006. Fruits were again harvested (April–May) in 2007, 2008 and 2009 from plants of 6·5 (fourth harvest), 7·5 (fifth harvest) and 8·5 (sixth harvest) years old, respectively. Weeds were controlled manually and plants were treated when necessary to avoid diseases and pests (leaf miner and rust) development.
History of fertilization applied to Coffea arabica ‘Rubi’ plants

P2O5, phosphorus pentoxide; N, nitrogen; P, phosphorus; K, potassium, K2O, potassium oxide.
Nitrogen–phosphorus–potassium treatments
After planting, different nitrogen–phosphorus–potassium (NPK) annual doses were established in the experimental area (Table 1). For each nutrient and water regime (WR) treatment (see below), the experimental setup consisted of five nutrient doses and three replications per dose, with replication plots composed of three lines with eight plants each. The fertilization treatment doses were : N1, N2, N3, N4 and N5 which correspond to 0, 100, 250, 500 and 800 kg N/ha, respectively, applied as urea; P1, P2, P3, P4 and P5 corresponded to 0, 50, 100, 200 and 400 kg of P2O5/ha, respectively, applied as triple-superphosphate; K1, K2, K3, K4 and K5 corresponded to 0, 100, 250, 500 and 800 kg of K2O/ha, respectively, applied as potassium chloride. Within each individual NPK treatment, the dose of the other two nutrients were fixed, corresponding to the fourth fertilization level (e.g. treatment N1 to N5 received P4 and K4 doses, P1 to P5 received N4 and K4 doses and K1 to K5 received N4 and P4 doses). The fourth level of the nutrient was chosen because it approximates the usual high-yield fertilization rates of commercial irrigation production systems, Andrade (Reference Andrade, de Sousa and Lobato2004). The total N and K fertilization dose was divided into four identical applications, starting in October and ending in April, while P dose was split into two applications of equal amounts (September and January, see Table 1).
Water regimes
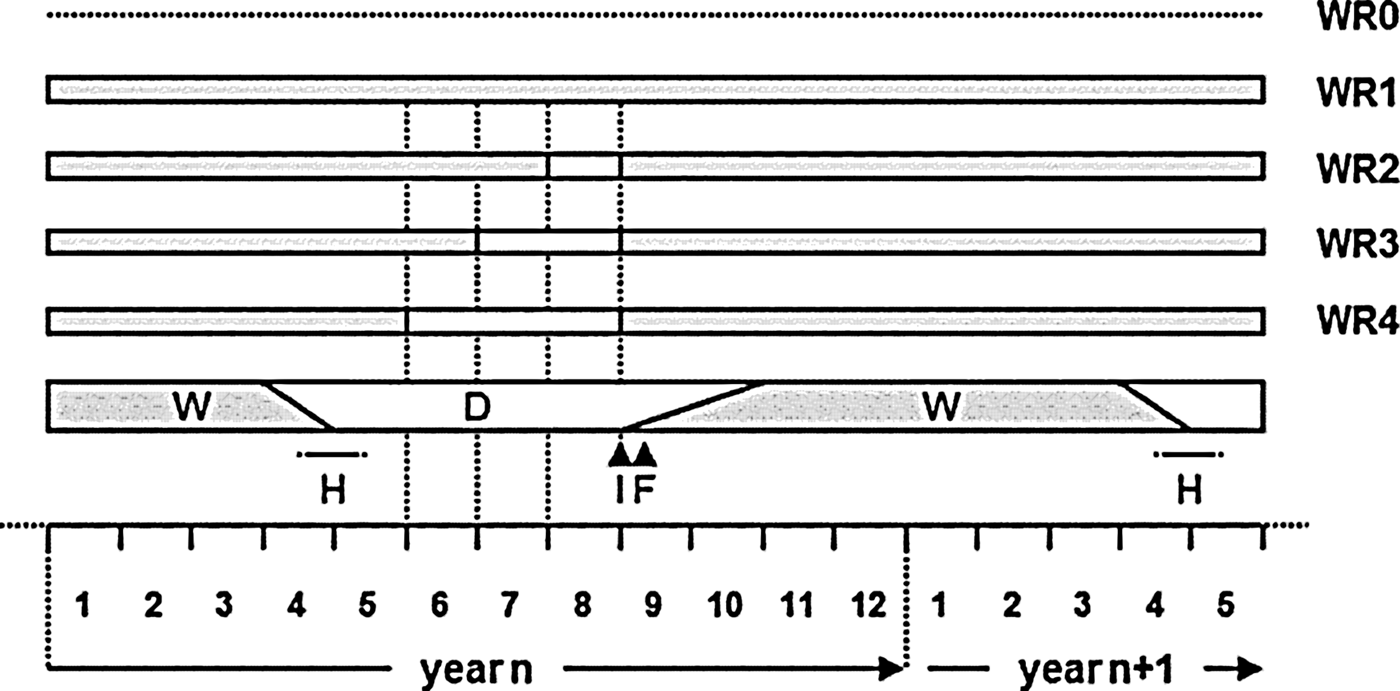
Under the conditions of the Cerrado climate (Ratter et al. Reference Ratter, Ribeiro and Bridgewater1997), the precipitation regime is characterized by a dry season (from May to mid-October) followed by a wet season with >0·8 of annual precipitation (Fig. 1). The NPK-dose treatment plots were irrigated by a centre pivot irrigation system (8 ha) and divided into four equal quadrants of WRs, originally designed to test the synchronization of coffee flowering by irrigation during the dry season (Guerra et al. Reference Guerra, Rocha, Rodrigues, Sanzonowicz, Ribeiro Filho, Mera and Cordeiro2008). These WRs were initiated in June 2002 (plants of 1·5 years old) and characterized as follows: WR1, irrigated during the whole year; WR2, WR3 and WR4 with an average of 61, 74 and 99 days, respectively, without irrigation during the dry seasons of 2006, 2007 and 2008 (Fig. 1). The period of irrigation suspension for the WR2 to WR4 treatments usually ended by the first week of September, and flowering was observed around 10 days after the first irrigation. Afterwards, from flowering to harvest, the WR1 to WR4 plots were irrigated as required. Soil moisture sensors (ML2x, Delta-T Devices, Cambridge, UK) were installed in the planting line at depths of 0·10, 0·20, 0·30, 0·50 and 1·0 m. Daily readings of the volumetric soil moisture content were performed in the four quadrants of the central pivot system and in the dry area. The time of irrigation was established when the reading of the moisture sensor installed at 0·10 m achieved 0·29 m3/m3, which corresponded to a soil matric potential of 50 kPa. The depth of water in each WR was calculated to refill the soil profile, up to 0·40 m depth, to the water holding capacity (0·35 m3/m3). The average irrigation amount was 24·2 mm. The WR0 plots (without irrigation and subject only to natural rainfall) were localized outside the pivot but fertilized as described for the plots grown under WR1 to WR4 conditions. Due to the particularly severe and prolonged dry season of 2007, WR0 plants suffered excessive drought that led to complete failure of flowering and consequently fruit production in 2008 (Table 3).
Schematic representation of the experimental trial. The large bars represent the timing of wet (W) and dry (D) seasons with the months indicated in the scale. Dates of harvest (H), return of irrigation (I) and consecutive flowering (F) are also indicated. The different water regimes (WR) are presented with the corresponding periods of drought (white boxes) and irrigation (grey boxes).

Fruit sampling and processing
For each individual NPK-dose and WR, each biological replication was made by harvesting berries from the six central plants in each of the three central lines to avoid side effects. In 2007 and 2009, 225 samples were analysed, corresponding to three NPK treatments × five doses NPK × three biological repetitions × five WR conditions, from WR0 to WR4 (Table 2). In 2007, only 180 samples were analysed since no harvest was possible for the WR0 treatment. Cherry fruits with red pericarp turning to purple and containing hard white endosperm were handpicked at maturity (April–May; green fruits and overripe cherries with a dried pericarp turning brown to black were not considered). Fruits were sun-dried for 15–0 days until beans reached 10–12% humidity levels and then processed mechanically to remove dried pericarp and endocarp (parchment).
Description of the samples analysed during the present study. Harvest year (Y), water regime (WR0 to WR4), fertilizer conditions (N or P or K treatments, with five doses for each treatment) and number of biological repetitions are presented

* In 2007 and 2009, 225 samples (three NPK treatments × five doses NPK × three biological repetitions × five WR conditions) were analysed each year. Due to a severe drought during the winter 2007, WR0 plants did not produce fruits in 2008 (180 samples: three NPK treatments × five doses NPK × three biological repetitions × four WR conditions).
Coffee-bean characteristics
Bean size distribution was evaluated using a series of sieves with diameters ranging from 4·8 to 7·1 mm (Geromel et al. Reference Geromel, Ferreira, Davrieux, Guyot, Ribeyre, Dos Santos Scholz, Pereira, Vaast, Pot, Leroy, Androcioli Filho, Vieira, Mazzafera and Marraccini2008). The classification used 100 g of beans and was made by calculating the average of beans retained in each sieve. Bean defects were evaluated using 300 g of dry beans (Leroy et al. Reference Leroy, Ribeyre, Bertrand, Charmetant, Dufour, Montagnon, Marraccini and Pot2006).
Chemical analysis
For each sample, 50 g of coffee beans were equilibrated for 6 days at 60% humidity and 28 °C prior to being frozen in liquid nitrogen and ground to a fine powder (particle size of 0·5 mm) using a Retsch ZM200 grinder (Retsch, Basel, Switzerland). A monochromator instrument near-infrared spectrophotometer (NIRS) 6500 (Foss NIRSystems, Port Matilda, PA, USA) was used to scan the reflectance (Williams & Norris Reference Williams and Norris1990) from 400 to 2500 at 2 nm intervals, using ring cups (50 mm diameter) containing about 3 g of coffee powder. Data were saved as the average of 32 scans and stored as log (1/R), where R is the reflectance at each wavelength and 1 the reflectance of a standard ceramic reference (Scanlon et al. Reference Scanlon, Pritchard and Adam1999). Spectrum acquisitions were done randomly, each sample was measured twice, and the average spectrum was stored. Data were treated by Winisi 1·5 software (Intrasoft Int., Port Matilda, PA, USA).
Near-infrared spectroscopy
Calibration models based on NIR spectra and wet chemistry analyses were developed, in the Centre de Coopération Internationale en Recherche Agronomique pour le Développement (CIRAD), for each individual constituent over 10 years. Models were based on 200–500 coffees samples, depending on the constituent. Coffee samples used in calibrations came from several origins and covered different varieties, including many samples from Brazil. The different models were validated on independent sets of validation samples and the performances were compared with wet chemistry error (Davrieux et al. Reference Davrieux, Manez, Durand, Guyot, Davies and Garrido-Varo2003). Results showed that all the calibration samples belonged to the CIRAD spectral database, according to their Mahalanobis distance with a confidence level of 99% (Shenk & Westerhaus Reference Shenk and Westerhaus1991). Knowing this, the coffee samples of the present work were analysed under the same conditions and on the same instrument for their NIR spectra using the CIRAD models to predict caffeine, dry matter (DM), trigonelline, total lipids (fats), sucrose and CGAs contents.
Linear discriminant analysis
Linear discriminant analysis (LDA) is a supervised statistical method used to find a linear combination of features, which characterize or separate two or more classes of objects or events. It allows a description of samples according to classes and a class affectation prediction for unknown samples. The spectral variables are highly correlated; thus, the calculation of discriminant functions is impossible. The solution is to replace the spectral data in the LDA analysis with the principal components (PC) extracted by Principal Component Analysis (PCA) and associated with non-zero eigenvalues (Devaux et al. Reference Devaux, Bertrand, Robert and Qannari1988). The choice of PC to be included in the LDA is done via a step-by-step analysis (Downey et al. Reference Downey, Robert, Bertrand and Kelly1990). At each step the variable (PC) maximizing the Mahalanobis distance inter-group is introduced into the model. In the present study, classes were defined by the WRs, thus five classes were retained, whilst the quantitative variables were the first eight PCs extracted from the PCA analysis done on the spectral data. The PCA and discriminant model were performed using WINISI 1·5 software (Infrasoft International, Port Matilda, USA), and XLSTAT version 2008 6·02 (Addinsoft, Paris, France).
Statistical analysis
Within each WR, three randomized blocks of five plots were set up for each fertilizer N, P and K, and each fertilizer was applied at five levels in the three blocks, with the two other fertilizers kept at a constant level. Three distinct experiments were therefore considered and analysed separately. Data for each year were analysed separately because of very different climatic conditions between the 3 years and treated using a mixed model analysis of variance. The factors ‘WR’ and ‘fertilizer (Fer: N, P and K)’ were considered fixed, and factor block within WR was considered random. For each Fer, the observed value Y ijk corresponding to WR i, block j within i, and Fer level k, was modelled as follows:
 $$Y_{ijk} = m + a_i + {\rm} B_{ij} + {\rm} c_k + {\rm} (ac)_{ik} + {\rm} E_{ijk} $$
where m = overall mean, a i = fixed effect of i (WR), B ij = random effect of block j within WR i, c k = fixed effect of fertilizer k, (ac) ik = interaction WR × Fer and E ijk = random residual error. The fixed effects (i.e. a i and c k ) were tested in the analysis of variance using their total sum of squares, although it was possible to partition them into orthogonal contrasts. Polynomial partitioning is relevant for factors with quantitative incremental increase, which is not the case of WR because the levels are not quantitatively comparable. For example, it is not possible to assign a quantitative value to the difference between WR1 (irrigated during the whole year) and WR2 (61 days without irrigation during the dry seasons). For that reason WR was considered more as a qualitative factor, even if the levels could be (more or less) ordered. The sums of squares of the fertilizers (N, P and K) could also be partitioned in linear and non-linear contrasts (even if the doses are not equally spaced), but it was decided to test the associated four degrees of freedom together in each analysis. It was considered that the significance (or not) of the global test would provide sufficient information given the objective of the present study, since when the global test is significant more information can be obtained visually from the curve even if the separate contrasts are not formally tested. For the analyses of variance, normality of residuals was tested for all variables. No transformation was then needed for any variable. All the computations were performed using the statistical software package R (R Development Core Team 2016), version 2·12·1. The analyses of variance were performed using the R package nlme.
RESULTS
Physical analysis of coffee beans
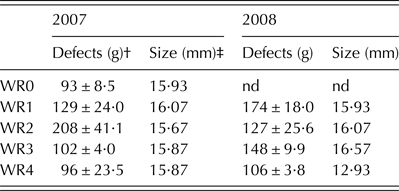
The size distribution and presence of defects on the mature coffee fruits on the different WR was evaluated for two successive harvests (2007 and 2008) (Table 3). In 2007, the WR2 treatment presented the highest level of defects, with a value twice that observed for the other WRs. In 2008, the highest level of defects was observed for WR1. For both years, WR4 showed low defect values. Regarding bean size, the distribution was similar for all WRs in 2007 and for WR1 to WR3 treatments in 2008. In that case, the classification corresponded to medium to large beans (sieve ⩾15). In 2008, the WR4 produced a higher proportion of small beans than other WRs.
Effects of water regime on defects and size distribution of mature beans* of C. arabica L. ‘Rubi’.

nd, not determined.
* Beans were harvested during 2 years (2007 and 2008) from plants cultivated in different WR conditions.
† Defects (in g) were evaluated using 300 g of dry beans.
‡ Bean sizes (in mm) corresponded to the average size of beans retained in sieves. WR0 plants did not produce beans in 2008.
Discrimination of water treatments based on near-infrared fingerprints
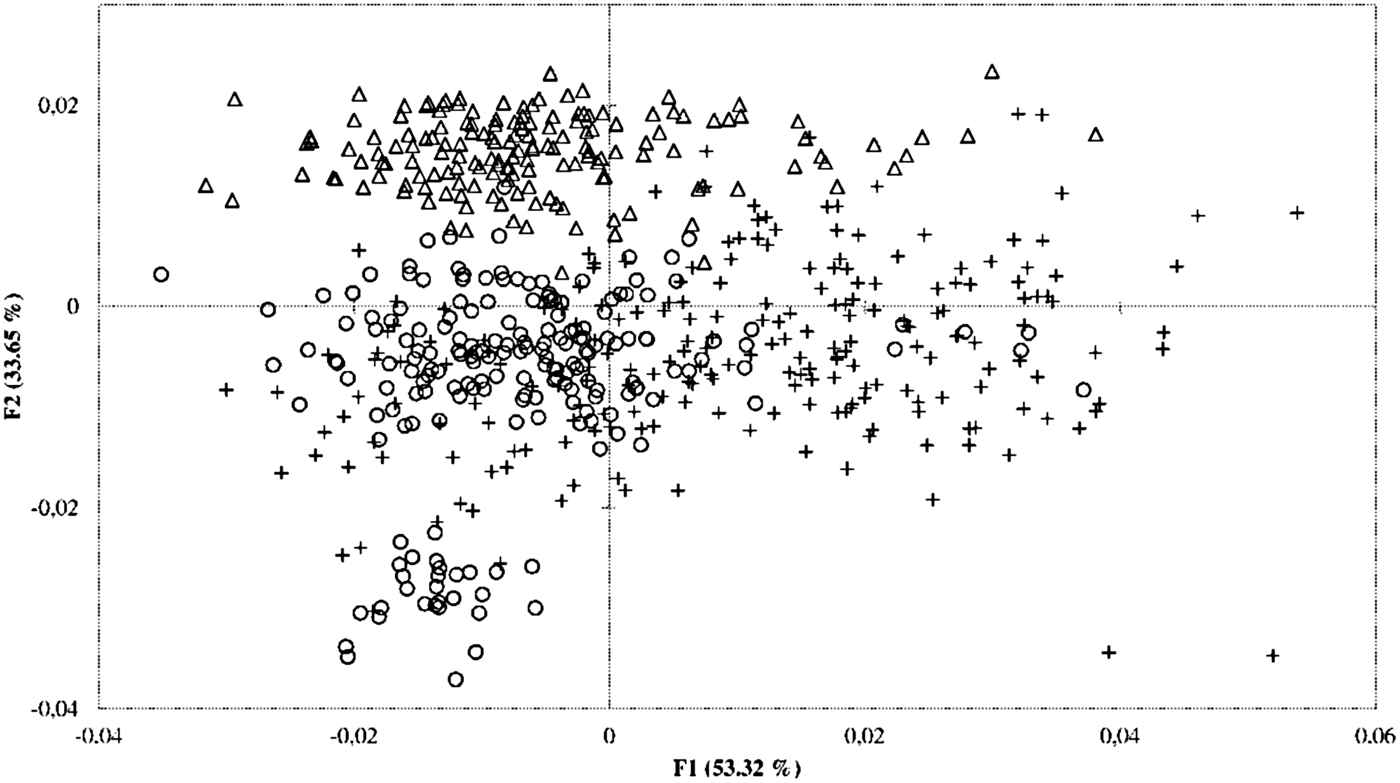
A PCA analysis was done on the spectral matrix, using centred data and variance/covariance matrix as metric. The first three PCs explained 53·32, 33·65 and 3·73%, respectively, of the spectral variability. The scatter plot of sample scores for the first two PCs showed no clustering according to harvest year (Fig. 2). The Mahalanobis distances (H) calculated on the PCs, useful for defining boundaries of a population and as a similarity index between spectra, were all <3; therefore, the H distance limit was fixed to 3. This limit means that the probability that a sample with an H distance >3 belongs to the population is <0·01. The maximum H distance was 2·90 and no outlier was detected. This result confirms the visual approach: no sample was atypical, the NIR fingerprint is representative of the sample and the three harvests were gathered in one spectral population.
Principal Component Analysis (PCA) of coffee beans. Graphic representation on the two first components (axes 1 and 2) of the PCA based on the near-infrared spectrums. Harvest years are represented by open symbols (2007, cross; 2008, triangle and 2009, circle).

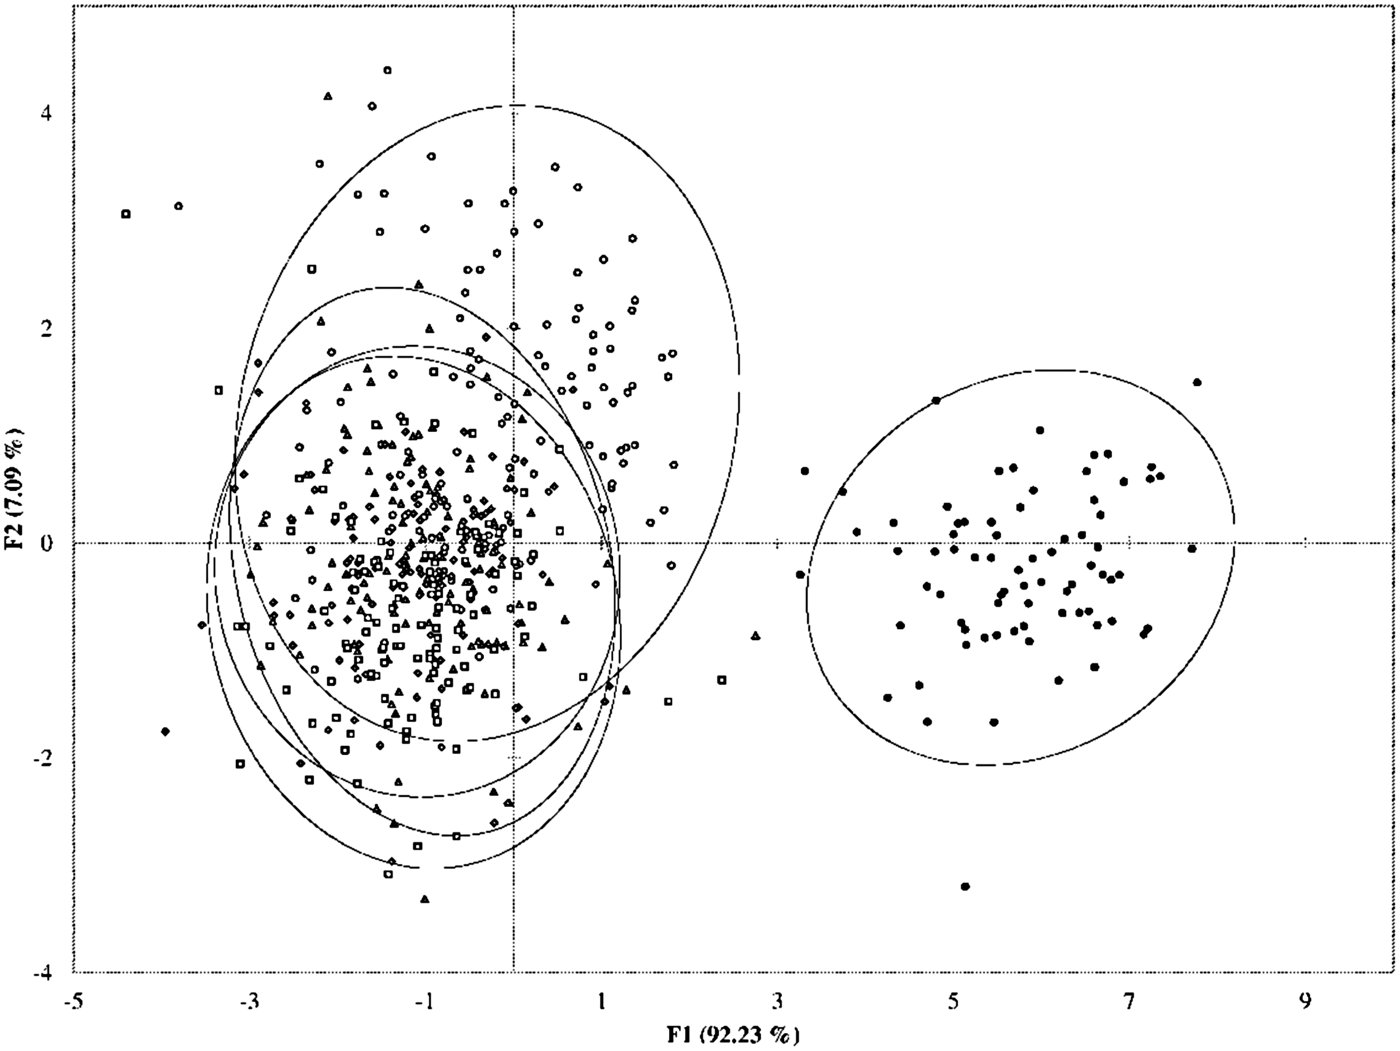
The LDA based on coffee bean spectrum for the five levels of water treatment led to a clear discrimination of samples according to WR treatments. The scatter plot (Fig. 3) of the sample scores for the two discriminant functions, with 95% confidence ellipses, highlights the separation between WR0 samples and the four other WRs. The classification rate was 100% for WR0 samples, while that for WR1 samples was 63%. No discrimination was found between WR2, WR3 and WR4 samples. An LDA done without WR0 samples led to similar results with a slight discrimination of WR1 samples (classification rate around 60%) and no separation of others WRs (data not shown).
Scatter plot of the 3-year-sample scores for the two first discriminant functions. Samples of irrigated treatments are represented by open symbols (water regimes WR1, white circle; WR2, triangle; WR3, lozenge and WR4, square). Samples non-irrigated (WR0) are in black circles and separated from those of other irrigation treatments (95% confidence ellipses).

Effects of water regime on coffee bean biochemical composition
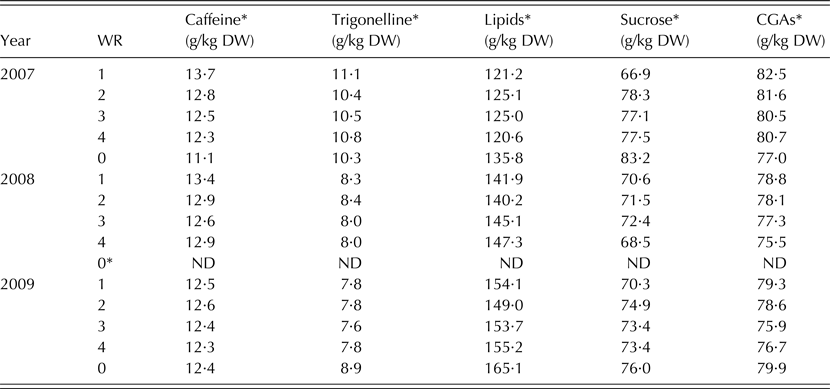
Caffeine, trigonelline, total lipids, sucrose, CGAs and DM bean contents were obtained for the different water regimes (WR0–WR4) in 2007, 2008 and 2009 (Table 4).
Biochemical composition of dry beans of C. arabica L. ‘Rubi’ submitted to different water regimes (WR)

DW, dry weight; CGAs, chlorogenic acids; ND, not determined.
* WR0 plants did not produce beans in 2008.
Caffeine
For the three harvests, the mean caffeine content was close to 12·5 g/kg dry weight (DW), in accordance with caffeine contents commonly observed in beans of C. arabica (Leroy et al. Reference Leroy, Ribeyre, Bertrand, Charmetant, Dufour, Montagnon, Marraccini and Pot2006). No significant differences in caffeine content were observed between beans of WR treatments harvested in 2009, but in 2007 and 2008 these values were significantly different (P < 0·01), ranging from 11·1 to 13·7 g/kg DW and from 12·6 to 13·4 g/kg DW, respectively.
Trigonelline
The mean trigonelline content was similar in beans harvested in 2008 (8 ± 0·2 g/kg DW) and 2009 (8 ± 0·5 g/kg DW), lower than the mean measured in 2007 (11 ± 0·3 g/kg DW). These values matched those commonly observed in Arabica, ranging from 8·8 to 17·7 g/kg DW (Ky et al. Reference Ky, Louarn, Dussert, Guyot, Hamon and Noirot2001).
Lipids
The lipid content varied between years from 126 ± 6·1, 144 ± 3·2 and 155 ± 5·9 g/kg DW in 2007, 2008 and 2009, respectively, values that are close to the lipid content of green Arabica coffee beans (Leroy et al. Reference Leroy, Ribeyre, Bertrand, Charmetant, Dufour, Montagnon, Marraccini and Pot2006).
Sucrose
Over the different years, the sucrose content was similar at 77 ± 5·9, 71 ± 1·6 and 74 ± 1·6 g/kg DW, in 2007, 2008 and 2009, respectively, matching the lowest values of sucrose content found in Arabica (Ky et al. Reference Ky, Louarn, Dussert, Guyot, Hamon and Noirot2001). For the 3 years, the comparison of WR1 to WR4 showed that sucrose content was lower in WR1 beans than in beans of WR2 to WR4. In 2007, WR0 sucrose content was >10% higher (83 ± 2·8 g/kg DW) than the mean value of WR1 to WR4 sucrose contents (75 ± 5·4 g/kg DW). Although limited to a smaller increase (+5%), a similar result was also observed in the beans harvested in 2009.
Chlorogenic acids
During the current experiment, slight differences of CGAs mean values were observed between years, with contents of 81 ± 6·1 g/kg DW in 2007 and similar means (≈78 g/kg DW) in 2008 and 2009. These values were higher than the means of CGAs commonly observed in Arabica beans (Farah & Donangelo Reference Farah and Donangelo2006). For the 3 years, significant (P < 0·05) increases of CGAs contents were observed with increasing irrigation time (from WR4 to WR1) under the dry season. In 2007, bean CGA contents of drought-stressed (WR0) plants were significantly lower (P < 0·001) (≈–7%) than in bean of irrigated plants.
Correlations between traits
Due to the lack of data for the WR0 treatment in 2008, correlations between traits were not considered for this harvest year. Correlations between traits were, however, measured and presented for the beans harvested in 2007 (Table 5). These results showed that the contents of caffeine, trigonelline and CGAs were positively correlated. The same traits were negatively correlated with contents of total lipids and sucrose. However, contents of total lipids and sucrose appeared positively correlated. For the beans harvested in 2009, similar results were also obtained (data not shown).
Correlations between traits calculated for the beans harvested in 2007. All the correlations are significant using Pearson test (data not shown)

CGAs, chlorogenic acids.
Water regimes, year and interactions
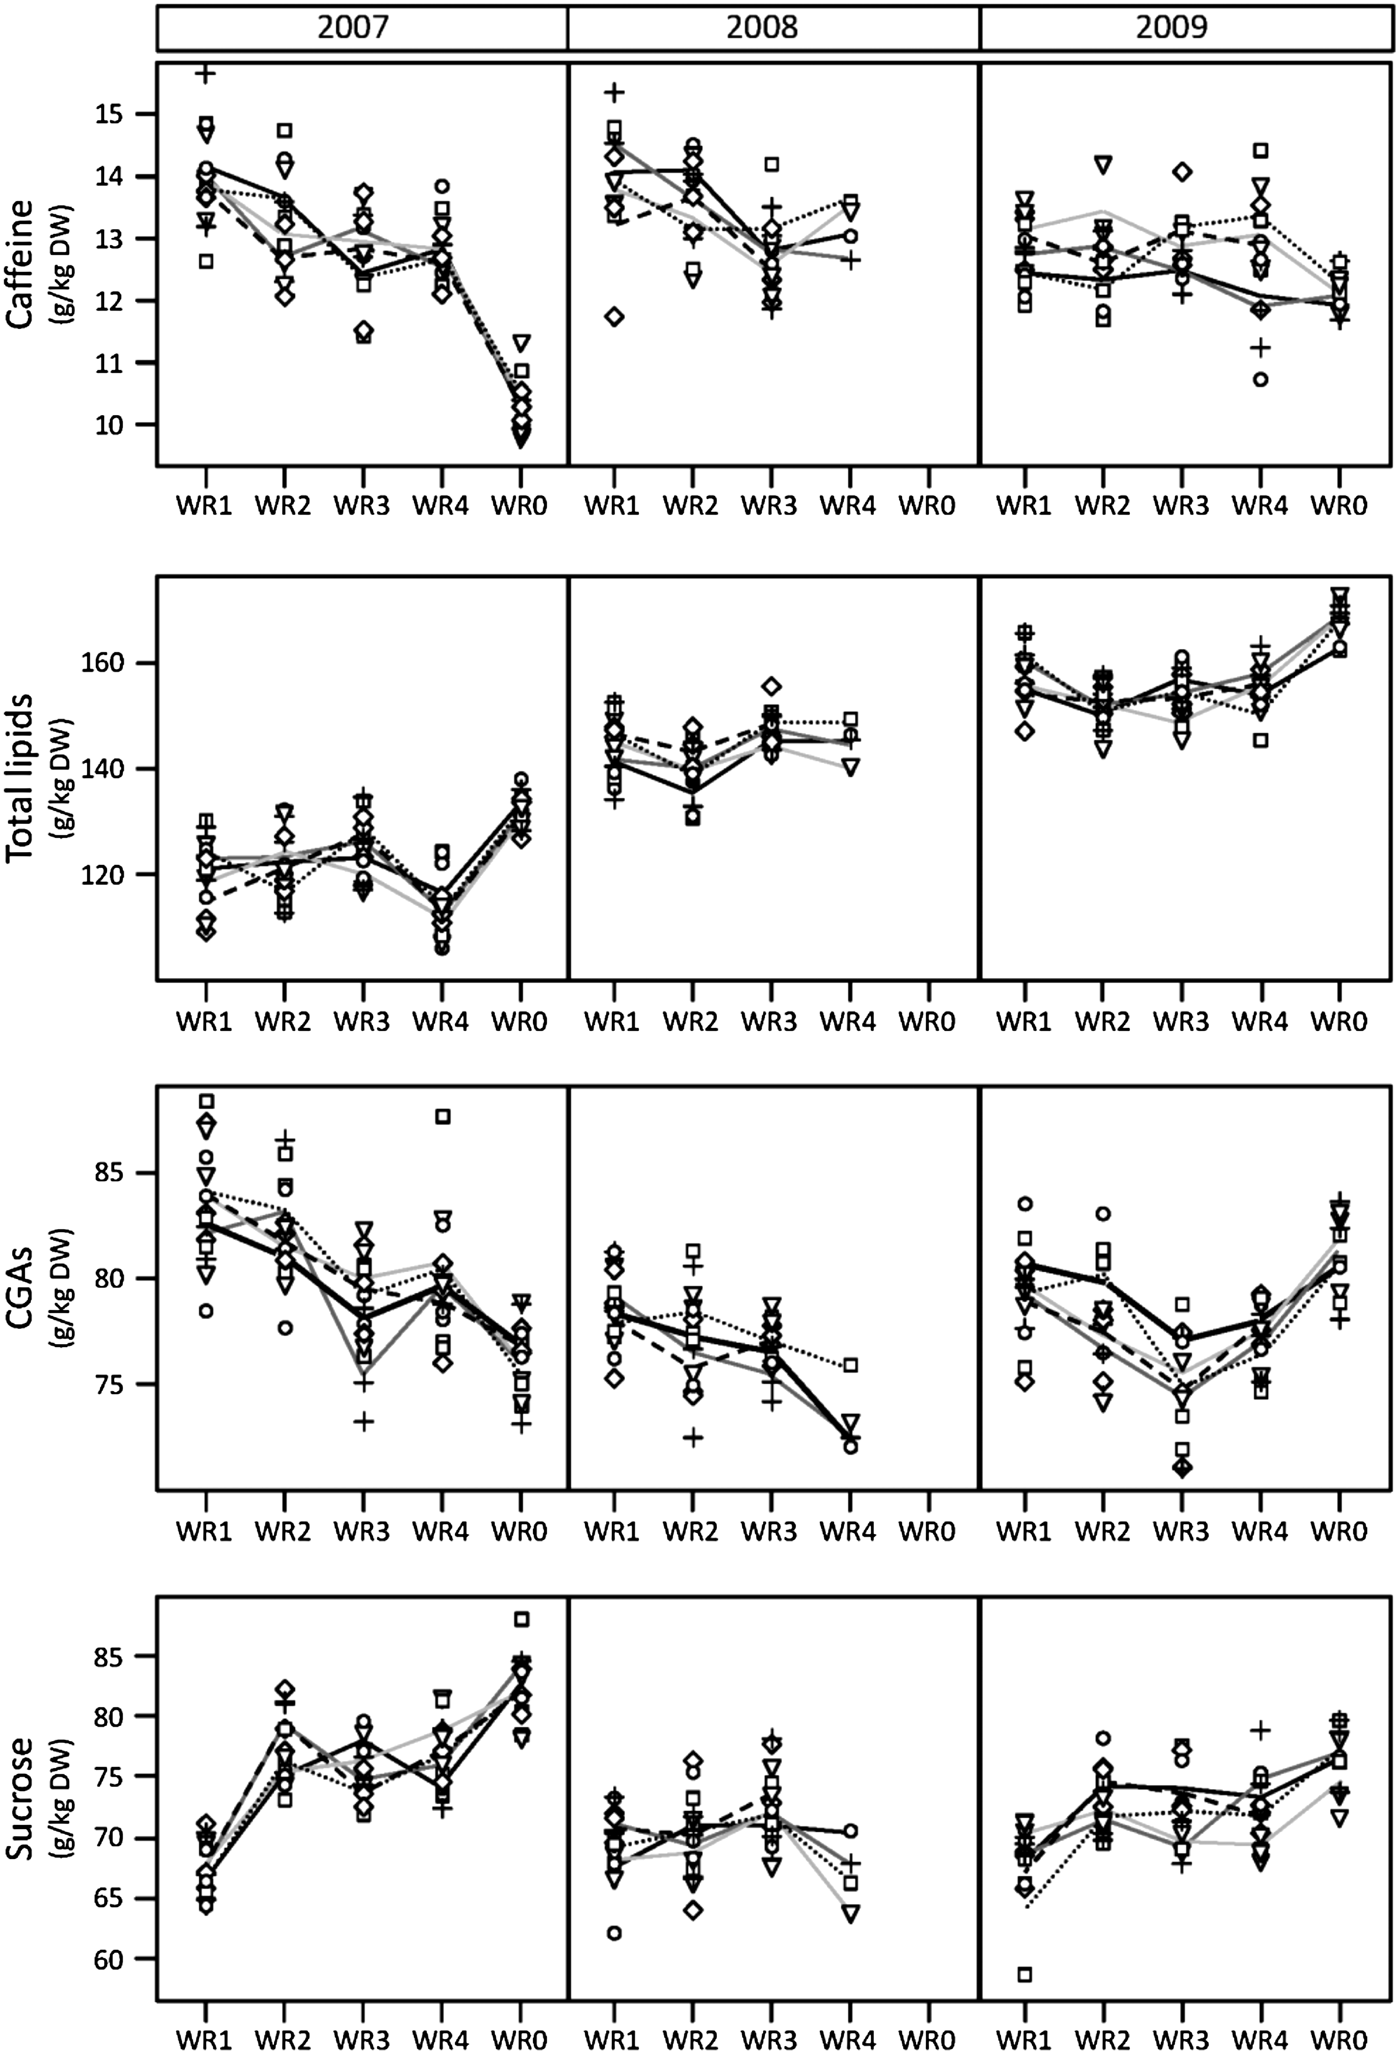
A study was performed to evaluate the effects of WR and year for all biochemical traits. Because P (triple superphosphate) treatments did not affect biochemical composition of the beans significantly (data not shown), the effects of WR are presented for this fertilization treatment only (Fig. 4). For the beans of WR1 to WR4 treatments, caffeine (min–max: 11·3–13·7 g/kg DW), CGAs (min–max: 75·9–82·5 g/kg DW) and sucrose contents (min–max: 66·9–78·3 g/kg DW) were relatively similar for the 3 years of analysis but differed from contents measured in WR0 beans. However, lipid contents were subject to significant (P < 0·01) fluctuations over the 3 years of analysis (means of 125 ± 6·1 g/kg DW in 2007, 144 ± 3·1 g/kg DW in 2008 and 155 ± 5·9 g/kg DW in 2009).
Effects of water regime (WR) on bean biochemical compounds. The biochemical contents of caffeine, total lipids, chlorogenic acids (CGAs) and sucrose obtained by near-infrared reflectance spectroscopy, were measured during three consecutive harvests (2007–2009) in mature beans of C. arabica L. ‘Rubi’ submitted to different WRs. Values are expressed in g/kg dry weight (DW) of mature beans harvested from plants subjected to controlled irrigation (WR1–4) or to water withdrawal (WR0). Due to a severe drought during the winter 2007, WR0 plants did not produce fruits in 2008. Results were obtained for the P treatment: P1 (circles and black line), P2 (crosses and clear grey line), P3 (triangles and dark grey line), P4 (squares and fine dotted line) and P5 (lozenges and large dotted line). Symbols represent observed values and lines represent averages.

In relation to water treatments, an important effect of drought was observed on caffeine and CGAs (in 2007 and 2008), with decreasing contents of these biochemical compounds when increasing the drought period (from WR1 to WR4) during the dry season. An inverse situation was observed for the content of sucrose (in 2007 and 2009), which increased when increasing the duration of drought. For the 3 years, lipid contents were similar in beans of WR1 to WR4.
Water regimes, nitrogen–phosphorous–potassium fertilizers and interactions during the 3-year experiment
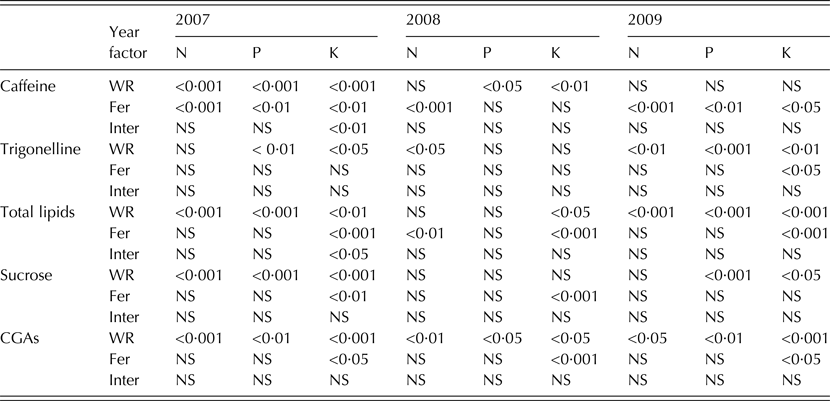
The analysis-of-variance (ANOVA) results for WRs and fertilizer effects for the 3-year experiments are presented in Table 6.
ANOVA for water regimes (WRs) and fertilizer effects using a mixed model. The P values for all the factors analysed are presented. Water regimes and fertilizers (Fer) were used as fixed effects, and block as random effect. Values of interactions (Inter) of fertilizers with WRs are also given

NS, not significant; CGAs, chlorogenic acids.
Independently of fertilizers, CGA contents were most affected by WR in all tests, showing a decrease with drought stress in 2007 and 2008, while the effect was less evident in 2009. Contents of trigonelline and total lipids were also affected by drought over the 3 years of the trial. More specifically, trigonelline contents increased with drought for the P-K treatments in 2007, N treatment in 2008 and NPK treatments in 2009, while lipid contents increased with drought for the NPK treatments in 2007, K treatment in 2008 and NPK treatments in 2009. Sucrose content increased with drought in 2007 and 2009. Caffeine contents were also affected by WR in 2007 and 2008, but not in 2009. Effects of fertilizers and interactions of fertilizers with WR on the bean biochemical compounds are described below.
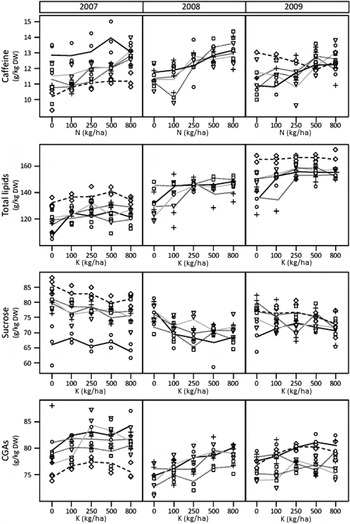
Caffeine was the only compound affected by N treatment for the 3 years of the experiment, increasing by an average of 15% when N fertilization was increased from 0 to 800 kg N/ha (Fig. 5). This effect was observed in beans of irrigated (WR1 to WR4) plants but not in those of plants subjected to the WR0 treatment. Except for caffeine contents and total lipids in 2008 (Table 6), no significant effects of N fertilization were observed on the contents of other biochemical compounds.
Effects of N and K fertilization and water regimes (WRs) on bean biochemical compounds. Caffeine, total lipids, chlorogenic acids (CGAs) and sucrose contents are expressed g/kg dry weight (DW) of mature beans of C. arabica L. ‘Rubi’ harvested from plants subjected to increasing doses of fertilizer. Caffeine contents were analysed with increased doses of N (urea given in kg/ha), while total lipids, CGAs and sucrose contents were analysed with increased doses of KCl (given in kg/ha). Due to a severe drought during the winter 2007, WR0 plants did not produce fruits in 2008. Symbols represent observed values and lines represent averages. WRs: WR1 (circles and black line), WR2 (cross and clear grey line), WR3 (triangle and dark grey line), WR4 (square and fine dotted line) and WR0 (lozenge and large dotted line).

Potassium fertilization was the treatment that most affected caffeine content (2007 and 2009), total lipids (2007–09), sucrose (2007 and 2009) and CGAs (2007–09) (Table 6). For total lipids and CGAs, corresponding contents increased when increasing the amounts of K fertilizer for the 3 years of harvest (Fig. 5). This effect was particularly marked for total lipids under the WR1 treatment, when the K doses increased from 0 (K1) to 100 (K2) kg K2O/ha. However, the lipid contents of WR0 beans were not affected by K fertilization. For CGAs, contents increased slightly with increased amounts of K fertilizer in 2008 and 2009. These contents were relatively stable in 2007, except for WR3 with 250 kg K2O/ha (K3 treatment), which presented a CGA content of ≈84 g/kg DW, 10% higher than that observed for the WR0 (≈77 g/kg DW). Significant effects of K fertilization were also observed on the sucrose content in 2007 (P < 0·001) and 2009 (P < 0·05), with noticeable decreases of sucrose content with increasing amount of K fertilizer (Fig. 5). On the other hand, contents of trigonelline were weakly affected by K fertilization (Table 6).
Except for caffeine in 2009, where contents increased with amount of P fertilization, no significant effects of this fertilizer were observed on other biochemical compounds during the 3 years of the field trial (data not shown).
DISCUSSION
The vegetative growth of coffee is seasonal (DaMatta et al. Reference DaMatta, Ronchi, Maestri and Barros2007). In the climatic conditions of the Brazilian-Cerrado region, the quiescent phase of coffee development corresponds to a reduced vegetative growth of coffee plants (Barros et al. Reference Barros, da, Mota, Da Matta and Maestri1997) that occurs during the dry season that commonly falls after the harvest (around April–May) and before the next flowering (around September). Afterwards, the gradual return of rainfall marks the beginning of the reproductive and vegetative phases that continue up to harvest. In the present study, it is important to highlight that: (1) WR0 plants were cultivated without supplemental water supply and were therefore subjected to natural fluctuation of rainfall and that (2) differential irrigation was applied to the plants of WR1 to WR4 during the dry season. For WR1 to WR4 trials, regular irrigation was performed equally to prevent drought stress during the reproductive and vegetative phases. In these cases, fruits of WR1 to WR4 plants did not suffer water withdrawal during their development and no competition occurred between vegetative growth and fruit development. Even restricted to 2 years of analysis, the results presented here showed that the bean size was identical for all WRs in 2007 and for WR1 to WR3 in 2008, suggesting a limited effect of irrigation on coffee bean size. However, significant differences regarding defects were observed, the WR4 beans having low degree of defects in both years. The controlled irrigation applied during the quiescent phase modified the biochemical composition of coffee fruits significantly. Caffeine and CGAs decreased with increasing length of drought period, while lipid and sucrose contents increased. Coffee plants are susceptible to low positive temperatures, which affect photosynthetic performance (Ramalho et al. Reference Ramalho, Quartin, Leitão, Campos, Carelli, Fahl and Nunes2003) and could affect coffee quality. In the present study, all plants were grown under the same field and climatic conditions, demonstrating that the modified biochemical contents were related to WR conditions.
Several studies have analysed the effects of drought period on coffee plant physiology. The reductions of branch growth rate and leaf area are the most visible responses characterizing the quiescent phase (DaMatta et al. Reference DaMatta, Amaral and Rena1999). These declines are probably due to direct effects of low temperature, or indirect effects via the negative impact on photosynthesis, assimilate storage and partitioning, respiration, leaf nitrogen assimilation and hormonal balance (DaMatta et al. Reference DaMatta, Ronchi, Maestri and Barros2007). Concerning above-ground biomass, chlorophyll content is changed, the net carbon assimilation (A) is reduced and starch accumulates in leaves, suggesting that carbon supply exceeds carbon export (Silva et al. Reference Silva, DaMatta, Ducatti, Regazzi and Barros2004). In addition, irrigation during the dry season is known to reduce leaf shedding but did not affect branch growth (DaMatta et al. Reference DaMatta, Ronchi, Maestri and Barros2007). Due to the difficulties of studying coffee plants in field conditions, data concerning seasonal effects on root system development are rare. However, DaMatta et al. (Reference DaMatta, Amaral and Rena1999) showed that N fertilization during the quiescent phase of C. arabica greatly stimulated the accumulation of nitrate, amino acids and ammonium in roots. This was attributed to the maintenance of nitrate reductase activity during the winter season. In C. arabica, root growth (mainly of small feeder roots) was also reported to occur during the dry seasons and could be responsible for the assimilate movements observed towards the trunk–root system when shoot growth was depressed (Cannell & Huxley Reference Cannell and Huxley1969). The capacity to allow root growth, as well as a deep and extended root system under rain-fed field conditions, was proposed to be one of the main characteristics of drought tolerance in coffee (Praxedes et al. Reference Praxedes, DaMatta, Loureiro, Ferrão and Cordeiro2006). Altogether, these observations support the idea that root activity and development under limited water supply could determine part of the contents of photo-assimilates (e.g. carbohydrates such as starch), firstly accumulated in branches and leaves of coffee plants and secondly mobilized to furnish the energy necessary for the concomitant phases of growth resumption and reproduction (bean development). In this way, the amount of stored photo-assimilates should determine part of the final biochemical characteristics of coffee beans.
In the present work, the differences observed between the WR1 to WR4 treatments clearly indicate that WR applied during the quiescent phase of year n played an important role in the final biochemical composition of beans harvested in year n + 1. In coffee, the expansion and maturation of fruits during the vegetative phase requires remobilization of assimilates accumulated in leaves during the quiescent phase (DaMatta et al. Reference DaMatta, Amaral and Rena1999). Since plants of WR1 and WR4 treatments were grown with controlled irrigation to avoid water deficiency during the whole period of fruit development, the differences in biochemical contents observed during the present study between the beans of WR1 and WR4 were not due to sporadic drought stress. However, such events may explain the significant differences of biochemical contents observed between the beans of WR0 and WR4.
Cell-wall polysaccharides (480–600 g/kg DM), lipids (130–170 g/kg DM), proteins (110–150 g/kg DM), sucrose (70–110 g/kg DM) and CGAs (50–80 g/kg DM) are the main biochemical compounds stored in mature beans (Leroy et al. Reference Leroy, Ribeyre, Bertrand, Charmetant, Dufour, Montagnon, Marraccini and Pot2006). Each of these storage compounds plays a crucial role in the complex chemistry of roasting (Ribeiro et al. Reference Ribeiro, Augusto, Salva, Thomaziello and Ferreira2009). For example, total lipids, proteins and amino acids are essential precursors of aroma formed by the Maillard reactions. High CGAs and trigonelline are supposed to be responsible for bitterness and astringency of the coffee beverage. However, caffeine has never been clearly related to coffee cup quality (Leroy et al. Reference Leroy, Ribeyre, Bertrand, Charmetant, Dufour, Montagnon, Marraccini and Pot2006). On the other hand, sucrose is an important precursor of coffee flavour and beverage quality (Leroy et al. Reference Leroy, De Bellis, Legnate, Kananura, Gonzales, Pereira, Andrade, Charmetant, Montagnon, Cubry, Marraccini, Pot and De Kochko2011).
The current results showed that irrigation during the dry season and the absence of controlled irrigation during the reproductive phase (comparison of WR0 with other WRs) modified the final biochemical composition of fruits. It was demonstrated that the contents of CGAs, caffeine and sucrose increased under WR0. Comparison of WR1 to WR4 trials also revealed that the contents of caffeine and CGAs clearly increased with decreasing length of irrigation suspension during the dry season. For CGAs, this was verified during three consecutive years. An inverse situation was observed for lipids and sucrose, with contents that tended to increase with the duration of the drought period. In that case, it is worth noting that no negative correlation between sucrose and lipid content was observed in the beans of C. arabica ‘Rubi’ analysed during the present study. This contrasts with the results observed for cultivar Costa Rica 95 of C. arabica (Decazy et al. Reference Decazy, Avelino, Guyot, Perriot, Pineda and Cilas2003; Avelino et al. Reference Avelino, Barboza, Araya, Fonseca, Davrieux, Guyot and Cilas2005; Vaast et al. Reference Vaast, Bertrand, Perriot, Guyot and Génard2006), which reported a negative relationship between fat and sucrose contents. This could be mainly explained by the differences of: (1) climatic conditions existing between Central America, where drought is limited, and Brazil, and (2) modes of coffee cultivation, under shade in agroforestry systems in Central America and full-sun conditions that correspond to the main mode of Brazilian coffee cultivation. These differences could also be due to the nature of the cultivars, Rubi (the present study) being considered as a ‘pure’ cultivar of C. arabica in the sense that it has not received a recent introgression of C. canephora genomic DNA (Carvalho et al. Reference Carvalho, Fazuoli, Carvalho, Guerreiro-Filho, Pereira, De Almeida, Matiello, Bartholo, Sera, Moura, Mendes, De Rezende, Da Fonseca, Ferrão, Ferrão, Nacif, Silvarolla, Braghini and Carvalho2008), while the Costa Rica 95 corresponds to a catimor cultivar containing an introgressed genome of C. canephora carried by the use of the Timor hybrid during its selection process.
Regarding the effects of fertilization, the present study clearly highlighted the significant increase of caffeine content positively correlated to the amount of N fertilization. Potassium fertilization was positively correlated with increases in CGAs and lipids, and also with the decrease of sucrose. However, a very limited impact of P fertilization on the biochemical compounds analysed was observed.
Independently of fertilization, the absence of controlled irrigation during the development of coffee beans (e.g. WR0 treatment) is clearly inappropriate for the coffee culture under the climate of the Brazilian Cerrado region. Considering that controlled drought stress followed by irrigation is the recommended method to synchronize coffee flowering in Brazilian savannas (Guerra et al. Reference Guerra, Rocha, Rodrigues, Sanzonowicz, Ribeiro Filho, Mera and Cordeiro2008), it is tempting to make predictions regarding the results presented in the present paper in relation to water and fertilizer management. By decreasing caffeine and CGA contents and increasing lipid and sucrose contents, a controlled drought stress during the dry season alters coffee quality positively. In contrast, beans produced from plants grown under continuous irrigation during the dry season (e.g. WR1 treatment) presented higher amounts of caffeine, CGAs and lower contents of lipids and sucrose. Even if beverage quality was not directly tested during the current work, it is known that beans harvested from coffee subjected to water suspension during the dry season lead to a better quality beverage compared with beans produced from plants that are irrigated constantly (Silva et al. Reference Silva, Mazzafera, Brunini, Sakai, Arruda, Mattoso, Carvalho and Pires2005). This improvement of quality can be explained by the improved uniformity of cherries harvested under WR3 and WR4 conditions (G.C. Rodrigues, personal communication). Considering WR4 as the best management model for coffee culture in the climatic conditions of the Cerrado region, P fertilization should be optimized to fit with plant requirements and production. Care should be taken to use controlled doses of N and K fertilization, in order to limit the increase of caffeine bean contents.
The authors acknowledge financial supports from the FINEP (Qualicafé, Brazil), the CIRAD (Centre de Coopération Internationale en Recherche Agronomique pour le Développement, Montpellier, France), the Brazilian Coffee R&D Consortium, and INCT-Café (National Institutes of Science and Technology Program-CNPq/FAPEMIG) (Brazil). The authors would also like to thank all the technicians of the Embrapa Cerrados for their precious help and assistance during the field trial experiments, harvest and post-harvest treatments of coffee fruits.