1. Introduction
Richtmyer–Meshkov instability (RMI) (Richtmyer Reference Richtmyer1960; Meshkov Reference Meshkov1969) plays a crucial role across a wide range of high-speed flow phenomena and applications, particularly in inertial confinement fusion (ICF) (Zhou et al. Reference Zhou, Sadler and Hurricane2025). Under realistic ICF conditions, the interface is subject to inherently random broadband perturbations owing to limitations in target fabrication. As a consequence, the dimensionless initial amplitude
 $ka_0$
(with
 $k$
the perturbation wavenumber, and
 $a_0$
the initial amplitude) typically spans a broad spectrum in such environments. The RMI in the low-
 $ka_0$
regime has been relatively well understood and can be satisfactorily described within the framework of existing linear and nonlinear theories (Zhou Reference Zhou2017a
,Reference Zhou
b
, Reference Zhou2024; Zhou et al. Reference Zhou2019, Reference Zhou2021). However, when
 $ka_0$
violates the low-
 $ka_0$
criterion (
 $ka_0\ll 1$
), additional physical mechanisms – such as initial nonlinearity (i.e. interface geometry) (Velikovich & Dimonte Reference Velikovich and Dimonte1996), shock proximity (Dimonte et al. Reference Dimonte, Frerking, Schneider and Remington1996), secondary compression (McFarland et al. Reference McFarland, Greenough and Ranjan2013) and vorticity deposition (Wang & Luo Reference Wang and Luo2026) – may emerge, causing the evolution law to deviate from that observed in the low-
 $ka_0$
regime, and leading to the breakdown of conventional theories. Therefore, investigating the initial-amplitude dependence of RMI is of fundamental importance.
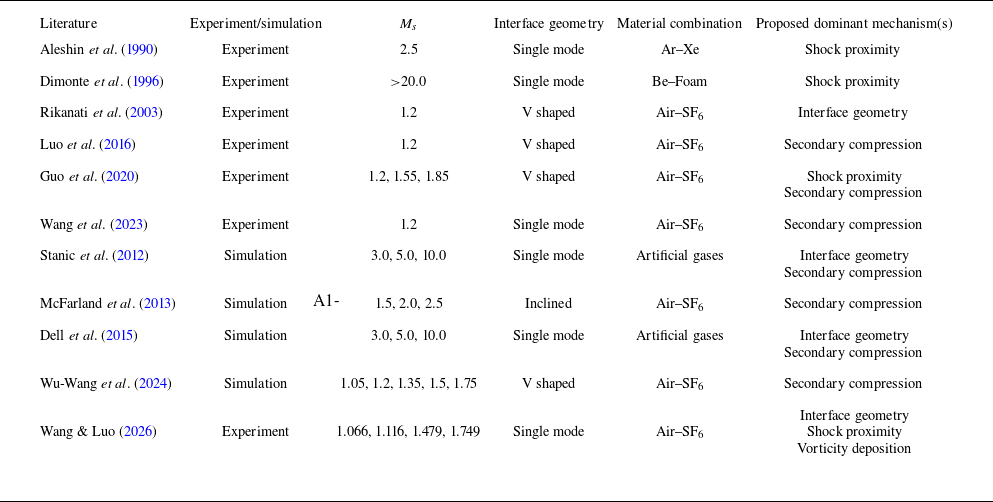
Considerable efforts have been devoted to elucidating this issue (Aleshin et al. Reference Aleshin, Lazareva, Zaitsev, Rozanov, Gamalii and Lebo1990; Dimonte et al. Reference Dimonte, Frerking, Schneider and Remington1996; Rikanati et al. Reference Rikanati, Oron, Sadot and Shvarts2003; Stanic et al. Reference Stanic, Stellingwerf, Cassibry and Abarzhi2012; McFarland et al. Reference McFarland, Greenough and Ranjan2013; Dell et al. Reference Dell, Stellingwerf and Abarzhi2015; Luo et al. Reference Luo, Dong, Si and Zhai2016; Guo et al. Reference Guo, Zhai, Ding, Si and Luo2020; Wang et al. Reference Wang, Wang, Zhai and Luo2023; Wu-Wang et al. Reference Wu-Wang, Liu and Xiao2024; Wang & Luo Reference Wang and Luo2026), most of which focused on the initial-amplitude effect on linear growth, i.e. the deviation of the practical linear growth rate from the linear-theory prediction as
 $ka_0$
departs from the low-
 $ka_0$
criterion. As summarised in table 1, early studies have proposed three primary mechanisms as potential explanations for this effect: interface geometry (i.e. geometric effect arising from the deviation of initial interface from low-
 $ka_0$
criterion), shock proximity (i.e. suppressive effect of transmitted shock on the evolution of the nearby interface structure), and secondary compression (i.e. influence of high pressure resulting from transverse-wave interactions on the interface evolution). A recent experimental study (Wang & Luo Reference Wang and Luo2026) has carefully examined these mechanisms, suggesting that secondary compression does not influence the linear evolution, whereas interface geometry and shock proximity play different roles. Moreover, a previously unrecognised mechanism, termed ‘vorticity deposition’, has been identified.
Summary of the research approach (experiment/simulation), shock Mach number
 $M_s$
, interface geometry, material combination, and proposed dominant mechanism(s) for the initial-amplitude effect in previous literature.

Table 1. Long description
Table with multiple columns and rows summarizing different studies. Columns include research approach, shock Mach number, interface geometry, material combination, and proposed dominant mechanism. Each row represents a different study, listing the specific details for each column.
Only a limited number of studies have examined the nonlinear evolution over a range of
 $ka_0$
values (Zhou Reference Zhou2017a
, Reference Zhou2024; Zhou et al. Reference Zhou2021). Guo et al. (Reference Guo, Zhai, Ding, Si and Luo2020) considered V-shaped interfaces with different
 $ka_0$
(0.277 and 0.907) and shock waves of various Mach numbers (
 $M_s \approx 1.20, 1.55, 1.85$
), and reported that the dimensionless nonlinear amplitude evolution exhibits a high degree of similarity across these cases. Furthermore, the SEA model (Sadot et al. Reference Sadot, Erez, Alon, Oron, Levin, Erez, Ben-Dor and Shvarts1998) and DR model (Dimonte & Ramaprabhu Reference Dimonte and Ramaprabhu2010) were shown to reasonably predict the overall amplitude evolution. Wang et al. (Reference Wang, Wang, Zhai and Luo2023) investigated RMI on single-mode interfaces at
 $M_s \approx 1.20$
, considering
 $ka_0$
ranging from 0.31 to 2.83, and found that the dimensionless amplitude evolution of the overall interface, as well as that of the bubble/spike, is highly similar across cases with diverse
 $ka_0$
, and can be reasonably predicted by the ZG model (Zhang & Guo Reference Zhang and Guo2016). Overall, existing studies suggest that the dimensionless nonlinear amplitude evolution under diverse
 $ka_0$
conditions exhibits a surprisingly high degree of similarity.
Notably, in practical scenarios such as ICF and supernova explosions, RMI is typically triggered by strong shock waves. Under strong-shock conditions, the flow compressibility becomes significant (Zhou Reference Zhou2024; Si et al. Reference Si, Jiang, Cai, Wang and Luo2025), which can lead to interface dynamics and amplitude evolution law to deviate from those observed in the weak-shock regime. However, most of the existing experimental studies on the initial-amplitude dependence of RMI were conducted in the weak-shock regime (
 $M_s \leqslant 2.0$
), with only two known exceptions reported by Aleshin et al. (Reference Aleshin, Lazareva, Zaitsev, Rozanov, Gamalii and Lebo1990) and Dimonte et al. (Reference Dimonte, Frerking, Schneider and Remington1996). The laser-driven experimental approach employed by Dimonte et al. (Reference Dimonte, Frerking, Schneider and Remington1996) typically introduces additional physicochemical processes such as material phase transition and rarefaction-wave-induced decompression, thereby complicating the isolation of the RMI contribution to perturbation growth. In contrast, the shock-tube experimental approach utilised by Aleshin et al. (Reference Aleshin, Lazareva, Zaitsev, Rozanov, Gamalii and Lebo1990) offers a more controlled and physically simpler environment for exploring the RMI dynamics. However, Aleshin et al. (Reference Aleshin, Lazareva, Zaitsev, Rozanov, Gamalii and Lebo1990) produced the initial interfaces by imposing a solid membrane on a support structure, and both the support structure and membrane remnants can significantly affect the perturbation evolution. Therefore, to date, desirable experimental research on the initial-amplitude dependence of strong-shock-driven RMI remains lacking. Consequently, several key questions remain unresolved. Does the initial-amplitude dependence under strong-shock conditions differ from that in the weak-shock regime? If so, what are the underlying physical mechanisms? Can existing models accurately describe the evolution across a wide range of
 $ka_0$
under highly compressible conditions? These open questions motivate the present study.
In a recent study (Jiang et al. Reference Jiang, Cai, Xie, He, Wang, Si and Luo2024), a shock-tube facility capable of producing shock waves with
 $M_s \gt 3.0$
while maintaining a ‘clean’ flow environment was developed. Furthermore, a novel technique that enables the controlled generation of support-free interfaces was proposed. These advancements provide a rare opportunity to explore the initial-amplitude dependence of RMI under strong-shock conditions. In the present study, five experimental runs with
 $ka_0$
spanning a wide range are conducted under otherwise identical conditions to elucidate this dependence. The morphological evolution is first examined, followed by a quantitative analysis of the amplitude growth through direct comparison with weak-shock experiments (Wang et al. Reference Wang, Wang, Zhai and Luo2023; Wang & Luo Reference Wang and Luo2026). It is important to emphasise that although the shock intensities considered in the present study are higher than those in most previous shock-tube experiments (with
 $M_s$
typically below 2.0), they remain significantly lower than those encountered in ICF and astrophysical environments (with
 $M_s$
often well above 10). Therefore, the present work does not aim to serve as a direct experimental analogue of ICF or astrophysical flows, but rather seeks to provide, from a fluid-dynamics perspective, insights that may be relevant to such high-energy-density systems.
2. Experimental methods and set-up
The experimental investigation of RMI involves three fundamental elements: the shock wave, the initial interface, and the flow diagnostics. The controlled generation of both the shock wave and the initial interface is critical, as RMI is highly sensitive to initial conditions (Ranjan et al. Reference Ranjan, Oakley and Bonazza2011; Zhou Reference Zhou2017a ,Reference Zhou b , Reference Zhou2024; Mohaghar et al. Reference Mohaghar, Carter, Pathikonda and Ranjan2019; Zhou et al. 2019, Reference Zhou2021; Dimonte et al. Reference Dimonte, Nagori, Ramaprabhu and Boureima2024), while diagnostic techniques determine the extent to which the targeted experimental information can be accurately captured (Collins & Jacobs Reference Collins and Jacobs2002; Jacobs & Krivets Reference Jacobs and Krivets2005; Mohaghar et al. Reference Mohaghar, Carter, Musci, Reilly, McFarland and Ranjan2017).
Sketches of (a) the shock-tube facility, (b) the interface-formation technique, and (c) the shadowgraph imaging method.

To achieve the controlled generation of a strong shock wave with a ‘clean’ post-shock flow, a recently developed shock-tube facility (Jiang et al. Reference Jiang, Cai, Xie, He, Wang, Si and Luo2024), as sketched in figure 1(a), is employed. The underlying principle of this facility in generating a strong shock is to enhance the intensity of the shock wave by reducing its cross-sectional area (Chester Reference Chester1954; Chisnell Reference Chisnell1957; Whitham Reference Whitham1957). The reduction in the shock cross-sectional area is achieved through a convergence section specifically designed based on the shock dynamics theory (Han & Yin Reference Han and Yin1993; Zhai et al. Reference Zhai, Liu, Qin, Yang and Luo2010; Zhan et al. Reference Zhan, Li, Yang, Zhu and Yang2018), which enables a smooth shock convergence while minimising post-shock perturbations. During convergence, the cross-sectional area of the shock wave decreases from 120 mm
 $\times$
262 mm to 120 mm
 $\times$
8 mm, resulting in an increase in
 $M_s$
from approximately 2.0 to exceeding 3.0. To generate discontinuous interfaces with minimal influence on the flow evolution, the polyester-film technique developed specifically for strong-shock experiments (Jiang et al. Reference Jiang, Cai, Xie, He, Wang, Si and Luo2024) is employed. As illustrated in figure 1(b), the low height of the experimental flow field (8 mm) ensures effective confinement of the polyester film by the upper and lower boundaries, thus eliminating the need for support structures. Moreover, it has been verified that the polyester film has negligible influence on the flow evolution and visualisation (Cai et al. Reference Cai, Jiang, Wang, Wang, Ma and Si2025; Jiang et al. Reference Jiang, Wang, Ma, Wang, Si and Luo2025). To ensure the effective capture of the shock wave and interface morphology in the presence of strong pressure perturbations near the interface, the shadowgraph imaging method, as illustrated in figure 1(c), is employed for flow diagnostics. The camera (Phantom V2012) operates at frame rate 100 000 frames per second with exposure time 1 μs, yielding spatial resolution approximately 0.57 mm pixel−1. Further details of the experimental methodology can be found in our previous studies (Jiang et al. Reference Jiang, Cai, Xie, He, Wang, Si and Luo2024; Si et al. Reference Si, Jiang, Cai, Wang and Luo2025).
Five experiments on the strong-shock-driven RMI at single-mode air–SF
 $_6$
interfaces with the same wavelength (40 mm) but different
 $a_0$
(2, 4, 8, 12, 16 mm), with
 $ka_0$
values 0.31, 0.63, 1.26, 1.89, 2.51, respectively, are performed. Notably, the case with
 $ka_0 = f$
is hereafter denoted as case
 $f$
for clarity, and the results of case 0.31, which serves as a reference case for the low-
 $ka_0$
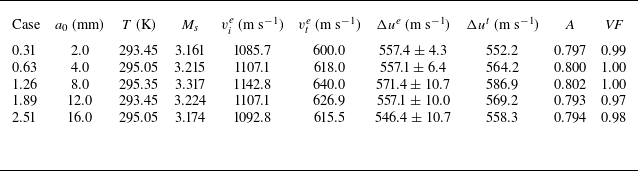
scenario, were reported in our previous work (Si et al. Reference Si, Jiang, Cai, Wang and Luo2025). The key parameters of the five experiments are summarised in table 2, in which
 $M_s = 3.239 \pm 0.078$
. Notably, the measurement uncertainties of shock and interface velocities, gas composition and perturbation amplitude are comparable to those reported in our recent studies (Cai et al. Reference Cai, Jiang, Wang, Wang, Ma and Si2025; Jiang et al. Reference Jiang, Wang, Ma, Wang, Si and Luo2025), which remain sufficiently small and do not affect the reliability of the experimental data and the subsequent analysis. Furthermore, as previously reported (Si et al. Reference Si, Jiang, Cai, Wang and Luo2025), the maximum thickness of the boundary layer in the interface region remains significantly smaller than the characteristic length scales of the experimental flow field. Consequently, the influence of the boundary layer on the interface evolution is negligible.
Significant parameters for five experimental runs with various
 $ka_0$
, with superscripts ‘
 $e$
’ and ‘
 $t$
’ denoting experimental and theoretical results, respectively. Here,
 $T$
is ambient temperature,
 $v_i$
and
 $v_t$
are velocities of incident and transmitted shocks, respectively,
 $\Delta u$
is interface jump velocity,
 $A$
is post-shock Atwood number, defined as
 $(\rho _d - \rho _u)/(\rho _d + \rho _u)$
(in which
 $\rho _u$
and
 $\rho _d$
denote the post-shock densities of the fluids upstream and downstream of the interface, respectively), and
 $ \textit{VF}$
is volume fraction of
 $\mathrm{SF_6}$
downstream of the initial interface.

Table 2. Long description
A table with five rows and eight columns. The columns are labeled Literature, Experiment/simulation, M, Interface geometry, Material combination, and Proposed dominant mechanism(s). The rows list different studies and their parameters. Row 1: Literature, Aleshin et al. (1990); Experiment/simulation, Experiment; M, 2.5; Interface geometry, Single mode; Material combination, Ar-Xe; Proposed dominant mechanism(s), Shock proximity. Row 2: Literature, Dimonte et al. (1996); Experiment/simulation, Experiment; M, >20.0; Interface geometry, Single mode; Material combination, Be-Foam; Proposed dominant mechanism(s), Shock proximity. Row 3: Literature, Rikanati et al. (2003); Experiment/simulation, Experiment; M, 1.2; Interface geometry, V shaped; Material combination, Air-SF6; Proposed dominant mechanism(s), Interface geometry. Row 4: Literature, Luo et al. (2016); Experiment/simulation, Experiment; M, 1.2; Interface geometry, V shaped; Material combination, Air-SF6; Proposed dominant mechanism(s), Secondary compression. Row 5: Literature, Guo et al. (2020); Experiment/simulation, Experiment; M, 1.2, 1.55, 1.85; Interface geometry, V shaped; Material combination, Air-SF6; Proposed dominant mechanism(s), Shock proximity, Secondary compression.
3. Flow evolution features
Figure 2 presents the shadowgraphs of the five experimental cases. To illustrate the overall flow evolution process, case 0.31 is taken as a representative example. When the incident shock interacts with the initial interface, a transmitted shock and a reflected shock are produced (42 μs). The transmitted shock remains in close proximity to the shocked interface throughout the subsequent evolution. Besides, the reflected shock also propagates downstream because the Mach number of the upstream flow (up to 1.4) exceeds that of the reflected shock (1.3). These observations are consistent with the theoretical analysis of Mikaelian (Reference Mikaelian1994, Reference Mikaelian2016). Following the shock–interface interaction, the shocked interface becomes increasingly asymmetric (42–102 μs), with the bubble (spike) progressively flattening (sharpening). The disturbed transmitted shock evolves into a Mach-reflection structure featuring transverse shocks and slip lines (172 μs). The transverse shocks sweep across the interface and interact with each other near the bubble tip, generating a high-pressure region that pushes the bubble upstream, which leads to the further flattening of the bubble. Additionally, a downstream-directed jet, originating from the slip lines, appears (172 μs), which is a hallmark of strong Mach reflection (Henderson et al. Reference Henderson, Vasilev, Ben-Dor and Elperin2003). In the late stages (332 μs), under the sustained action of pressure perturbations, the bubble becomes slightly concave. Furthermore, vortices form at the spike tip.
Experimental shadowgraphs of five experiments with diverse
 $ka_0$
. Numbers in the images represent time in
 $\unicode{x03BC}$
s.

For case 0.63, the spike grows more rapidly than that in case 0.31, with its head evolving into a distinct mushroom-shaped structure during the mid-to-late stages (172–312 μs). Apart from the differences in the vorticity deposited during the shock–interface interaction, this phenomenon should also be attributed to the stronger perturbation imposed by the initial interface on the transmitted shock, which results in a stronger Mach reflection and a correspondingly higher pressure in the region behind the Mach stem. This high-pressure region is located near the spike root, thereby significantly promoting the spike growth. Moreover, under the influence of the stronger transverse shocks resulting from stronger Mach reflection, the bubble exhibits greater distortion than that in case 0.31, with its front exhibiting a single-mode-like perturbation that gradually amplifies in the late stages (242–312 μs). For cases with
 $ka_0 \gt 1.0$
, the detailed flow structures between the transmitted shock and the shocked interface become obscured owing to the strong pressure perturbations. Nevertheless, the convex transmitted shock front near the spike root indicates the presence of a strong Mach reflection (Henderson et al. Reference Henderson, Vasilev, Ben-Dor and Elperin2003). Compared with case 0.63, the spike evolves more rapidly, and the secondary vortices rapidly emerge along the spike stem. Moreover, as the primary and secondary vortices evolve, the fluid mixing on either side of the spike stem is markedly enhanced. Consequently, the spike stem appears progressively blurred in the shadowgraph images.
A comparison with experiments at
 $M_s = 1.066$
(Wang & Luo Reference Wang and Luo2026), which represent quasi-incompressible scenarios with the dominant mechanism being the interface geometry, reveals that flow compressibility significantly promotes spike growth while suppressing bubble evolution under strong-shock conditions. Furthermore, a comparison with experiments with
 $M_s$
ranging from 1.116 to 1.749 (Wang & Luo Reference Wang and Luo2026) reveals an interesting phenomenon: the cavity structure at the spike tip, previously observed under weak-shock and relatively high-
 $ka_0$
conditions, is absent in the present experiments. This cavity arises from the vorticity deposited by the slip line, which induces a downstream-directed velocity at the spike tip, and its absence in the present experiments indicates that the vorticity-deposition mechanism (Wang & Luo Reference Wang and Luo2026) becomes either negligible or absent when
 $M_s \gt 3.0$
.
Overall, the primary distinctions in interface evolution across experiments with varying
 $ka_0$
and
 $M_s$
stem from differences in interface geometry, compressibility effects on spike and bubble dynamics, and vorticity deposition. These qualitative observations form the basis for the subsequent quantitative analysis and mechanistic interpretation.
4. Linear amplitude growth
Following previous studies (Zhou Reference Zhou2017a
,Reference Zhou
b
, Reference Zhou2024; Zhou et al. Reference Zhou2021), the interface amplitude is defined as half of the horizontal distance between the spike and bubble tips. In this section, the initial-amplitude effect on the linear amplitude growth, i.e. the deviation of linear amplitude growth rate (
 $\dot {a}_{l}$
) measured in practice from its theoretical counterpart as
 $ka_0$
departs from the low-
 $ka_0$
limit, will be discussed. To determine the experimental
 $\dot {a}_{l}$
(
 $\dot {a}_l^e$
), the temporal amplitude evolution is first extracted from successive schlieren images. Subsequently, a least squares linear regression is performed over the early-time interval prior to the onset of nonlinear evolution, thereby obtaining
 $\dot {a}_l^e$
(Zhou Reference Zhou2017a
,Reference Zhou
b
, Reference Zhou2024; Zhou et al. Reference Zhou2021). To quantify the initial-amplitude effect, a reference linear model capable of reliably describing the low-
 $ka_0$
scenarios is required. It should be emphasised that linear models are fundamentally derived under the low-
 $ka_0$
assumption, and their loss of validity under finite-
 $ka_0$
conditions is therefore expected. Deviations arising purely from geometric mechanism were already reported by Velikovich & Dimonte (Reference Velikovich and Dimonte1996) and Wang & Luo (Reference Wang and Luo2026), and additional mechanisms, such as shock proximity (Aleshin et al. Reference Aleshin, Lazareva, Zaitsev, Rozanov, Gamalii and Lebo1990; Dimonte et al. Reference Dimonte, Frerking, Schneider and Remington1996) and vorticity deposition (Wang & Luo Reference Wang and Luo2026), may further contribute to deviations from linear-theory predictions. Therefore, the present objective is not to evaluate the validity of linear models in the finite-
 $ka_0$
regime. Instead, we aim to provide a quantitative characterisation of the deviation of
 $\dot {a}_l^e$
from linear-theory predictions, and to identify and discuss the dominant physical mechanisms governing the observed deviation.
Given that the present experiments are characterised by strong compressibility, and the classical impulsive model loses accuracy under such conditions (Mikaelian Reference Mikaelian1994; Yang et al. Reference Yang, Zhang and Sharp1994; Velikovich et al. Reference Velikovich, Herrmann and Abarzhi2014; Si et al. Reference Si, Jiang, Cai, Wang and Luo2025), the linear compressible theory proposed by Richtmyer (Reference Richtmyer1960) (hereafter ‘Richtmyer theory’) is considered here. Notably, several other compressible linear theories exist (Wouchuk & Nishihara Reference Wouchuk and Nishihara1996; Wouchuk Reference Wouchuk2001a
,Reference Wouchuk
b
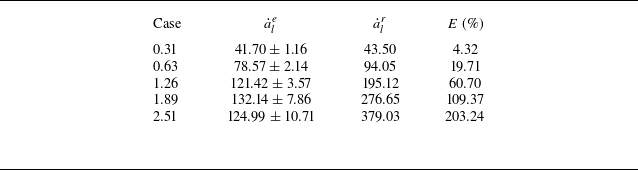
, Reference Wouchuk2026; Cobos-Campos & Wouchuk Reference Cobos-Campos and Wouchuk2016; Napieralski et al. Reference Napieralski, Cobos, Velikovich and Huete2024), but are not employed because their predictions are closely similar to those of the Richtmyer theory. As presented in table 3, for case 0.31,
 $\dot {a}_l^e$
and
 $\dot {a}_l$
predicted by the Richtmyer theory (
 $\dot {a}_l^{r}$
) exhibit favourable agreement, with relative error
 $E= (\dot {a}_l^{r} - \dot {a}_l^e)/\dot {a}_l^e$
below
 $5\,\%$
. This indicates that the Richtmyer theory can accurately describe the linear evolution in the low-
 $ka_0$
regime. For interface evolution in the finite-
 $ka_0$
regime, a self-consistent description would in principle require a nonlinear theoretical framework. Such a framework would need to incorporate the coupled influence of geometric and compressibility mechanisms, which remains highly challenging and lies beyond the scope of the present study. In the present study, instead, a reduction factor (
 $R$
) defined as
 $\dot {a}_l / \dot {a}_l^r$
is introduced to quantify the initial-amplitude effect, in which
 $\dot {a}_l^r$
serves as a reference baseline. It should be emphasised that
 $R$
does not constitute a closure derived from nonlinear governing equations, but rather serves as a diagnostic quantity that characterises the overall departure from linear-theory behaviour in the finite-
 $ka_0$
regime. Similar treatments have been extensively adopted in previous studies (Dimonte & Ramaprabhu Reference Dimonte and Ramaprabhu2010; Buttler et al. Reference Buttler2012; McFarland et al. Reference McFarland, Greenough and Ranjan2013; Dell et al. Reference Dell, Stellingwerf and Abarzhi2015; Luo et al. Reference Luo, Dong, Si and Zhai2016; Guo et al. Reference Guo, Zhai, Ding, Si and Luo2020; Probyn et al. Reference Probyn, Williams, Thornber, Drikakis and Youngs2021; Wang et al. Reference Wang, Wang, Zhai and Luo2023; Wu-Wang et al. Reference Wu-Wang, Liu and Xiao2024; Wang & Luo Reference Wang and Luo2026).
Linear amplitude growth rates
 $\dot {a}_l$
obtained from experiments (
 $\dot {a}_l^e$
) and predicted by Richtmyer theory (
 $\dot {a}_l^{r}$
). Here,
 $E = (\dot {a}_l^{r} - \dot {a}_l^e)/\dot {a}_l^e$
is the relative error between
 $\dot {a}_l^e$
and
 $\dot {a}_l^{r}$
. Units of
 $\dot {a}_l$
are m s−1.

Table 3. Long description
The table presents data on linear amplitude growth rates obtained from experiments and predicted by Richtmyer theory for different cases. It includes columns for case number, initial amplitude (a0) in millimeters, temperature (T) in Kelvin, initial amplitude growth rate (M), initial velocity (vi) in meters per second, final velocity (vf) in meters per second, change in velocity (Δu) in meters per second, amplitude (A), and a variable labeled VF. The table has 5 rows and 10 columns. Row 1: Case 0.31, a0 2.0 millimeters, T 293.45 Kelvin, M 3.161, vi 1085.7 meters per second, vf 600.0 meters per second, Δu 557.4 plus or minus 4.3 meters per second, A 0.797, VF 0.99. Row 2: Case 0.63, a0 4.0 millimeters, T 295.05 Kelvin, M 3.215, vi 1107.8 meters per second, vf 618.0 meters per second, Δu 557.1 plus or minus 6.4 meters per second, A 0.800, VF 1.00. Row 3: Case 1.26, a0 8.0 millimeters, T 295.35 Kelvin, M 3.317, vi 1142.8 meters per second, vf 640.0 meters per second, Δu 571.4 plus or minus 10.7 meters per second, A 0.802, VF 1.00. Row 4: Case 1.89, a0 12.0 millimeters, T 293.45 Kelvin, M 3.224, vi 1107.1 meters per second, vf 626.9 meters per second, Δu 557.1 plus or minus 10.0 meters per second, A 0.793, VF 0.97. Row 5: Case 2.51, a0 16.0 millimeters, T 295.05 Kelvin, M 3.174, vi 1092.8 meters per second, vf 615.5 meters per second, Δu 546.4 plus or minus 10.7 meters per second, A 0.794, VF 0.98.
In our recent work (Wang & Luo Reference Wang and Luo2026), we investigated the initial-amplitude effect over a range of
 $M_s$
from 1.066 to 1.749, in which the experimental series with
 $M_s = 1.066$
represents the quasi-incompressible scenarios with interface geometry being the dominant mechanism, while the other series with higher
 $M_s$
highlight the effects of compressibility and vorticity deposition. Additionally, we proposed an
 $R$
to quantify the coupled influence of interface geometry, shock proximity and vorticity deposition (
 $R^{wl}$
), which exhibits favourable predictive capability over the range of
 $M_s$
from 1.066 to 1.749. We can express
 $R^{wl}$
as
 \begin{align} R^{wl} =\frac {1}{1+ \big[0.2+(M_s-1.066)^{0.6} \big](ka_0)^2}. \end{align}
To enable a direct comparison between weak- and strong-shock scenarios, the experimental
 $R$
(
 $R^e = \dot {a}_l^e / \dot {a}_l^r$
) and the corresponding
 $R^{wl}$
for all experiments from both the previous work (Wang & Luo Reference Wang and Luo2026) and the present study are calculated and presented in figure 3(a). Notably, for the experiments with
 $M_s$
values 1.066, 1.116, 1.479, 1.749, 3.239,
 $R^e$
(
 $R^{wl}$
) are denoted as
 $R^e_{1.066}$
,
 $R^e_{1.116}$
,
 $R^e_{1.479}$
,
 $R^e_{1.749}$
,
 $R^e_{3.239}$
(
 $R^{wl}_{1.066}$
,
 $R^{wl}_{1.116}$
,
 $R^{wl}_{1.479}$
,
 $R^{wl}_{1.749}$
,
 $R^{wl}_{3.239}$
), respectively. Here,
 $R^e_{3.239}$
is smaller than
 $R^e_{1.066}$
when
 $ka_0$
violates the low-
 $ka_0$
criterion, indicating that mechanisms other than interface geometry contribute to suppress the linear evolution. However,
 $R^e_{3.239}$
is comparable to
 $R^e_{1.116}$
and larger than
 $R^e_{1.479}$
and
 $R^e_{1.749}$
, indicating that the initial-amplitude effect initially strengthens and then weakens with increasing
 $M_s$
. Notably, while our previous study (Wang & Luo Reference Wang and Luo2026) suggested that the initial-amplitude effect saturates with increasing
 $M_s$
, a non-monotonic dependence on
 $M_s$
was not anticipated therein. Accordingly, although
 $R^{wl}$
performs satisfactorily over the range of
 $M_s$
from 1.066 to 1.749, it overestimates the initial-amplitude effect in the strong-shock regime:
 $R^{wl}_{3.239}$
is significantly smaller than
 $R^{e}_{3.239}$
. The initial-amplitude effect can be decomposed into three distinct components: interface geometry, compressibility, and vorticity deposition. Since the interface-geometry contribution is independent of
 $M_s$
, the non-monotonic
 $M_s$
dependence of the initial-amplitude effect should be attributed to the
 $M_s$
dependence of the compressibility and vorticity-deposition contributions. In the following, we analyse the physical rationale underlying this behaviour.
(a) Comparison between
 $R^{e}$
and
 $R^{wl}$
. (b) Comparison between
 $R^{e}_{3.239}$
,
 $R^{e-b}_{3.239}$
,
 $R^{e-s}_{3.239}$
and
 $R^{wl}_{1.066}$
. (c) Comparison between
 $R^{e}$
and
 $R^{ws}$
. Subscripts denote
 $M_s$
values of the corresponding experiment.

The vorticity deposition is either absent or weak in the experiments with
 $M_s$
values 1.066, 1.116 and 3.239, therefore the difference in the initial-amplitude effect between them is primarily due to compressibility. We have
 $R^e_{1.066} \gt R^e_{1.116} \approx R^e_{3.239}$
, which conveys two pieces of key information. First, the overall influence of compressibility on the linear evolution is suppressive. Second, the suppressive influence of compressibility initially strengthens and subsequently saturates with
 $M_s$
. A comparison of the interface morphologies under weak- and strong-shock conditions reveals that compressibility influences the perturbation evolution via three primary mechanisms: (i) secondary compression, which does not affect the linear evolution but suppresses bubble growth during the nonlinear stage; (ii) shock proximity, which inhibits bubble growth from the linear to nonlinear stages; (iii) the promotive effect of the high pressure behind the Mach stem on the spike growth (Mach-reflection mechanism), which manifests from the linear stage. In other words, there are two compressibility-related mechanisms affecting the linear evolution: shock proximity and Mach reflection. The shock proximity is a mechanism that has long been recognised (Zhou Reference Zhou2017a
,Reference Zhou
b
, Reference Zhou2024; Zhou et al. Reference Zhou2021), whose underlying physical basis is that the downstream-developing interface structure (i.e. the bubble in the present light–heavy configuration) is precluded from overtaking the transmitted shock. In contrast, the Mach-reflection mechanism, to our knowledge, is newly identified in the present study. Beyond the qualitative analysis of interface morphology and wave-structure evolution, to provide more quantitative evidence for the existence of the Mach-reflection mechanism, we separately evaluate
 $R$
of the experimental linear bubble/spike amplitude growth rates (
 $\dot {a}_l^{e-b/s}$
), defined as
 $R^{e-b/s}_{3.239} = \dot {a}_l^{e-b/s}/ \dot {a}_l^r$
. The bubble and spike amplitudes are determined by the mean interface position, whose velocity is obtained by matching the transmitted-shock velocities predicted by one-dimensional gas-dynamic theory with those measured experimentally. To isolate the effects of compressibility on bubble and spike evolution,
 $R^{wl}$
for the experiments with
 $M_s= 1.066$
(
 $R^{wl}_{1.066}$
) is taken as the reference baseline;
 $R^{wl}_{1.066}$
represents the contribution of the geometric mechanism primarily, thus can serve as a quasi-incompressible theoretical reference. Accordingly, the deviation of
 $R^{e-b}_{3.239}$
(
 $R^{e-s}_{3.239}$
) relative to
 $R^{wl}_{1.066}$
can be attributed to the influence of compressibility on bubble (spike) evolution. As shown in figure 3(b),
 $R^{e-s}_{3.239}$
is larger than
 $R^{wl}_{1.066}$
, whereas
 $R^{e}_{3.239}$
and
 $R^{e-b}_{3.239}$
are smaller than
 $R^{wl}_{1.066}$
. These observations suggest two key points. First, the spike in the present highly compressible flow evolves more rapidly than that in quasi-incompressible flow, supporting the proposed Mach-reflection mechanism. Second, the shock proximity strongly suppresses bubble growth and results in a net suppressive influence of compressibility.
The suppressive influence of vorticity deposition on the amplitude growth can be assessed from the morphology of the spike-tip cavity (see also figures 1–4 in Wang & Luo Reference Wang and Luo2026): the cavity is absent at
 $M_s =1.066$
, small at
 $M_s = 1.116$
, pronounced and comparable in the experiments with
 $M_s= 1.479$
and 1.749, and absent again at
 $M_s = 3.239$
. This trend arises from differences in the Mach-reflection structure under diverse shock intensities (Henderson et al. Reference Henderson, Vasilev, Ben-Dor and Elperin2003). In the experiments with
 $M_s \lt 1.5$
, the wave configuration corresponds to a single Mach reflection, and the slip line is directed upstream, resulting in continuous vorticity deposition from the vicinity of the spike tip to the downstream region. In this regime, as
 $M_s$
increases, the Mach reflection becomes stronger, and a greater amount of vorticity is deposited. Accordingly, the influence of the vorticity deposition is enhanced. However, as
 $M_s$
further increases, the reflection structure transitions to a transitional or double Mach reflection, and a downstream-directed jet originating from the slip lines emerges. This leads to vorticity being deposited farther downstream compared with that under weaker-shock conditions. Consequently, despite a greater total vorticity deposition, the cavity in the experiments with
 $M_s = 1.749$
does not differ substantially from that in the experiments with
 $M_s = 1.479$
. In the present experiments with
 $M_s =3.239$
, the downstream-directed jet is significant, even causing the Mach stem to bend convexly, such that the deposited vorticity is rapidly convected away from the spike tip. Meanwhile, the spike tip moves rapidly upstream under the significant influence of the Mach-reflection mechanism. These factors together cause the deposited vorticity to be far from the spike tip, thereby reducing its influence on the spike evolution, and leading to the disappearance of the cavity.
Overall, the non-monotonic dependence of the initial-amplitude effect on
 $M_s$
arises because the suppressive influence of vorticity deposition (compressibility) on linear evolution initially strengthens and subsequently weakens (saturates) as
 $M_s$
increases. An analytical description of the initial-amplitude effect, involving multiple distinct and complex mechanisms (interface geometry, shock proximity, Mach reflection and vorticity deposition), remains a persistent theoretical challenge. Here, we propose an empirical
 $R$
that takes the form
 \begin{align} R^{ws} = \frac {1}{1+f(M_s)\,(ka_0)^2} = \frac {1}{1+\left(\dfrac {28-34.5M_s+7M_s^2}{10-14M_s+0.5M_s^2}\right)(ka_0)^2}, \end{align}
where
 $(ka_0)^2$
characterises the interface-geometry mechanism, while the shock-proximity, Mach-reflection and vorticity-deposition contributions, dependent on both
 $ka_0$
and
 $M_s$
, are encapsulated via the product of
 $(ka_0)^2$
and
 $f(M_s)$
. The construction of
 $R^{ws}$
proceeds as follows. Guided by previously proposed formulations for
 $R$
(Dimonte & Ramaprabhu Reference Dimonte and Ramaprabhu2010; Buttler et al. Reference Buttler2012; Probyn et al. Reference Probyn, Williams, Thornber, Drikakis and Youngs2021; Wu-Wang et al. Reference Wu-Wang, Liu and Xiao2024; Wang & Luo Reference Wang and Luo2026), we postulate a general form
 $R^{ws} = 1/[1+f(M_s)\,g(ka_0)]^z$
. Calibration against experiments with
 $M_s =1.066$
indicates that the specific expression
 $R^{ws} = 1/[1+0.19(ka_0)^2]$
(i.e.
 $f(1.066)=0.19$
,
 $g(ka_0) = (ka_0)^2$
and
 $z =1$
) accurately captures the dependence of the interface-geometry contribution on
 $ka_0$
. Extending this calibration to experiments with higher
 $M_s$
reveals that capturing the dependence of the shock-proximity, Mach-reflection and vorticity-deposition contributions on shock intensity necessitates an
 $f(M_s)$
that first increases rapidly, then increases more gradually, and ultimately decreases. A simple rational function is found to adequately capture this behaviour, thereby yielding the closed form of
 $R^{ws}$
given above. Figure 3(c) demonstrates that the proposed
 $R^{ws}$
effectively captures the initial-amplitude effect across a broad range of
 $ka_0$
and
 $M_s$
.
Temporal variations of perturbation amplitude in dimensionless form: (a) overall interface; (b) bubble and spike. Symbols and lines represent experimental and theoretical results, respectively.

The present mechanistic interpretation and
 $R^{ws}$
remain valid within the range of
 $M_s$
from 1.066 to 3.239. However, as noted above, in ICF and astrophysical flows,
 $M_s$
can reach significantly higher values, often exceeding 10 (Zhou Reference Zhou2017a
, Reference Zhou2024). The applicability of the present interpretation and the associated
 $R^{ws}$
to these higher-
 $M_s$
regimes remains uncertain, as mechanisms that are either absent or weak within the present
 $M_s$
range may become significant. This limitation underscores the need for further systematic investigations in higher-
 $M_s$
regimes.
5. Nonlinear amplitude evolution
The dimensionless temporal evolutions of the amplitudes of the overall interface and the bubble/spike (
 $a$
and
 $a_{b/s}$
) are presented in figures 4(a) and 4(b), respectively. Here,
 $t$
,
 $a$
and
 $a_{b/s}$
are non-dimensionalised as
 $\tau=k \dot {a}_{l}^{e}(t - t^*)$
,
 $\alpha=k(a - a^*)$
and
 $\alpha _{b/s}=k(a_{b/s} - a^*_{b/s})$
, respectively, in which
 $t^*$
represents the onset moment of linear amplitude growth, and
 $a^*$
(
 $a^*_{b/s}$
) denotes the corresponding value of
 $a$
(
 $a_{b/s}$
) at
 $t = t^*$
. Notably, all experimental data points presented in figures 4(a) and 4(b) are independent of any nonlinear modelling assumptions: the non-dimensionalisation procedure adopted in this work follows standard practice in RMI studies (Zhou Reference Zhou2017a
,Reference Zhou
b
, Reference Zhou2024; Zhou et al. Reference Zhou2021) and relies only on
 $\dot {a}_{l}^{e}$
and
 $k$
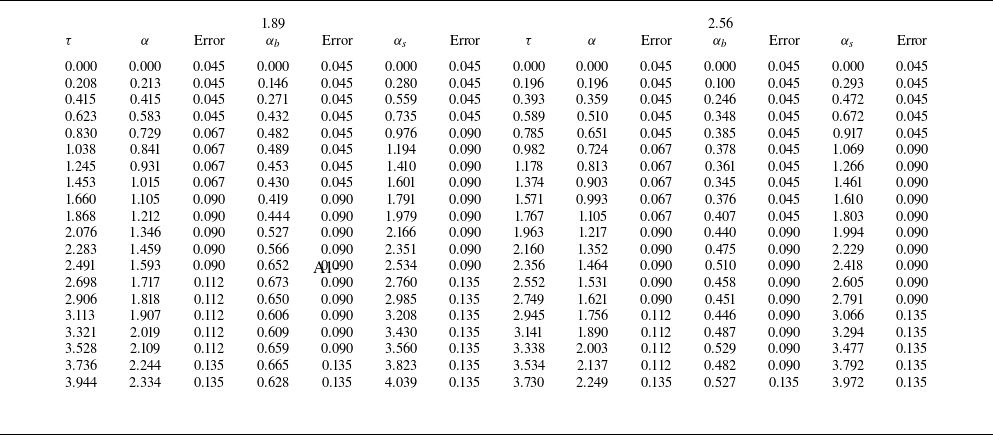
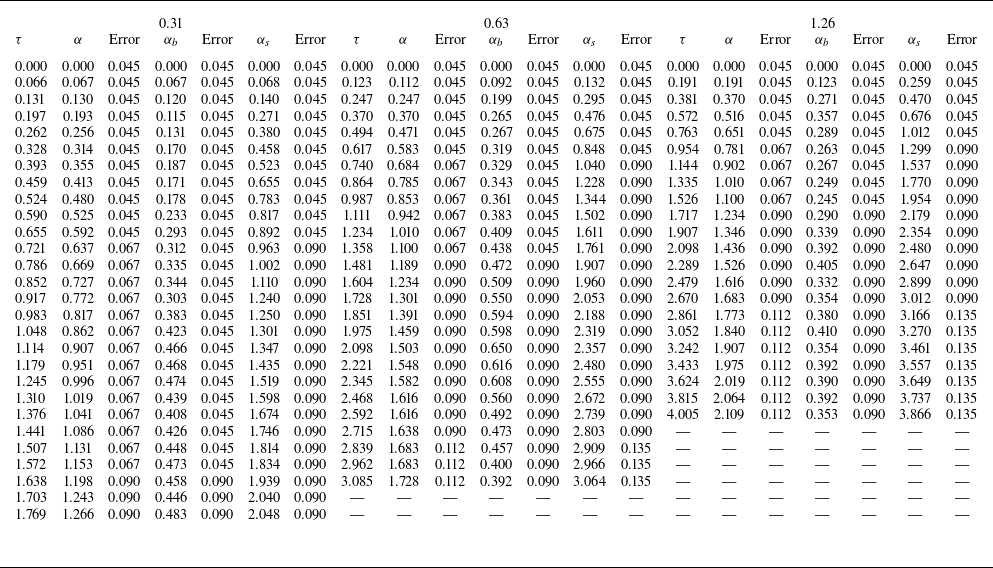
. Besides, to facilitate future theoretical and numerical studies and provide a model-independent benchmark dataset for validation purposes, tables summarising all relevant experimental data together with their corresponding measurement uncertainties have been provided in Appendix A.
The dimensionless amplitude evolutions for different cases approximately collapse together, consistent with previous observations under weak-shock conditions (Wang et al. Reference Wang, Wang, Zhai and Luo2023). Such a collapse would, as is commonly assumed in scaling analyses, suggest dynamic similarity. However, closer inspection of the interface morphology under diverse
 $ka_0$
conditions reveals otherwise: the flow evolution depends sensitively on
 $ka_0$
under both weak- and strong-shock conditions. Under weak-shock conditions (Wang et al. Reference Wang, Wang, Zhai and Luo2023), high-
 $ka_0$
cases exhibit markedly stronger nonlinearity than low-
 $ka_0$
cases, with additional mechanisms contributing to the interface evolution, such as secondary compression and vorticity deposition. Under strong-shock conditions, the interface evolution also strongly depends on
 $ka_0$
, particularly in terms of spike growth. Specifically, vortical structures emerge only at late times in the low-
 $ka_0$
case, whereas in the high-
 $ka_0$
cases, they develop at much earlier times, followed by the formation of secondary vortices and intense mixing along the spike stem. These observations demonstrate that despite the collapse of the normalised amplitude evolution, the underlying flow dynamics differ substantially between low- and high-
 $ka_0$
cases. In other words, the amplitude evolution reflects a global, integral measure of interface motion, which can mask significant differences in local flow structures and dynamical mechanisms. Therefore, in RMI studies, when the sole evidence lies in the collapse of dimensionless amplitude data, caution should be exercised in assessing whether this establishes dynamical similarity.
Although the flow is highly complex, we seek to elucidate the mechanisms governing the nonlinear evolution through comparisons with weak-shock experiments and theoretical predictions from existing models. As reported by Wang et al. (Reference Wang, Wang, Zhai and Luo2023), the ZG model (Zhang & Guo Reference Zhang and Guo2016) provides reasonable predictions for the amplitude evolution of both the overall interface and the bubble/spike under weak-shock conditions, which can be expressed as
 \begin{align} \dot {a}{_{b/s}^{ZG}}(t) = \frac {\dot {a}^e_{l}}{1 + \theta _{b/s} k \dot {a}^e_{l} t}, \end{align}
where
 \begin{align} \theta _{b/s}=\frac {3}{4}\frac {(1 \pm A)(3 \pm A)}{[3 \pm A + \sqrt {2}(1 \pm A)^{1/2}]} \frac {[4(3 \pm A) + \sqrt {2}(9 \pm A)(1 \pm A)^{1/2}]}{[(3 \pm A)^2 + 2\sqrt {2}(3\mp A)(1\pm A)^{1/2}]}. \end{align}
Here,
 $A$
denotes the post-shock Atwood number. It is worth noting that although the initial gas components in the present experiments are similar to those in the weak-shock experiments (Wang et al. Reference Wang, Wang, Zhai and Luo2023), the stronger shock, combined with the high compressibility of the heavy gas (SF
 $_6$
, characterised by a low specific heat ratio), results in a higher
 $A$
:
 $A\sim0.80$
in the present experiments compared with
 $A\sim0.67$
in the weak-shock experiments. The spike-acceleration mechanism – i.e. high-order harmonics concentrate on the spike and thereby enhance spike evolution (Dimonte & Ramaprabhu Reference Dimonte and Ramaprabhu2010) – may emerge under such conditions. Since the ZG model does not account for the spike-acceleration mechanism, the DR model (Dimonte & Ramaprabhu Reference Dimonte and Ramaprabhu2010), which incorporates this mechanism, is considered here as another theoretical reference. The DR model can be expressed as
 \begin{align} \dot {a}_{b/s}^{DR}=\dot {a}_{l}^{e} \frac {1+(1\mp A)k \dot {a}_{l}^{e} t}{1+C_{b/s}k \dot {a}_{l}^{e} t+(1\mp A)F_{b/s}(k \dot {a}_{l}^{e} t)^2}, \end{align}
in which
 $C_{b/s}=[4.5\pm A+(2\mp A)ka_1]/4$
and
 $F_{b/s}=1\pm A$
. Note that the ZG and DR models, as do most existing nonlinear models, assume that the initial growth rate for the nonlinear stage equals the linear growth rate, and that the bubble and spike possess identical initial growth velocities, i.e.
 $\dot {a}{_{b}}(0)=\dot {a}{_{s}}(0)=\dot {a}_{l}$
(Zhou Reference Zhou2017a
,Reference Zhou
b
, Reference Zhou2024; Zhou et al. Reference Zhou2021). Therefore,
 $\dot {a}{_{b}}(0)$
and
 $\dot {a}{_{s}}(0)$
are prescribed input parameters rather than quantities determined by the models.
As illustrated in figure 4, the ZG model appears to provide a favourable prediction for the overall amplitude evolution, which, however, results from a cancellation between its overestimation of bubble growth and underestimation of spike development. In contrast, the DR model overestimates the overall interface and bubble evolution, while predicting the spike growth reasonably well. For the bubble, the overestimation by the ZG and DR models can be attributed to compressibility-related effects. Specifically, during the early-time evolution, the shock-proximity mechanism significantly suppresses the downstream growth of the bubble as the transmitted shock remains very close to the bubble tip. In contrast, the secondary-compression mechanism emerges from the intermediate stage when transverse-wave interactions begin, resulting in fluctuation or even reduction of the bubble amplitude. For the spike, it should first be emphasised that under weak-shock conditions with negligible compressibility effects (Chen et al. Reference Chen, Xing, Wang, Zhai and Luo2023; Xing et al. Reference Xing, Chen, Li, Wang, Zhai and Luo2025), the ZG model, which does not consider the spike-acceleration mechanism, accurately describes the spike evolution for
 $A=0.72$
, while significantly underestimating the spike evolution for
 $A=0.86$
. This suggests that the spike-acceleration mechanism is relatively weak for
 $A=0.72$
but becomes significant for
 $A=0.86$
. In the present experiments,
 $A\sim0.80$
, which lies between 0.72 and 0.86, and it can be inferred that the spike-acceleration mechanism exists but is not dominant under the present conditions. Therefore, the underestimation of the present spike growth by the ZG model can be attributed to two factors: the Mach-reflection mechanism and the spike-acceleration mechanism, both of which promote spike growth. Under weak-shock conditions (Chen et al. Reference Chen, Xing, Wang, Zhai and Luo2023; Xing et al. Reference Xing, Chen, Li, Wang, Zhai and Luo2025), the DR model significantly overestimates the spike-acceleration mechanism for
 $A=0.72$
while accurately describing this mechanism for
 $A=0.86$
. Therefore, the DR model should be regarded as overestimating the spike-acceleration mechanism for the present experiments with
 $A\sim 0.80$
. Accordingly, its favourable prediction for the present spike evolution should be attributed to the fact that its overestimation of the spike-acceleration mechanism accidentally captures the contribution of the Mach-reflection mechanism to spike growth. Finally, it is important to emphasise that even though only the ZG and DR models are examined here, based on our previous systematic evaluation of existing nonlinear models (Chen et al. Reference Chen, Xing, Wang, Zhai and Luo2023; Xing et al. Reference Xing, Chen, Li, Wang, Zhai and Luo2025), it can be inferred that none of them adequately captures the shock-proximity and secondary-compression mechanisms (Mach-reflection and spike-acceleration mechanisms) on bubble (spike) evolution.
6. Conclusions
The initial-amplitude dependence of strong-shock-driven Richtmyer–Meshkov instability (RMI) in reflected-shock configurations is investigated through shock-tube experiments. A dedicated shock-tube facility is employed to generate strong shock waves with a Mach number (
 $M_s$
) exceeding 3.0 while maintaining a ‘clean’ post-shock flow. Additionally, a polyester-film technique, specifically developed for strong-shock experiments, is utilised, yielding well-defined initial interfaces with minimal influence on the flow evolution and visualisation. To highlight the initial-amplitude dependence, five experimental runs with dimensionless initial amplitude (
 $ka_0$
) ranging from 0.31 to 2.51 are conducted under otherwise identical conditions.
Qualitative comparisons of interface morphology between previous weak-shock experiments (Wang & Luo Reference Wang and Luo2026) and the present strong-shock experiments reveal a marked suppression of bubble growth and a pronounced enhancement of spike development under strong shocks. The high pressure behind the Mach stem, resulting from transmitted-shock reflection, plays a dominant role in promoting spike evolution, with its influence becoming increasingly pronounced as
 $ka_0$
increases. Vortical structures emerge only at late times in the low-
 $ka_0$
experiment, whereas they develop at significantly earlier stages in the high-
 $ka_0$
cases, followed by the formation of secondary vortices and intense mixing along the spike stem. By contrast, bubble evolution is strongly suppressed by the shock-proximity mechanism at early times, and further inhibited by secondary compression at later times, resulting in progressive flattening and distortion of the bubble, with this effect becoming more pronounced as
 $ka_0$
increases.
For the linear evolution, a comparison with weak-shock experiments (Wang & Luo Reference Wang and Luo2026) reveals that the initial-amplitude effect exhibits a non-monotonic dependence on
 $M_s$
: strongly positive at low
 $M_s$
(
 ${\lt } 1.5$
), becomes weak near
 $M_s \approx 1.75$
, and eventually turns negative at high
 $M_s$
. This behaviour contrasts with the previously anticipated saturation trend (Wang & Luo Reference Wang and Luo2026). Apart from the inherent interface-geometry mechanism, two additional factors govern the linear growth: compressibility and vorticity deposition. Compressibility influences the perturbation evolution through two primary mechanisms: the shock-proximity mechanism, i.e. the suppressive effect of transmitted shock on the bubble evolution, and the Mach-reflection mechanism, i.e. the promotive effect of the high pressure behind the Mach stem on the spike growth. The suppressive influence of shock proximity on bubble evolution exceeds the promoting influence of the Mach-reflection mechanism on spike growth, leading to an overall suppression of the linear amplitude evolution by compressibility. This suppressive effect first strengthens and subsequently saturates with increasing
 $M_s$
. In contrast, the vorticity-deposition contribution exhibits a non-monotonic dependence on
 $M_s$
, arising from variations in the Mach-reflection structure under different
 $M_s$
(Henderson et al. Reference Henderson, Vasilev, Ben-Dor and Elperin2003). At low
 $M_s$
, the vorticity deposited near the spike tip remains dynamically effective in suppressing the spike growth. In contrast, at higher
 $M_s$
, the downstream-directed jet convects vorticity away from the spike tip. Meanwhile, the spike tip rapidly moves upstream under the action of the Mach-reflection mechanism, thereby reducing the effective contribution of vorticity deposition. These mechanisms collectively give rise to the observed non-monotonic dependence of the initial-amplitude effect on
 $M_s$
. Guided by these physical insights, an empirical reduction factor is proposed to characterise the initial-amplitude effect over a broad range of
 $ka_0$
and
 $M_s$
.
For the nonlinear stage, the dimensionless amplitude evolutions under diverse
 $ka_0$
approximately collapse, consistent with observations under weak-shock conditions (Wang et al. Reference Wang, Wang, Zhai and Luo2023). However, this apparent similarity masks a strong dependence of the flow morphology and dynamics on
 $ka_0$
, indicating that amplitude alone is insufficient to characterise the evolution, and may lead to misleading interpretations of dynamic similarity. Comparative analyses with the ZG model (Zhang & Guo Reference Zhang and Guo2016) and DR model (Dimonte & Ramaprabhu Reference Dimonte and Ramaprabhu2010) suggest that for the bubble, the shock-proximity mechanism primarily influences the early-stage evolution, whereas the secondary-compression mechanism governs the intermediate- and late-stage evolution, giving rise to oscillatory amplitude behaviour, and in some cases even amplitude reduction. For the spike, besides the Mach-reflection mechanism, the spike-acceleration mechanism arising at relatively high Atwood numbers (
 $\approx 0.80$
) further promotes spike growth. None of the existing models adequately represents these mechanisms, leading to discrepancies with the experimental observations or predictions that are accurate only fortuitously.
The present study advances understanding of the initial-amplitude effect on RMI dynamics. However, it should be emphasised that the present experiments are limited to
 $M_s \approx 3.0$
, whereas
 $M_s$
in inertial confinement fusion (ICF) and astrophysical flows can attain substantially higher values, frequently exceeding 10 (Zhou Reference Zhou2017a
, Reference Zhou2024). Under such extreme conditions, mechanisms that are either absent or weak in the current experiments may become significant, and the relevance of the present interpretation framework and associated reduction factor to these higher-
 $M_s$
regimes remains uncertain. Consequently, systematic investigations under higher-
 $M_s$
conditions are warranted to achieve a more comprehensive understanding of the initial-amplitude effect, and the present interpretation framework and reduction factor should be further refined for broader applicability. Moreover, although the present study investigates the underlying physical mechanisms governing interface evolution over a broad range of
 $ka_0$
and
 $M_s$
via experiments, it does not establish a new predictive analytical framework. The development of such a predictive framework constitutes a critical avenue for future research. We hope that the physical insights and quantitative data presented here will provide useful guidance for the development and refinement of theoretical models. Furthermore, most existing studies on the initial-amplitude dependence of RMI have focused on light–heavy interfaces, i.e. reflected-shock configurations, whereas considerably less attention has been devoted to heavy–light interfaces, i.e. reflected-rarefaction-wave configurations. Heavy–light interfaces are more prevalent in ICF capsules, where both the interface separating the ablator and the deuterium-tritium (DT) ice, and the interface separating the DT ice and the DT gas, are heavy–light interfaces. In future work, the initial-amplitude dependence of heavy–light interface evolution will be systematically investigated.
Acknowledgements
The authors are grateful for the help of Dr S. Jiang and Dr W. Cai in performing experiments. Besides, the authors sincerely appreciate the reviewers for their valuable suggestions.
Funding
This work is supported by the National Natural Science Foundation of China (nos 12388101, U2430202, 12472228), the Challenge Project (no. TZ2025016), the Chinese Academy of Sciences Project for Young Scientists in Basic Research (no. YSBR-087), the New Cornerstone Science Foundation through the XPLORER PRIZE, and the Fundamental Research Funds for the Central Universities (no. WK2090250113).
Declaration of interests
The authors report no conflict of interest.
Appendix A. Summary of nonlinear amplitude evolution data
To facilitate direct comparison and validation, the nonlinear amplitude evolution data, together with the corresponding measurement errors, are presented in tables 4 and 5.
Summary of the nonlinear evolution data for Cases 0.31, 0.63, and 1.26.
 $\tau$
,
 $\alpha$
, and
 $\alpha _{b/s}$
: dimensionless time, overall interface amplitude, and bubble/spike amplitude, respectively.

Table 4. Long description
The table presents nonlinear evolution data for Cases 0.31, 0.63, 1.26, 1.89, and 2.51. It includes three columns: Case, overall interface amplitude, and bubble/spike amplitude. The table has five rows and three columns. Row 1: Case 0.31, overall interface amplitude 41.70 plus or minus 1.16, bubble/spike amplitude 43.50, E 4.32 percent. Row 2: Case 0.63, overall interface amplitude 78.57 plus or minus 2.14, bubble/spike amplitude 94.05, E 19.71 percent. Row 3: Case 1.26, overall interface amplitude 121.42 plus or minus 3.57, bubble/spike amplitude 195.12, E 60.70 percent. Row 4: Case 1.89, overall interface amplitude 132.14 plus or minus 7.86, bubble/spike amplitude 276.65, E 109.37 percent. Row 5: Case 2.51, overall interface amplitude 124.99 plus or minus 10.71, bubble/spike amplitude 379.03, E 203.24 percent.
Summary of the nonlinear evolution data for cases 1.89 and 2.56.

Table 5. Long description
Table 4: This table presents nonlinear amplitude evolution data for case 1.89. It includes columns for amplitude values and corresponding measurement errors. Table 5: This table presents nonlinear amplitude evolution data for case 2.56. It also includes columns for amplitude values and corresponding measurement errors.


 Ms

 ka0
 e
 t
 T
 vi
 vt
 Δu
 A
 (ρd−ρu)/(ρd+ρu)
 ρu
 ρd
 VF
 SF6

 ka0
 μ
 a˙l
 a˙le
 a˙lr
 E=(a˙lr−a˙le)/a˙le
 a˙le
 a˙lr
 a˙l

 Re
 Rwl
 R3.239e
 R3.239e−b
 R3.239e−s
 R1.066wl
 Re
 Rws
 Ms

 τ
 α
 αb/s