





A third of New Zealand (NZ) children aged 2–14 years have been overweight or obese over the last decade(1). Obesity is a complex public health issue that requires broad and overarching population-based solutions(Reference Swinburn, Egger and Raza2,Reference Brug, Kremers and Fv3) . The food environment, defined as the collective physical, economic, policy and sociocultural surroundings, plays a crucial role in the development of children’s dietary behaviours and has implications for the prevention of childhood obesity, impacting health and wellbeing later in life(Reference Vandevijvere, Mackay and D’Souza4). Obesogenic food environments have been defined as ‘the sum of influences that the surroundings, opportunities or conditions of life have on promoting obesity in individuals and populations’(Reference Swinburn, Egger and Raza2). While food environments play a key role in shaping health behaviours, improving these behaviours at a population level also requires individuals to have the motivation and capability to act healthily, supported by social and physical environments that provide opportunities for healthy choices(Reference Brug, Kremers and Fv3).
In an environment that offers easy opportunities for healthy behaviours, an individual may need less motivation and fewer skills to be able to make healthful choices(Reference Brug, Kremers and Fv3). The school food environment is an opportune setting to shape the dietary behaviours of children, given that children spend the majority of their weekday waking hours in a school setting(5). International systematic reviews(Reference Micha, Karageorgou and Bakogianni6) and meta-analyses(Reference Pineda, Bascunan and Sassi7) have highlighted that interventions aimed at improving the school food environment have shown benefits in increasing healthful behaviours of children including increased fruit and vegetable consumption, as well as having beneficial effects on BMI and metabolic health. However, in NZ, there is little monitoring of school food environments and a lack of strong government policy, with the responsibility on the schools’ board of trustees to promote healthy food and drinks within schools(8,Reference Chote, McKelvie-Sebileau and Swinburn9) . While school food and nutrition policies may be comprehensive, they lack strength due to the heavy reliance on generic standardised food policy templates(Reference Chote, McKelvie-Sebileau and Swinburn9,Reference Swinburn, Dominick and Vandevijvere10) . The NZ school food environment is suboptimal in its current state, with many school canteens dominated by unhealthy foods and sugar-sweetened beverages(Reference Pillay, Piddington and Ali11–Reference D’Souza, Vandevijvere and Swinburn13). It has been shown that canteen/tuckshop use is associated with a greater consumption of high-fat and high-sugar foods. In particular, a NZ study highlighted that children who bought most of their food from the school canteen were more likely to drink soft drinks and consume pastries and highly processed sweet snacks more often than those who did not use the canteen(Reference Utter, Schaaf and Mhurchu14).
The potential influence of the external food environment on children’s diets is complex and likely mediated by home, community and school settings(Reference Walton, Pearce and Day15). While the majority of health promotion efforts are spent on improving the internal school food environment(Reference Pineda, Bascunan and Sassi7,16,17) , it has been reported both nationally(Reference Chote, McKelvie-Sebileau and Swinburn9) and internationally(Reference Ronto, Rathi and Worsley18) that implementing healthy food and drink policies within schools to improve the healthiness of the foods available in school canteens is often hindered by the perceived impact of the proximity and density of unhealthy food outlets around schools. One proposed mechanism is that school food providers may face competitive and economic pressures in areas where students can easily access nearby retailers selling discretionary foods. To maintain student patronage and remain financially viable, canteen operators may be more likely to offer similar, less healthy food options, potentially undermining the implementation of healthy food policies. In a systematic review of twenty-eight studies which examined barriers and enablers to implementing healthy food and drink policies in schools, seven studies identified geographical proximity of external food retailers selling discretionary foods as a major barrier, affecting policy implementation and the profits of food providers within schools(Reference Ronto, Rathi and Worsley18).
Evidence from NZ suggests that retail food environments are unevenly distributed, with schools in socio-economically deprived areas more likely to be closer to fast-food/takeaway outlets(Reference Pearce, Blakely and Witten19). Similarly, these areas are more likely to have higher numbers of convenience stores and alcohol outlets compared with more affluent areas(Reference Pearce, Day and Witten20). A study in NZ which investigated the preferences of 1102 children highlighted that primary-school aged children reported enjoyment when going to shops to consume unhealthy food and drink and were less likely to make healthy choices when unsupervised(Reference Egli, Villanueva and Donnellan21). Similar results were seen in a wearable camera study in NZ, which highlighted that all food and drink purchased by children aged 11–14 years (n 37) were considered noncore/unhealthy(Reference McKerchar, Smith and Gage22). Children are particularly vulnerable to food marketing and advertising, and it has been shown that children’s exposure to unhealthy food and drink marketing, often found in abundance around schools(Reference Brien, Stephanie and Shreya23,Reference Huang, Brien and Omari24) , correlates with dietary preference and consumption(Reference Frost, Te Morenga and Mackay25). Greater distances from food shops have also been shown to be significantly associated with lower fast-food consumption in NZ children under the age of 14 years (n 4175)(Reference Jenkin, Pearson and Bentham26). There are few zoning laws and policies in NZ that place limits on the density or placement of food outlets selling unhealthy foods, and this has remained relatively unchanged over the last decade(Reference Swinburn, Dominick and Vandevijvere10,Reference Mackay, Percival and Te Morenga27) . Instead, district councils establish permitted activities within zones, including commercial operations such as restaurants and takeaways but do not regulate the number or location of food outlets. While councils have public health responsibilities, no council has yet adopted specific zoning rules to limit fast food density near schools despite advocacy and public health efforts(Reference Swinburn, Dominick and Vandevijvere10).
Only a handful of studies have investigated the density and type of food outlets surrounding NZ schools, with all data collected before 2015(Reference Walton, Pearce and Day15,Reference Clark, Quigg and Wong28–Reference Vandevijvere, Sushil and Exeter32) . Only two studies have assessed food outlets in NZ on a national scale(Reference Pearce, Blakely and Witten19,Reference Vandevijvere, Sushil and Exeter32) . In a temporal analysis of food outlets in NZ, it was observed that over a 40-year period, despite a decrease in the median number of food outlets within 800 m of primary schools (from nine in 1966 to six in 2006), there was an overall increase in the number of fast-food outlets from one to four(Reference Day, Pearce and Pearson30). Similarly, a recent analysis of food outlets around schools in Wagga Wagga and Blacktown, Australia, found that the number of outlets increased by 76 % between 2007 and 2023, likely due to increased demand and population growth(Reference Tse, Zeng and Gibson33). With a 14 % increase in the NZ population over the last decade(34), the food environment is likely to have shifted significantly to accommodate population growth, urban density and demand for convenience foods.
The present study aims to provide an up-to-date snapshot of the current food landscape around NZ primary schools and to examine the association between food outlet density around schools and the healthiness of NZ primary school canteen menus.
Methods
Healthy active learning
Healthy active learning (HAL) is a joint government initiative between Sport NZ, the Ministry of Education, the Ministry of Health and Health NZ that supports schools, kura (Māori immersion schools) and early learning services to improve the wellbeing of children and young people through healthy eating and drinking and quality physical activity and curriculum delivery(16).
Massey University has been contracted to evaluate the outcomes of the HAL initiative, including the healthiness of the food environment surrounding primary schools. The evaluation is a longitudinal quasi-experimental mixed methods design which began in 2020.
Study design and methods
The present study is a cross-sectional analysis of food outlets surrounding a convenience sample of primary schools across NZ (n 71) assessed as part of the HAL evaluation. Food outlet data were collected in April 2024 using an automated data collection endpoint known as Google’s Places API.
School selection
Surveys, adapted and developed by the Massey University research team, were used to capture information about the healthy food environments in schools. ‘School Food Policy and Practices’ surveys were distributed to all schools via email between 2020 and 2023, with responses collected using Qualtrics software. Contact details for schools were obtained via the website ‘Education Counts’. These surveys were intended for school principals or members of the senior management team to complete. The surveys included whether the school had a formal written healthy food and drink policy, how it was communicated and the school’s practices in promoting a healthy food environment. A total of 239 schools completed the Food Policies and Practices survey between 2020 and 2023.
Schools that completed the ‘School Food Policies and Practices’ questionnaire were contacted by the primary researcher in October 2023 to request a copy of their school canteen menu. Of the 239 schools that completed the survey, 109 schools were excluded due to their involvement in Ka Ora Ka Ako (the Ministry of Education’s ‘Free and Healthy School Lunches’ programme), which likely influenced their food provision systems beyond the school’s control. An additional thirty-one schools were excluded because they did not have a canteen or food menu, while nineteen schools did not respond to the request for their menu. A total of eighty schools provided school food menus.
School characteristics
Demographic characteristics of the participating schools were collected. The school deciles, geographic area and size were sourced from the NZ Ministry of Education’s School Directory, and the Equity Index (EQI) was obtained from the Ministry’s ‘School EQI Numbers 2023–2024’ document. The NZ decile school system, used from 1995 to 2022, ranked schools from 1 (most deprived) to 10 (least deprived) based on several socio-economic variables, with lower decile schools receiving more funding from the Ministry of Education. In 2023, the decile system was replaced by the EQI, which considers a broader range of socio-economic factors, with higher scores indicating greater need for additional support and funding. For comparative purposes, both measures were included. Deciles were described as low deprivation (deciles 8–10), medium deprivation (deciles 4–7) and high deprivation (deciles 1–3). The 2023 NZ Deprivation Index (NZDep), an area-based measure of socio-economic deprivation, was used to determine schools’ deprivation levels. NZDep scores were classified as low deprivation (NZDep 1–3), medium deprivation (NZDep 4–6) or high deprivation (NZDep 7–10). The EQI was categorised using the Ministry of Education ‘School Equity Index Bands and Groups’ for 2024, which reflect socio-economic barriers to education: fewer barriers (344–428), moderate barriers (429–494) and more barriers (>495). School size was included as a contextual characteristic reflecting surrounding population density and commercial activity and was classified as small (≤199), medium (200–399) or large (≥400) based on student numbers.
Outlet density mapping
Although several walking distances have been reported in previous literature, the present study characterised a walkable distance as a 1·6-km catchment area around a school, considering the broad age range of students in the present sample (years 1–8 corresponding to ages 5–13 years old)(Reference Chillón, Panter and Corder35). Google’s Places API, a programmatic interface to Google’s database, was used to retrieve data for all registered food outlets within a 1·6-km radius of each primary school, which provided school canteen menus for analysis (n 80). Seventeen string terms were used to find food outlets around schools after multiple iterations of parameter refinement based on categories developed as part of the ‘Food Environment Score’ tool for Australian food environments(Reference Moayyed, Kelly and Feng36,Reference Needham, Orellana and Allender37) and Google Business categories.
The string terms used were ‘Alcohol’, ‘Bakery’, ‘Bar’, ‘Butcher’, ‘Café’, ‘Convenience’, ‘Deli’, ‘Food’, ‘Fruit’, ‘Gas’, ‘Grocery’, ‘Poultry’, ‘Restaurant’, ‘Seafood’, ‘Supermarket’, ‘Takeaway’ and ‘Vegetable’. The data were collected from Google’s Places API in compliance with their terms of use. To determine the spatial relationship between schools and food outlets, geographic distances were calculated using the Geopy library, which utilises the Haversine formula to compute great-circle distances between two sets of latitude and longitude coordinates. Outlets with invalid or missing coordinates were excluded from this analysis to avoid introducing errors in distance calculations.
Outlet categorisation
Of the eighty schools, nine did not have any food outlets within the specified radius; therefore, seventy-one primary schools across NZ were used to collect data from Google’s Places API. A total of 6684 outlets were found through the API. Several types of outlets were removed manually from the initial dataset that were not applicable to the present analysis, including online retailers with a registered business address, petrol stations without a general store retailer, catering companies that did not sell food on premises, farming and pet supplies, agriculture supplies, garden centres and community venues/social clubs. After exclusion, a total of 6336 food outlets remained. After mapping and visualisation, it was discovered that Google’s Places API also included ‘relevant’ food outlets outside the specified 1·6-km search area, and these were removed, leaving a total of 4176 food outlets for inclusion in the present analysis.
Food outlets were individually and manually categorised according to a ‘Food Environment Score’ tool(Reference Moayyed, Kelly and Feng36,Reference Needham, Orellana and Allender37) , which was further refined for use in an NZ setting to include liquor/vape shops and include references to NZ colloquial terms for outlets such as a ‘dairy’, which would be considered a ‘general/convenience store’ (Supplementary Table A). Health scores ranging from –10 to 10 were used to quantitatively assess the healthiness of food outlets, with negative numbers corresponding to unhealthy food outlets and positive numbers indicating healthy food outlets. A health score of 0 was considered neutral and may contain both healthy and unhealthy food options. Investigation using Google images, business webpages, Facebook and other social media was used to categorise ambiguous food outlets such as cafés or restaurants, which may also have offered takeaways. Where food outlets were too ambiguous to distinguish, researcher discretion was used. To improve the reliability of the categorisation, 10 % of the dataset was independently reviewed by a second and third researcher. An agreement rate above 85 % was considered reliable(Reference Cheung and Tai38), and the researchers reached 92 % agreement.
School canteen menu analysis
In 2021, a team of three nutritionists and one dietitian created a quick-audit tool for assessing school canteen menus, called the ‘Menu Analysis Toolkit’, for use in the HAL evaluation. The development and categorisation process for this toolkit has been previously documented(Reference Pillay, Piddington and Ali11). The menu analysis toolkit provides a comprehensive breakdown of commonly available packaged foods and main menu items available to purchase in schools, categorised using the traffic-light system from the Ministry of Health’s ‘Healthy Food and Drink Guidance for Schools’(39). The traffic-light system has three categories: ‘green’ (nutrient-dense), ‘amber’ (moderate nutritional value) or ‘red’ (higher in saturated fat, salt or sugar, with lower overall nutritional value). A registered dietitian completed the school menu analysis using the ‘Menu Analysis Toolkit’, with 10 % of the menus assessed by a second dietitian to ensure consistency in food classification.
Mapping and visualisation
A map of the study area was generated using the Folium library, a Python tool that allows interactive maps to be created and visualised in a web browser (Figure 1). The map utilised a greyscale base map to emphasise the markers for the outlets and schools. The RegularPolygonMarker function in Folium was used to represent outlets with different shapes, based on their health category: green outlets were marked with triangles, amber outlets with squares and red outlets with circles. School locations were marked with black square markers. While analyses were conducted based on outlet density within a 1·6-km radius, both a 1·6-km and 800 m buffers are shown for illustrative purposes.
Visualisation of food outlet density around schools in Auckland, New Zealand (n 20).
Visualisation created using the Folium Library from data collected through Google’s Places API. Two circumferences are displayed: solid line, 1.6 km; dotted line, 800 m from the school. Key: Red circles indicate unhealthy food outlets (health score ≤–5), yellow squares indicate neutral food outlets (health score=0) and green triangles indicate healthy food outlets (health score ≥5). Black diamonds indicate schools. All markers are not able to be seen on this figure due to marker overlap. Full visualisation available as a supplementary file on request.

Figure 1. Long description
Panel A: North Auckland. A map showing the distribution of food outlets around schools in North Auckland. Schools are marked with black dots, unhealthy food outlets with red circles, neutral food outlets with yellow squares, and healthy food outlets with green triangles. Panel B: Central Auckland. A map showing the distribution of food outlets around schools in Central Auckland. Schools are marked with black dots, unhealthy food outlets with red circles, neutral food outlets with yellow squares, and healthy food outlets with green triangles. Panel C: West Auckland. A map showing the distribution of food outlets around schools in West Auckland. Schools are marked with black dots, unhealthy food outlets with red circles, neutral food outlets with yellow squares, and healthy food outlets with green triangles. Panel D: South/East Auckland. A map showing the distribution of food outlets around schools in South/East Auckland. Schools are marked with black dots, unhealthy food outlets with red circles, neutral food outlets with yellow squares, and healthy food outlets with green triangles.
Statistical analysis
Statistical analyses were performed using the IBM SPSS Statistics Package version 27 (SPSS Inc.) Descriptive analyses were conducted for demographic variables, total number of food outlets, health score and the number of healthy and unhealthy food outlets around schools. Normality was tested using the Kolmogorov–Smirnov and Shapiro–Wilk tests, which indicated that the data for the number of food outlets around schools and health scores were not normally distributed. Consequently, Mann–Whitney U and Kruskal–Wallis tests were used to determine differences in the number of total food outlets, health score, healthy food outlets and unhealthy food outlets according to demographic variable categories. The Wilcoxon signed-rank test was used to determine differences between the number of healthy and unhealthy food outlets across the total sample and according to demographic variables.
Generalised linear models were used to assess the relationship between food outlet density and the composition of school canteen menus. Separate models were run for total, healthy and unhealthy food outlets as predictors, with the percentage of green, amber and red food items on school canteen menus as dependent variables. Given the continuous nature of the data, a gamma distribution with an identity link function was applied. Model fit was assessed using likelihood ratio chi-square tests. A negative binomial generalised linear model with a log link function was used to assess the relationship between demographic variables and the total, healthy and unhealthy food outlet density around schools. All tests were two-tailed, with statistical significance indicated by P < 0·05.
Results
Food outlets around schools
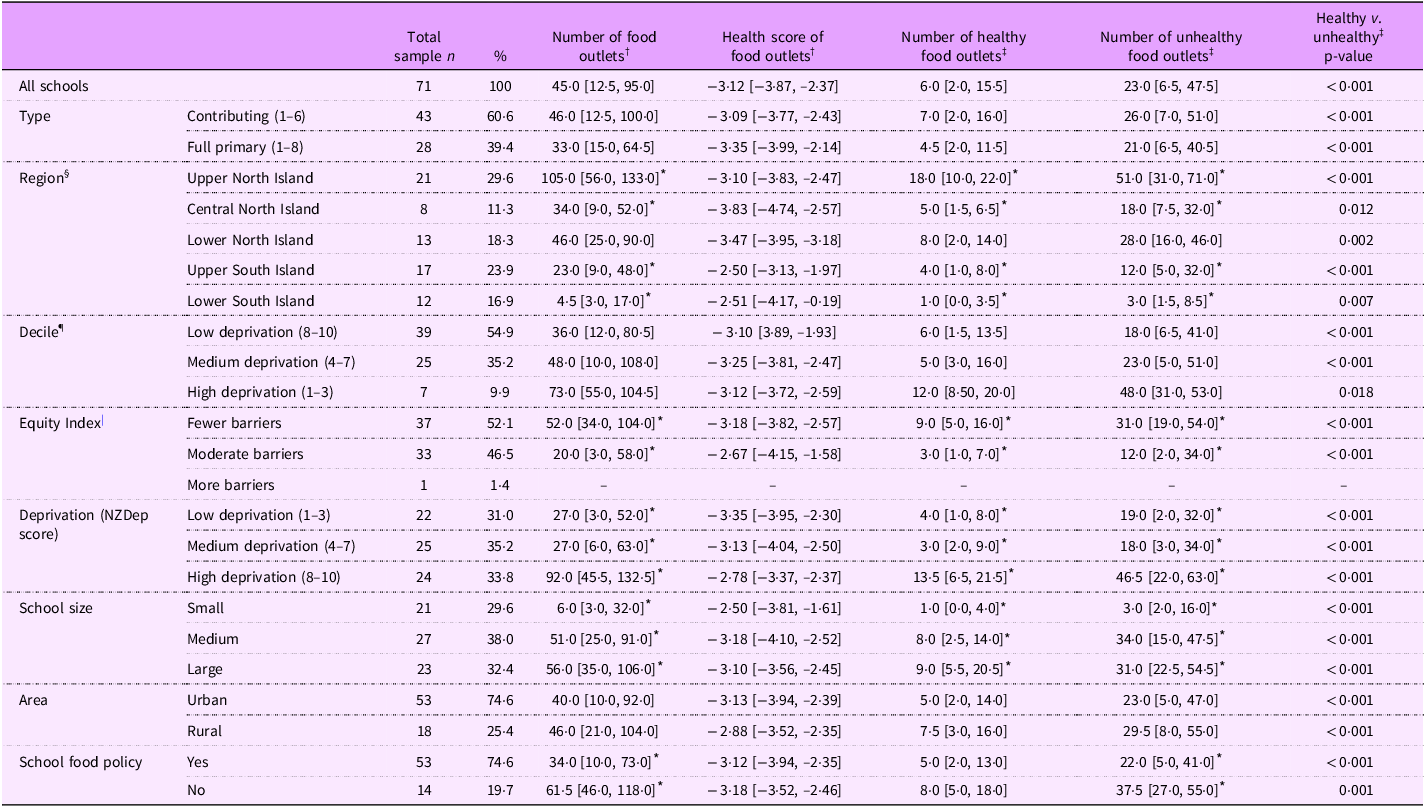
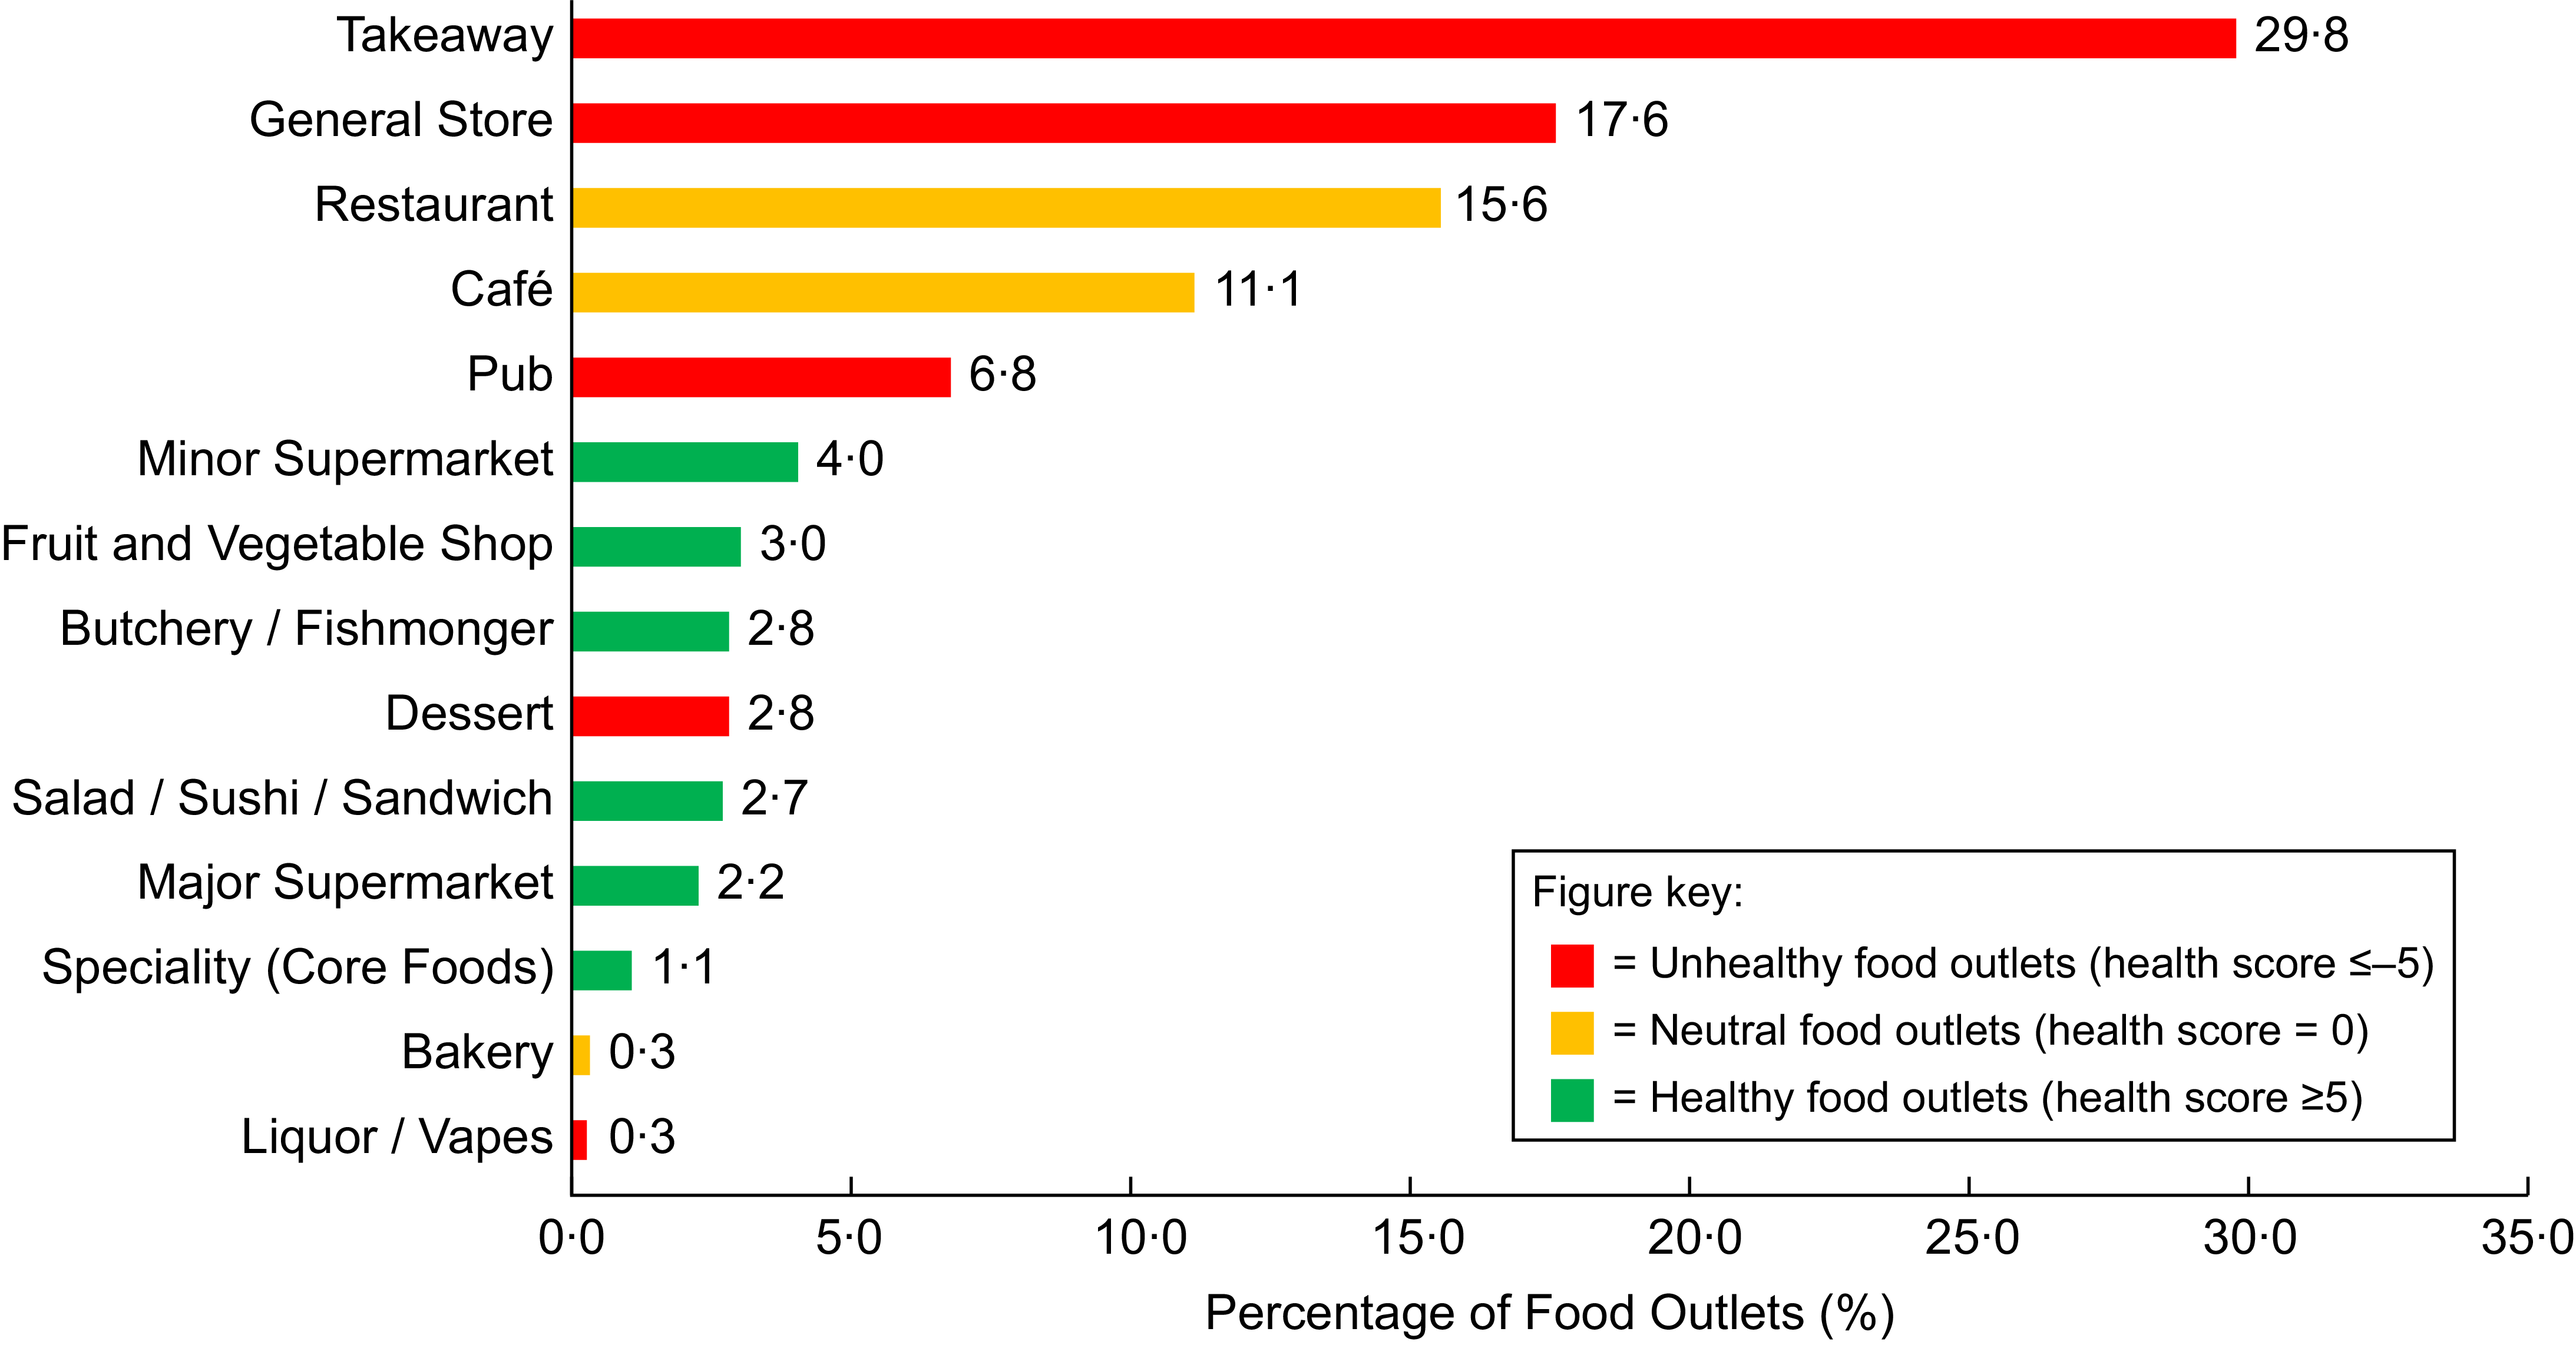
All food outlets were assessed around seventy-one primary schools in NZ (Table 1). The median number of food outlets around schools was 45·0, with a health score of –3·12. There were more unhealthy food outlets around primary schools compared with healthy food outlets (23·0 v. 6·0, respectively; z = –7·152, p < 0·001). The percentage of different food outlets around NZ primary schools is represented in Figure 2. Takeaways made up the largest percentage (29·8 %) of food outlets surrounding primary schools, followed by general/convenience stores (17·6 %) and restaurants (15·6 %). Healthful outlets made up a smaller percentage of total food outlets, with major and minor supermarkets making up 2·2 % and 4·0 %, respectively, and salad, sushi and sandwich bars making up 2·7 % of all outlets. Pubs/bars represented 6·8 % of outlets around schools, while liquor and vape stores made up 0·3 %.
Distribution and healthiness of food outlets around New Zealand primary schools (n 71) according to demographic variables

Table 1. Long description
The table presents data on the distribution and healthiness of food outlets around seventy-one primary schools in New Zealand. It includes columns for total sample size, percentage, number of food outlets, health score of food outlets, number of healthy food outlets, number of unhealthy food outlets, and a healthy vs. unhealthy p-value. Rows are categorized by type, region, decile, equity index, deprivation score, school size, area, and school food policy. Each row provides specific values for these categories, showing variations in the number and healthiness of food outlets. Notable trends include higher percentages of unhealthy food outlets in certain regions and deprivation levels.
NZDep, New Zealand Deprivation Index.
* Statistically significant P < 0.05 within groups.
† Values displayed as median and interquartile range.
‡ Healthy food outlets defined as having a health score ≥5; unhealthy food outlets defined as having a health score ≤–5. P-values indicate the difference between the number of healthy and unhealthy food outlets.
§ Regions have been condensed to accommodate smaller sample sizes in some regions. Upper North Island combined Auckland and Northland; Central North Island includes Hawke’s Bay, Waikato, Taranaki and Bay of Plenty; Lower North Island includes Manawatu-Whanganui and Wellington; Upper South Island includes Marlborough, Canterbury and West Coast; and Lower South Island includes Otago and Southland.
| Equity Index reported according to the Ministry of Education ‘School Equity Index Bands and Groups’, described according to the number of socio-economic barriers: fewer (344–428), moderate (429–494) and more (495–569).
¶ The New Zealand decile school system, used from 1995 to 2022, ranked schools from 1 (high deprivation) to 10 (low deprivation) based on several socio-economic variables, with lower decile schools receiving more funding from the Ministry of Education to address educational disparities.
The percentage of food outlets around a sample of New Zealand primary schools (n 71).

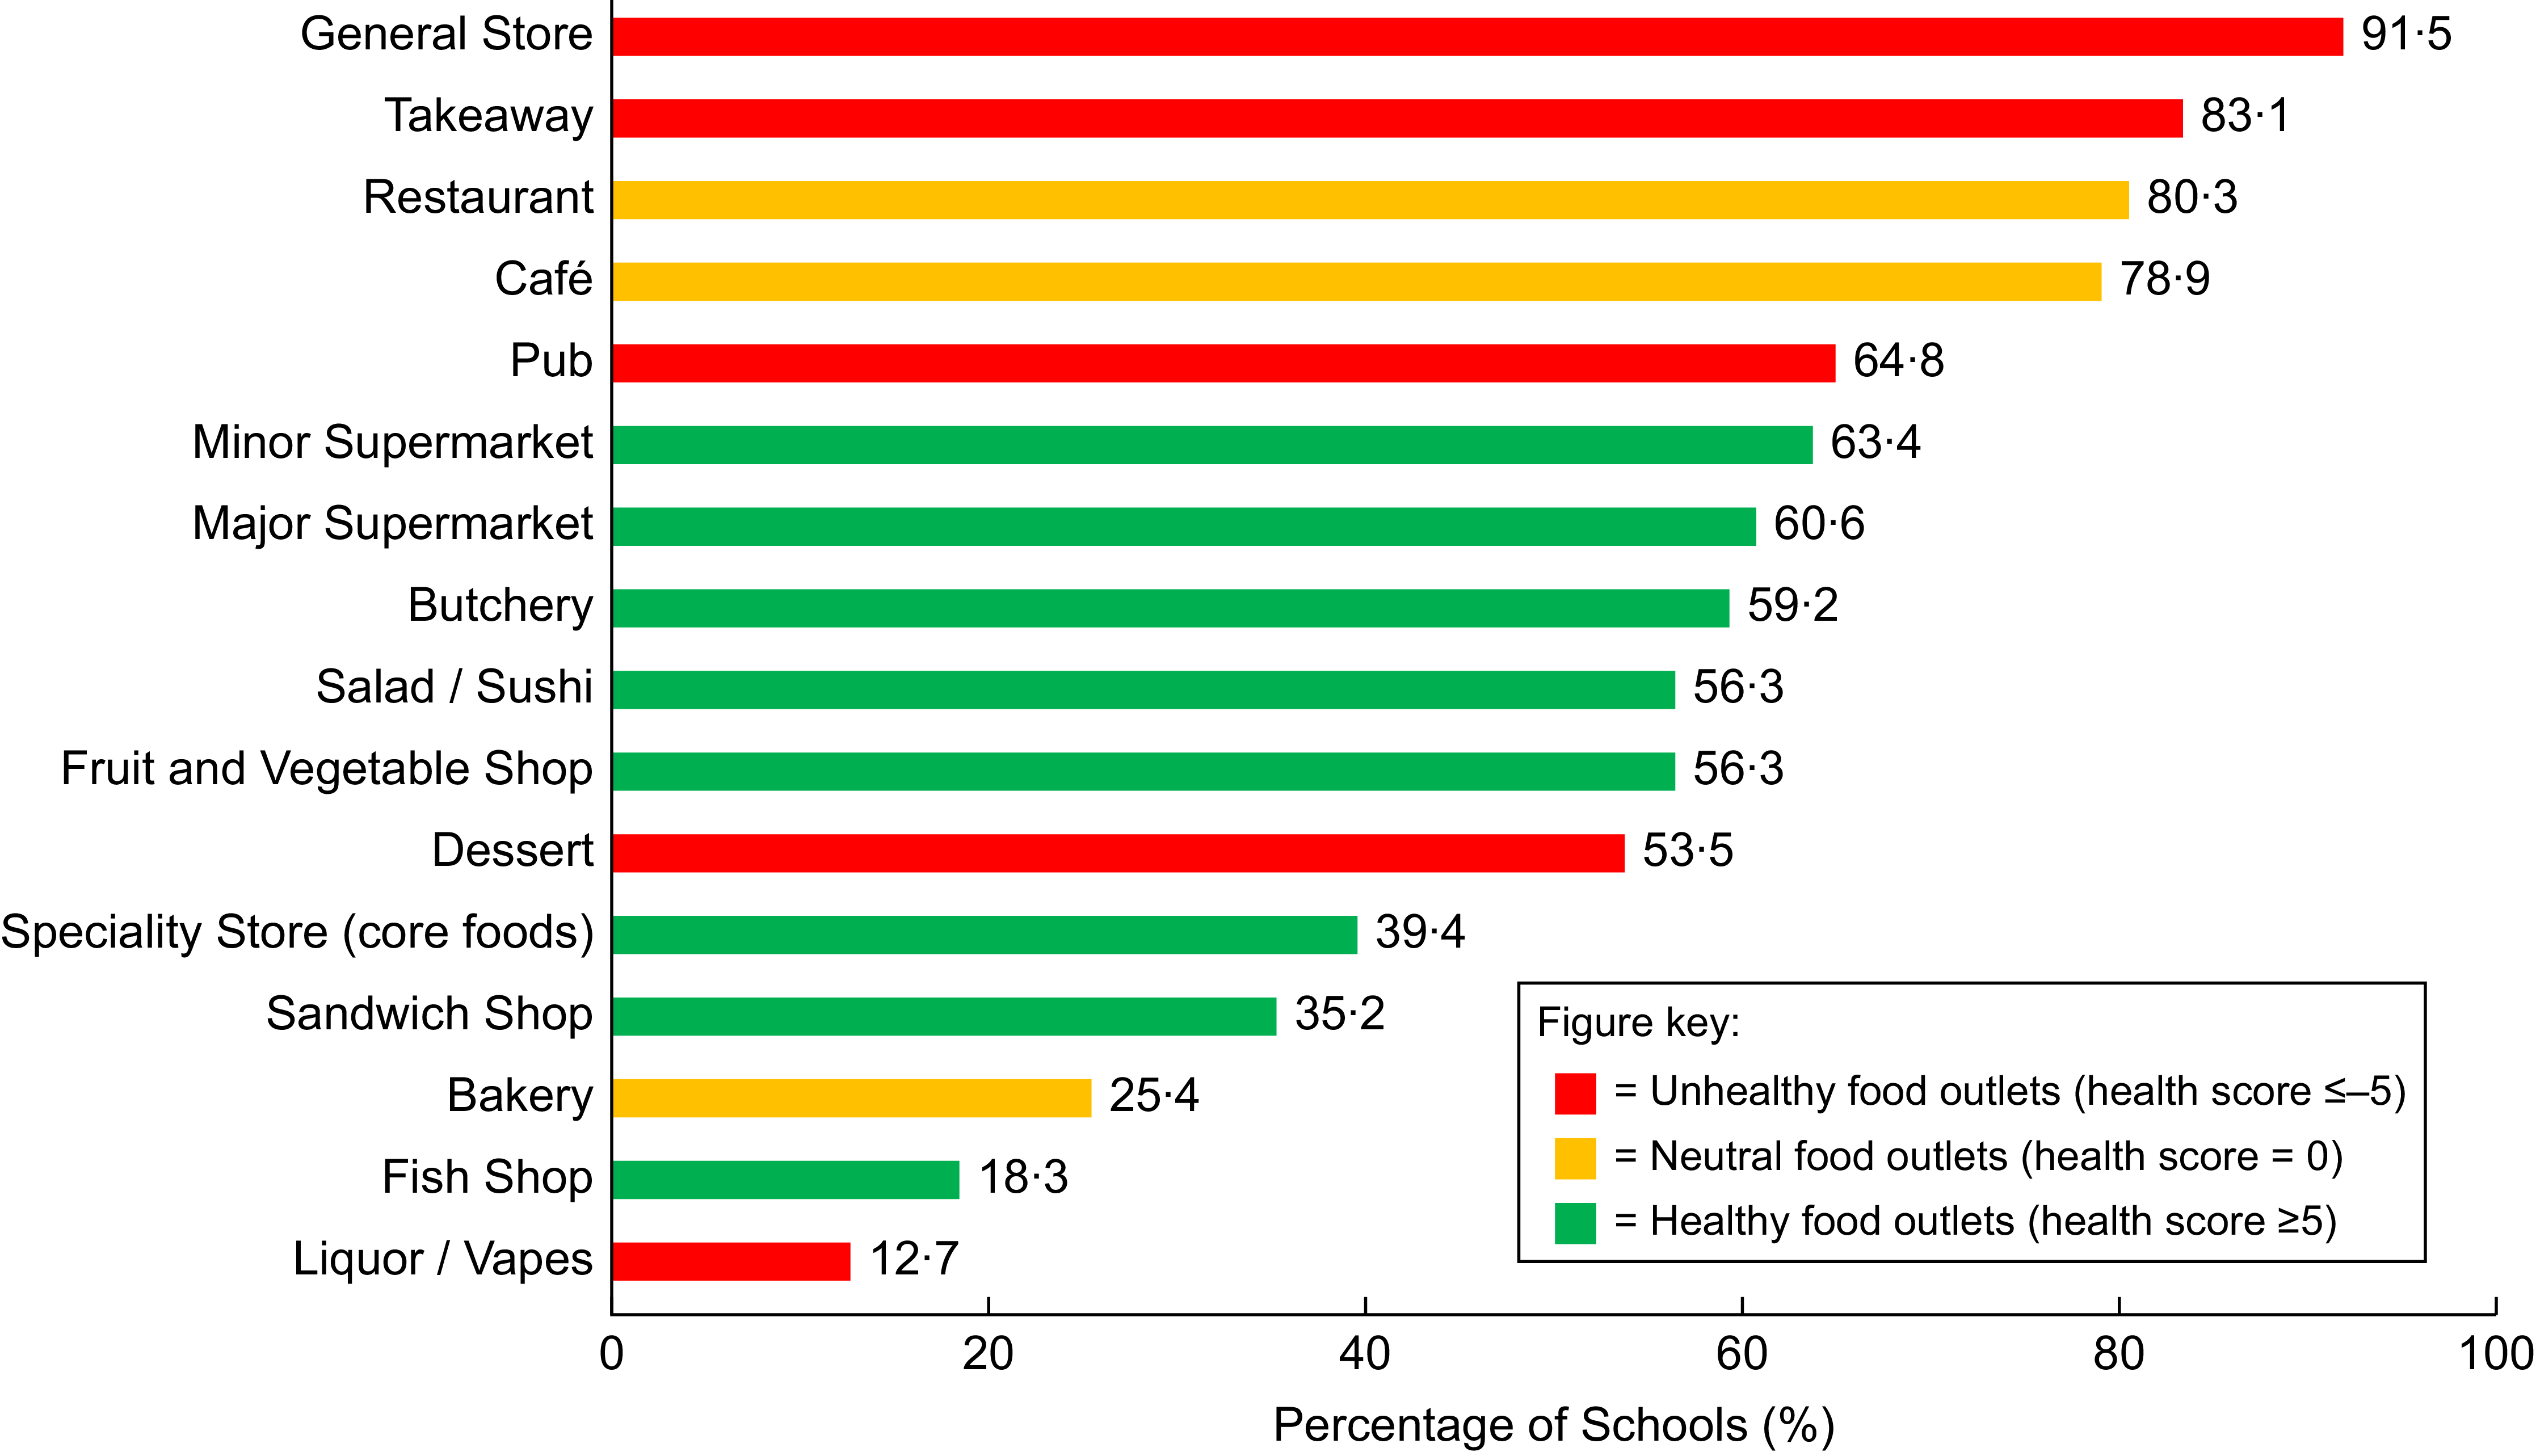
Most schools had a general store within a 1·6-km radius (91·5 %), followed closely by takeaway outlets (83·1 %), restaurants (80·3 %) and cafés (78·9 %) (Figure 3). Almost two-thirds of schools had a pub/bar within the walking catchment area (64·8 %). More than half of schools had a supermarket, major (63·4 %) or minor (60·6 %), within walking distance. Healthier options such as fruit and vegetable shops (56·3 %), sushi/salad bars (56·3 %) and butcheries (59·2 %) were common but less prevalent in comparison. Liquor/vape stores were the least common, found near only 12·7 % of schools.
Percentage of schools with nearby food outlets by type (1·6-km radius).

Demographics
A total of seventy-one schools were included in the present study, with 60·6 % classified as contributing schools (Years 1–6) and 39·4 % as full primary schools (Years 1–8; Table 1). Schools were distributed across five regions: Upper North Island (29·6 %), Central North Island (11·3 %), Lower North Island (18·3 %), Upper South Island (23·9 %) and Lower South Island (16·9 %). Based on decile classification, 9·9 % of schools were in the high deprivation category (deciles 1–3), 35·2 % in medium (deciles 4–7) and 54·9 % in the low deprivation category (deciles 8–10). EQI scores showed 52·1 % of schools in the ‘fewer barriers’ category, 46·5 % with ‘moderate barriers’ and 1·4 % with ‘more barriers’. Deprivation levels were evenly spread based on the NZDep classification, with 31 % of schools in low deprivation areas, 35·2 % in medium and 33·8 % in high deprivation areas. School size varied, with 29·6 % classified as small, 38 % medium and 32·4 % large. Most schools (74·6 %) were in urban areas, while 25·4 % were in rural locations.
Total number of food outlets according to demographic variables
There were no significant differences in the number of food outlets across school deciles (H(2) = 2·468, P = 0·291), urban and rural schools (U = 534, Z = 0·754, P = 0·451) or contributing and full primary schools (U = 533, Z = –0·806, P = 0·420). However, schools with a low EQI score (fewer barriers) had more food outlets than those in the medium EQI (moderate barriers) category (H(2) = 10·405, P = 0·006; P = 0·008). NZDep score was associated with food outlet density (H(2) = 12·966, P = 0·002), with high deprivation areas having more outlets than medium (P = 0·004) and low deprivation areas (P = 0·007). Food outlet numbers also varied by school size (H(2) = 12·475, P = 0·002), with small schools having fewer outlets than medium (P = 0·021) and large schools (P = 0·002). Significant regional differences were observed (H(4) = 26·530, P < 0·001), with fewer outlets near schools in the central North Island (P = 0·006), upper South Island (P = 0·001) and lower South Island (P < 0·001) compared with the upper North Island. Across all demographic categories, there were more unhealthy food outlets compared with healthy food outlets (P < 0·05).
Higher NZDep scores were significantly associated with food outlet numbers (χ2(1) = 168·874, P < 0·001; B = 0·123, se = 0·052, P = 0·019), with a 13 % increase per unit rise in deprivation score. Region was also associated with outlet density, with schools in the upper North Island (χ2(1) = 232·404, P < 0·001; B = 1·152, se = 0·468, P = 0·006) and lower North Island (χ2(1) = 168·874, P < 0·001; B = 0·948, se = 0·503, P = 0·006) having significantly more outlets. Other demographic variables, including school type, area, size, decile and EQI, were not significantly associated with outlet density.
Health score of food outlets according to demographic variables
Median health scores of food outlets around primary schools ranged from –3·83 to –2·50 across demographic variables. There were no differences in the food outlet health score based on deprivation (H(2) = 2·170, P = 0·338), EQI (H(2) = 2·329, P = 0·312) or deciles (H(2) = 0·686, P = 0·710). Similarly, health scores did not vary by school size (H(2) = 1·321, P = 0·517), region (H(4) = 8·055, P = 0·090), school type (U = 557·5, z = –0·524, P = 0·601) or area (U = 532, z = 0·727, P = 0·467).
Healthy food outlets according to demographic variables
The number of healthy food outlets varied by NZDep score (H(2)=13·015, P = 0·001), with more outlets near schools in high deprivation areas compared with medium (P = 0·010) and low deprivation areas (P = 0·003). Schools with a low EQI score (fewer barriers) also had more healthy food outlets than those with a medium EQI score (H(2)=11·438, P = 0·003), while decile rating showed no differences (H(2)=2·438, P = 0·296).
Significant regional differences were observed (H(4)=25·950, P < 0·001), with schools in the upper North Island having a greater proportion of healthy food outlets compared with the central North Island (P = 0·038), upper South Island (P = 0·001) and lower South Island (P < 0·001). School size was also associated with healthy food outlet numbers (H(2)=14·478, P < 0·001), with small schools having fewer outlets than medium (P = 0·037) and large schools (P = 0·001).
Higher NZDep scores were significantly associated with the number of healthy food outlets (χ2(1) = 6·562, P = 0·010; B = 0·147, se = 0·057, P = 0·010), corresponding to a 15·9 % increase in healthy food outlets per unit rise in deprivation score. Region was also significantly associated with healthy food outlet density, with schools in the upper North Island (χ2(1) = 4·410, P = 0·036; B = 1·066, se = 0·508, P = 0·036) and lower North Island (χ2(1) = 4·399, P = 0·036; B = 1·124, se = 0·536, P = 0·036) having more options. Other variables, including area, school type, EQI and decile, were not significantly associated with healthy food outlet density.
Unhealthy food outlets according to demographic variables
The number of unhealthy food outlets around schools varied by NZDep score (H(2) = 10·636, P = 0·005), with more outlets in high deprivation areas compared with medium (P = 0·014) and low deprivation areas (P = 0·015). Schools with a lower EQI score (fewer barriers) also had more unhealthy outlets than those with a medium EQI score (H(2) = 10·805, P = 0·005; P = 0·007), while decile rating showed no differences (H(2) = 2·913, P = 0·233).
Significant regional differences were observed (H(4) = 27·911, P < 0·001), with the upper North Island having more unhealthy food outlets than the central North Island (P = 0·006), upper South Island (P = 0·001) and lower South Island (P < 0·001). School size was also associated with unhealthy food outlet numbers (H(2) = 14·206, P < 0·001), with small schools having fewer outlets than medium (P = 0·012) and large schools (P = 0·001).
Higher NZDep score was significantly associated with more unhealthy food outlets (χ2(1) = 4·224, P =P = 0·040; B = 0·109, se = 0·053, P = 0·040), with an 11·5 % increase per unit rise in deprivation score. Region was also significantly associated with unhealthy food outlets, with schools in the upper North Island (χ2(1) = 6·457, P = 0·011; B = 1·231, se = 0·485, P = 0·011) and lower North Island (χ2(1) = 7·437, P = 0·006; B = 1·415, se = 0·519, P = 0·006) having the highest number of unhealthy outlets. Other demographic variables were not significantly associated with unhealthy food outlets.
Food outlets and school food policies
Most (74·6 %) schools had a healthy food and drink policy in place, while 19·7 % did not. Schools with a healthy food and drink policy had fewer overall food outlets surrounding the school (U = 506, Z = 2·083, P = 0·037), as well as fewer unhealthy food outlets (U = 501, z = 2·007, P = 0·045). There were no differences in the food outlet health score based on the presence of a healthy food and drink policy (U = 393, z = 0·339, P = 0·734).
Food outlet density and school canteen menus
School food menus (n 71) were made up of 19·7 % green food items, 35·1 % amber food items and 35·5 % red food items. The total number of food outlets was not significantly associated with the percentage of green (χ2(1) = 3·059, P = 0·080; B = 0·127, se = 0·085, P = 0·136) and amber food items on school canteen menus (χ2(1) = 1·261, P = 0·261; B = –0·044, se = 0·033, P = 0·179). Separate models examining healthy and unhealthy food outlets showed similar patterns, with no significant associations observed between the number of healthy food outlets and the percentage of green (χ2(1) = 1·868, P = 0·172; B = 0·524, se = 0·383, P = 0·172) or amber food items on school canteen menus (χ2(1) =1 ·737, P = 0·188; B = –0·361, se = 0·274, P = 0·188). Similarly, unhealthy food outlets were not significantly associated with the percentage of green (χ2(1) = 3·607, P = 0·058; B = 0·291, se = 0·181, P = 0·107) or amber food items (χ2(1) = 1·364, P =P = 0·243; B = –0·086, se = 0·073, P = 0·243). Overall, these findings indicate little evidence of an association between food outlet density or type and the availability of green or amber food items on school canteen menus.
The total number of food outlets surrounding schools showed a small but statistically significant association with the percentage of red food items on school canteen menus (χ2(1) = 6·661, P = 0·010; B = –0·127, se = 0·049, P = 0·010), with higher outlet density corresponding to a slightly lower proportion of red food items. The number of healthy food outlets was also negatively associated with the percentage of red food items on school canteen menus (χ2(1) = 3·979, P = 0·046; B = –0·513, se = 0·257, P = 0·046). The number of unhealthy food outlets showed a small negative association with the percentage of red food items (χ2(1) = 4·017, P = 0·045; B = –0·270, se = 0·106, P = 0·011), suggesting that higher numbers of unhealthy food outlets may be associated with a modest reduction in the proportion of red food items on school canteen menus. Across all models, effect sizes were small, suggesting limited variation in the proportion of red food items in relation to surrounding unhealthy food outlet density.
Discussion
The present study utilised Google’s Places API to provide a current snapshot of the external food environment around a sample of primary schools across NZ. More than 4000 food outlets were identified within a 1·6-km catchment area of the 71 schools studied. The average health score across all outlets was –3·12, indicating that unhealthy food outlets significantly outnumbered healthy food outlets around schools, with convenience stores and takeaways/fast food the most prevalent types of food outlets. Results suggest that the current external school food environment is still highly obesogenic and does not promote opportunity for positive nutrition behaviours.
More than 80 % of schools in the present analysis had a convenience store and a takeaway/fast food outlet within 1·6 km of the school. This is higher than previously reported in the last national analysis of outlet density conducted in 2014, which showed that 68·5 % of schools had a convenience store and 62 % had a takeaway outlet within the catchment area(Reference Vandevijvere, Sushil and Exeter32). The high prevalence of convenience stores and takeaway outlets may be attributed to the differences in catchment areas between the two studies, with the latter national study using an 800-m school radius(Reference Vandevijvere, Sushil and Exeter32). The prevalence and density of convenience stores around primary schools is also likely to contribute to exposure to unhealthy food advertising. Several studies in NZ have highlighted that most food advertisements, the majority for unhealthy foods such as soft drinks and confectionery, are more likely to be found in and around convenience stores/dairies(Reference Brien, Stephanie and Shreya23,Reference Maher, Wilson and Signal31) . Children are aware of these advertisements, and in one-on-one interviews with thirty-three NZ children, many noted that they saw unhealthy food advertisements around their school and that junk food marketing was effective, with many going on to purchase the advertised food(Reference Signal, Jenkin and Barr40). Despite the high density of unhealthy food outlets near schools, NZ lacks zoning laws that restrict the placement or concentration of these outlets around educational settings(Reference Swinburn, Dominick and Vandevijvere10).
In the present study, unhealthy food outlets were 2·44 times more frequent around schools in areas of high deprivation compared with schools in the least-deprived areas, consistent with previous findings highlighting ‘food swamps’ in less-affluent areas(Reference Sushil, Vandevijvere and Exeter41). Similarly, an examination of five NZ cities in 2008 found that the proportion of food outlets was considerably higher around schools in the most-deprived areas, with convenience stores 2·8 times more frequent and takeaway outlets 2·3 times more frequent in areas of greater socio-economic deprivation(Reference Day and Pearce29). Trends over time have shown that the median number of fast-food outlets has rapidly increased around more deprived schools in Christchurch, NZ, from one in 1966 to seven in 2006, compared with an increase from one to three around schools in more affluent areas(Reference Day, Pearce and Pearson30). In NZ, children from the most-deprived areas are 1·35 times more likely to be considered overweight or obese(1). The high density of unhealthy food outlets in deprived areas reflects a broader systemic imbalance, where lack of adequate zoning laws and policy is exposing vulnerable populations to obesogenic conditions, likely influencing dietary behaviours, food preferences and contributing to health disparities(Reference Swinburn, Dominick and Vandevijvere10).
Given the prevalence of unhealthy food outlets around schools, the role of the school in shaping dietary behaviours is arguably more critical in offsetting the influence from external retailers. Findings from the present analyses suggest that healthy food and drink policies are present in many schools irrespective of the external/surrounding food outlets. While these policies may coincide with more favourable external environments, their existence does not appear to be associated with outlet density or type. Food and nutrition policies can positively influence children’s dietary behaviours in schools and promote healthy school canteens; however, school food policies in NZ are often weak and lack comprehensiveness and strength to make meaningful change(Reference Vandevijvere, Mackay and D’Souza4,Reference D’Souza, Vandevijvere and Swinburn13) . Implementing healthy school food policies may be low on the list of school priorities when considering available resources, time, educational demands and socio-economic barriers(Reference Ronto, Rathi and Worsley18). To bridge this gap, the NZ government, through the Ministry of Education, Ministry of Health, Health NZ and Sport New Zealand, jointly implemented the HAL initiative to promote healthy eating and physical activity in schools in 2020. A health promotion workforce was deployed to support food policy development, deliver professional development and engage in strategic planning and collaboration with school boards of trustees and local networks to improve the internal school food environment(16,17) . Alongside HAL, the Ministry of Health released the ‘Healthy Food and Drink Guidance for Schools’, a voluntary traffic-light guidance to promote healthy school canteens(39). However, the present analyses highlighted poor implementation of these guidelines, with most foods offered within school canteens/tuckshops belonging to the ‘red’ unhealthy food category (35·5 %). ‘Green’ healthy foods made up the smallest proportion of foods on the school menu (19·7 %), consistent with findings from previous studies both in NZ(Reference Pillay, Piddington and Ali11,Reference Green, Ali and Wham12) and Australia(Reference Hill, Blake and Alston42–Reference Silva-Sanigorski, Breheny and Jones45).
While many schools have previously cited the density of food retailers outside the school as a barrier to healthy food provision(Reference Chote, McKelvie-Sebileau and Swinburn9,Reference Ronto, Rathi and Worsley18) , the present study found only weak associations between the number of food outlets around the school, whether healthy or unhealthy, and the composition of school canteen menus. No meaningful associations were observed for the proportion of green or amber food items. A small inverse association was observed between food outlet density and the proportion of red food items on school canteen menus; however, effect sizes were small, indicating limited practical significance. This suggests that while schools perceive external retailers as a barrier to a healthy school canteen, it is likely that school policies, prioritisation and funding play a bigger role in the implementation of a healthy school canteen. Successful implementation of healthy food and drink guidelines has been highlighted in areas where guidelines are mandated, with clear expectations and monitoring frameworks in place(Reference Myers, Sauzier and Ferguson46). Greater investments in initiatives that actively support the internal school food environment, including enhancing the nutrition promotion workforce, mandating healthy food guidelines and creating accountability measures, could have significant impacts on the healthiness of school canteens, challenging the systemic effects of the surrounding obesogenic environment.
Strengths and limitations
There are several strengths to the present study. The diverse range of schools and national scope across NZ enhances the generalisability of the findings.
Our study utilises high-resolution mapping using Google’s Places API within a 1·6-km radius around each school within the sample. While a secondary measure was not used to validate the data from Google’s Places API, studies using Google’s geographic database have shown high reliability when compared with ground-truthing(Reference Silva, Grande and Rech47,Reference Clarke, Ailshire and Melendez48) and manual geospatial mapping(Reference Ramírez-Toscano, Skaba and de Matos49,Reference de Menezes, de Matos and de Pina50) . Therefore, the use of Google’s Places API is likely to capture a broad range of registered food outlets. Utilising a programming language provides an automated solution that works directly with data provided by Google, and therefore, the dataset is entirely replicable with larger sample sizes, enhancing the robustness of the research and opportunities for global comparison. All food outlets were manually categorised, enabling the researcher to override inaccurate Google classifications, for example, a ‘takeaway’ outlet which may have been classified as a ‘restaurant’ online, as well as remove food outlets which were closed or not applicable to the present analysis. To ensure reliability of the coding, 10 % of the dataset was coded independently by two additional researchers, with 92 % agreement reached. The school canteen menus were analysed by a dietitian, with a second dietitian independently assessing 10 % of the menus for reliability and accuracy. The menu analysis toolkit was developed by experts in the field (one dietitian and three nutritionists) in conjunction with the Healthy Food and Drink guidance and has been utilised in recent analyses(Reference Pillay, Piddington and Ali11,Reference Green, Ali and Wham12) .
Several limitations must also be considered in light of the findings. The present study included a convenience sample of seventy-one primary schools across NZ, which may not be representative of all NZ schools or regions. Additionally, as the sample was limited to primary schools, the findings may not reflect the challenges faced by secondary schools. Excluding nine schools with no food outlets within the catchment area may have biased results towards more food–dense environments and reduced representation of food deserts. Different deprivation measures capture distinct dimensions of inequity and operate at varying spatial and conceptual scales. School–level measures, such as the EQI and school decile, reflect characteristics of the enrolled student population and funding context rather than the surrounding built environment. As schools participating in the Ka Ora, Ka Ako/Free and Healthy School Lunch Programme were excluded, highly disadvantaged schools may have been underrepresented in the study sample, reducing variability in these school-level measures and potentially limiting the ability to detect associations with food outlet density. In contrast, area-level deprivation measures such as the NZDep score more directly capture characteristics of the neighbourhood environment in which food outlets are located. The differing associations observed across deprivation measures may therefore reflect both these conceptual differences and the composition of the study sample. Schools choosing to participate may have differed from those that did not, which could have influenced the findings and limited their generalisability. As the school menus were self-reported, there is a potential for respondent bias or omission of menus/menu items. Food outlet data were collected at a single point in time, which may not reflect temporal variations such as new store openings or closures, especially in rapidly changing commercial areas. Additionally, Google’s Places API only captures food outlets registered on Google, which may omit transient or unregistered outlets within the search area. Additionally, inaccuracies in the recorded location, registration status or classification of food outlets within Google’s database may have resulted in omission of outlets. As the generalised linear model analyses did not include school-level demographic covariates, the reported associations should be interpreted as unadjusted estimates and may be subject to residual confounding. A further limitation is that the analyses assumed independence of observations and did not account for potential spatial autocorrelation. Schools in close geographic proximity may share similar food environment and socio-economic characteristics, which may have affected the precision of the estimated associations. Although all efforts to accurately categorise food outlets were utilised, including Google images, web searches and social media, manual categorisation of food outlets may have introduced bias in the findings with regard to ambiguous food retailers such as cafés which also provided takeaways. Walking distance has been described anywhere between 200 m and 2 km in the literature, and while a 1·6-km radius was applied to all schools included to identify the total number of food outlets, this radius is based on geographic distance, not necessarily utilising a walking path, which may be different to actual kilometres travelled by students. Sensitivity analyses using alternative buffer sizes were not conducted; therefore, findings may differ if smaller or larger definitions of walkable distance were applied. Furthermore, this study did not examine how the density of food outlets or the composition of school canteen menus translates to actual student purchasing and consumption behaviours, which is a valuable direction for future research and could provide further insights into the individual implications of obesogenic environments.
Conclusion
Our findings indicate that the food environment surrounding NZ primary schools is suboptimal, with a high density of unhealthy food outlets, especially in areas of greater socio-economic deprivation, contributing to an increasingly obesogenic environment. There was only a weak association between external food outlet density and the composition of school canteen menus, suggesting that school-level factors such as policy strength, prioritisation of healthy food and drink and funding are likely to play a more important role in the composition of school canteen menus. Health promotion initiatives like HAL have the potential to improve the school food environment but require larger investment in the health promotion workforce and greater government support. To support healthier nutrition behaviours among children, efforts should focus on implementing robust internal school food policies, as well as exploring wider systemic interventions such as zoning regulations to limit children’s exposure to unhealthy food environments.
Supplementary material
For supplementary material accompanying this paper, visit https://doi.org/10.1017/S1368980026103450.
Acknowledgements
The authors acknowledge the support of the Massey University research team contracted to evaluate the HAL initiative and their work in collecting the menus and supplementary school details used for this analysis.
Authorship
D.P., A.A. and C.W. conceptualised the study; S.K. created the code, collected data through Google’s Places API and created map visualisations of food outlets; D.P. categorised food outlets and school canteen menus and performed data analysis. D.P. created figures and wrote the manuscript; S.K., A.A. and C.W. edited and reviewed the manuscript. All authors read and approved the final manuscript.
Financial support
This research uses data from the HAL evaluation, conducted by Massey University (A.A. is the principal researcher) and funded by Sport New Zealand, the Ministry of Health and the Ministry of Education.
Competing interests
The authors declare no conflict of interest.
Ethical standards
Ethics approval for the HAL evaluation was granted by Massey University Human Ethics Committee, Northern (NOR 20/07).



 Open access

