Implications
Blood metabolite and hormone concentrations are indicative of metabolic status, but blood sampling and analysis is invasive and time-consuming. Monitoring behavior can be done automatically, and behaviors may also be used as indicators of metabolic status. A better insight into relationships between metabolic status and behavior may improve the interpretation of the behavior of dairy cows in early lactation. Moreover, such associations can facilitate the interpretation of automatically recorded behavior to monitor the health of individual cows in early lactation.
Introduction
Diseases such as ketosis, retained placenta, metritis, mastitis, milk fever, displaced abomasum, lameness and impaired fertility result in a high disease incidence in the early lactation of dairy cows (Drackley, Reference Drackley1999; Ingvartsen et al., Reference Ingvartsen, Dewhurst and Friggens2003). In addition, disease events in early lactation may affect milk production performance in later lactation including total lactation yield (Fourichon et al., Reference Fourichon, Seegers, Bareille and Beaudeau1999). Diseases in early lactation are often related with the negative energy balance (EB) of dairy cows during this period (Collard et al., Reference Collard, Boettcher, Dekkers, Petitclerc and Schaeffer2000; Ingvartsen et al., Reference Ingvartsen, Dewhurst and Friggens2003). The negative EB in early lactation is caused by insufficient energy intake to support the high milk yield. A negative EB is related with an altered metabolic status, indicated by lower glucose, insulin and IGF-1 concentrations in plasma, and greater free-fatty acid (FFA), β-hydroxybutyrate (BHB) and growth hormone (GH) concentrations in plasma (Fenwick et al., Reference Fenwick, Llewellyn, Fitzpatrick, Kenny, Murphy, Patton and Wathes2008).
Plasma metabolites and hormones can be indicators of metabolic status (Butler et al., Reference Butler, Marr, Pelton, Radcliff, Lucy and Butler2003), but blood sampling is invasive and time-consuming. Monitoring behavior is less invasive. Moreover, behavior such as feeding time and feeding rate, rumination time and steps are increasingly collected using sensors to indicate, for instance, heat or the moment of calving (Reith et al., Reference Reith, Brandt and Hoy2014). Changes in lying, walking and feeding behavior of dairy cows have been associated with diseases (Edwards and Tozer, Reference Edwards and Tozer2004) such as lameness (González et al., Reference González, Tolkamp, Coffey, Ferret and Kyriazakis2008), metritis (Urton et al., Reference Urton, von Keyserlingk and Weary2005) or a displaced abomasum (Van Winden et al., Reference Van Winden, Jorritsma, Müller and Noordhuizen2003). It can be hypothesized that lying, walking or feeding behavior is not only indicative for disease, but also for metabolic status of dairy cows in early lactation. A previous study reported that cows with a lower plasma FFA concentration had a greater walking activity postpartum, compared with cows with a greater plasma FFA concentration (Adewuyi et al., Reference Adewuyi, Roelofs, Gruys, Toussaint and van Eerdenburg2006). In addition, cows with ketosis had a lower feed intake, feeding time, meal time and fewer meals and visits to the feeder than cows without ketosis (González et al., Reference González, Tolkamp, Coffey, Ferret and Kyriazakis2008). To our knowledge, relationships between behavior and other plasma metabolites and metabolic hormones have not been described previously.
Shortening or omitting the dry period improves the EB and metabolic status through a lower milk yield and an increased or similar feed intake after calving (Rastani et al., Reference Rastani, Grummer, Bertics, Gümen, Wiltbank, Mashek and Schwab2005; Van Knegsel et al., Reference Van Knegsel, Hammon, Bernabucci, Bertoni, Bruckmaier, Goselink, Gross, Kuhla, Metges, Parmentier, Trevisi, Tröscher and Van Vuuren2014a). A previous study showed that a better EB after short or no dry period was weakly correlated with longer lying time, more feeding behavior and higher feed intake (Kok et al., Reference Kok, Van Hoeij, Tolkamp, Haskell, Van Knegsel, De Boer and Bokkers2016). It can be hypothesized, however, that metabolic status may better reflect cow health and feelings than the EB, because metabolic status better reflects the degree to which the animal can cope with the catabolic state that is typical for early lactation (Van Knegsel et al., Reference Van Knegsel, Remmelink, Jorjong, Fievez and Kemp2014b).
The aim of this study was to analyze the associations between metabolic status, based on plasma metabolites and hormones, and lying and feeding behavior, motion index and steps of dairy cows. To address this aim, metabolic status and behavior were recorded in an experiment with dairy cows in early lactation after a 0-day or 30-day dry period. The current study monitored dairy cows in week 4 after calving to limit the direct effect of the calving process and start of lactation on behavior, and maximize the contrast in EB of cows with different dry period lengths (Van Knegsel et al., Reference Van Knegsel, Hammon, Bernabucci, Bertoni, Bruckmaier, Goselink, Gross, Kuhla, Metges, Parmentier, Trevisi, Tröscher and Van Vuuren2014a). Moreover, lying time was expected to be lowest in week 4 of lactation (Maselyne et al., Reference Maselyne, Pastell, Thomsen, Thorup, Hänninen, Vangeyte, Van Nuffel and Munksgaard2017).
Material and methods
Animals and housing
The Institutional Animal Care and Use Committee of Wageningen University & Research approved the experimental protocol in compliance with the Dutch law on Animal Experimentation (protocol no. 2014125). The experiment was originally designed to study the effects of dry period length on metabolic status (Van Hoeij et al., Reference Van Hoeij, Dijkstra, Bruckmaier, Gross, TJGM, Remmelink, Kemp and Van Knegsel2017). The experiment was conducted at the Dairy Campus research herd (Lelystad, The Netherlands) between 27 January 2014 and 26 August 2015. The research herd was composed of 400 lactating Holstein cows. Cows were selected based on: (1) being bred with a Holstein sire, (2) expected calving interval <490 days, (3) daily milk yield >16 kg at 90 days before the expected calving date and (4) no clinical mastitis or high SCC (≥250 000 cells/ml) at the final two test-days before drying off. All cows were housed in the same free-stall barn, which had concrete slatted floors, and cubicles (1.25×2.20 m) fitted with rubber mattresses (4 cm thick) covered with sawdust. Stocking density was maintained at 7 m2 per cow, with one cow per cubicle. Cows were milked twice daily at ~0600 and 1700 h. Lying behavior, steps and motion index of cows were recorded for 6 complete days (Friday till Wednesday) in the 4th week after calving (i.e. week 4 after calving), because of limited sensor availability and changing of sensors on Thursdays.
Experimental design
In total, 130 cows entered the experiment, including six cows that entered twice. To obtain a balanced distribution of cows across treatments, cows were blocked according to the expected calving date, milk yield in the previous lactation and parity (2, ⩾3) in the subsequent lactation. Within each group of three cows, two cows were assigned randomly to a dry period length treatment of 0 days (0-day DP) and one cow to a dry period length treatment of 30 days (30-day DP). Within the group of cows with a 0-day DP, cows were assigned randomly to either a low level of concentrate based on the energy requirement for their expected milk yield (LOW) or a standard (STD) level of concentrate based on the energy requirement for the expected milk yield of cows after a 30-day DP (Van Knegsel et al., 2014). Cows with a 30-day DP were fed an STD level of concentrate, based on the requirement for their expected milk yield. This resulted in the following three treatment groups: cows with a 30-day DP fed the STD level of concentrate required for their expected milk yield (30-day DP(STD)), cows with a 0-day DP fed the same STD concentrate level as cows with a 30-day DP (0-day DP(STD)) and cows with a 0-day DP fed a LOW concentrate level (0-day DP(LOW)). Preliminary statistical analyses showed no effect of concentrate level within the 0-day DP treatment on feeding behavior, lying behavior, steps or motion index. Concentrate level was therefore excluded from further analyses in this study. Lying behavior, steps and motion index were only measured for 81 of 130 cows. The final data set for this study consisted of milk production, EB, BW, feed intake, plasma metabolite and metabolic hormone concentrations, and lying behavior, steps and motion index data of 81 unique cows in week 4 postpartum (n=53 for 0-day DP and n=28 for 30-day DP). Basal lactation ration, concentrate composition and feeding strategy were reported previously (Van Hoeij et al., Reference Van Hoeij, Dijkstra, Bruckmaier, Gross, TJGM, Remmelink, Kemp and Van Knegsel2017).
Measurements
Behaviors
Measurement of behaviors was described earlier (Kok et al., Reference Kok, Van Hoeij, Tolkamp, Haskell, Van Knegsel, De Boer and Bokkers2016). In short, feeding behavior was measured in week 4 postpartum. Basal lactation ration was provided and its daily intake was measured individually using roughage intake control (RIC) feeders (Insentec, Marknesse, the Netherlands). The stocking density was two cows per trough. The actual quantity of concentrate dispensed (kg/day) was recorded by the computerized feeder (Manus VC5; DeLaval, Steenwijk, the Netherlands). For each visit to a feeder, RIC feeders recorded cow identity, the start time and end time (hh:mm:ss) of the visit and the start weight and end weight of the feed in the feeder to the nearest 0.1 kg. Visits were clustered into meals based on the interval length between visits (Yeates et al., Reference Yeates, Tolkamp, Allcroft and Kyriazakis2001; Tolkamp et al., Reference Tolkamp, Friggens, Emmans, Kyriazakis and Oldham2002), with a threshold of 20.9 min between meals (Kok et al., Reference Kok, Van Hoeij, Tolkamp, Haskell, Van Knegsel, De Boer and Bokkers2016). Feeding behaviors used for analyses were the average daily duration for 6 days of meals (meal time, min/day), average daily number of visits (visits, n/day), the average daily number of meals (meals, n/day) and the secondary variables daily feed intake (kg dry matter (DM)/day) and feeding rate (kg/min) that were derived from these variables.
Lying behavior, steps and motion index were recorded in week 4 postpartum with triaxial accelerometers (IceQube; IceRobotics, South Queensferry, UK). Lying behavior is recorded when the hind leg is in a horizontal position; the step count measures the number of times the animal lifts its leg up and places it back down again. Lying bouts <33 s were discarded as erroneous (Kok et al., Reference Kok, van Knegsel, van Middelaar, Hogeveen, Kemp and de Boer2015). The step count was used as an indicator for walking activity. Motion index is a measure of the overall acceleration measured by the sensor in all three axes. Sensors were attached and detached to the hind leg on Thursdays between 1000 and 1200 h. Means of lying bouts, lying time, steps and motion index per cow per day over 6 consecutive days were used for the analysis in week 4 of lactation.
Milk yield and milk composition
Milk yield was recorded daily in week 4 postpartum. Milk samples for fat, protein and lactose analysis (ISO 9622; Qlip, Zutphen, the Netherlands) were collected four times per week (Tuesday afternoon, Wednesday morning, Wednesday afternoon and Thursday morning) and were analyzed as a pooled sample per cow per week. Fat-and-protein-corrected milk (FPCM) was calculated as:
 $$\eqalign{{\rm FPCM} &{\equals}\left( {{\rm 0}{\rm .337{\plus}0}{\rm .116{\times}fat}\,{\rm percentage}}{\plus} 0{\rm .06} \right \cr &\quad {\times} {\rm protein}\,{\rm percentage} \right) {\rm {\times}milk}\,{\rm yield}\right \cr &\quad \,\left( {{\rm Centraal \ Veevoederbureau, <xref ref-type="bibr" rid="ref500">2016</xref>}} \right)$$
Body weight and energy balance
Body weight was recorded daily before each milking and averaged for week 4 of lactation. Energy balance was calculated per week, according to the Dutch net energy (NE) system for lactation (VEM) (Van Es, Reference Van Es1975), as the difference between energy intake and energy requirements for maintenance and milk yield (1000 VEM=6.9 MJ of NE). According to the VEM system, the daily requirement for maintenance is 42.4 VEM/kg0.75 BW per day and the requirement for milk yield is 442 VEM/kg FPCM (Van Es, Reference Van Es1975). Energy intake and EB are expressed in kJ/kg0.75 BW per day (Van Es, Reference Van Es1975).
Blood collection and analysis
Blood was collected on Thursday in week 4 postpartum. Blood was collected after the morning milking, between 3 and 1 h before the morning feeding. Blood (10 ml) was collected from the coccygeal vein into evacuated EDTA tubes (Vacuette; Greiner BioOne, Kremsmunster, Austria). Blood samples were kept on ice before centrifugation for plasma isolation (3000×g for 15 min, 4°C). Plasma samples were stored at −20°C. Concentrations of FFA and BHB were measured enzymatically using kit no. 994–75409 from Wako Chemicals (Neuss, Germany) and kit no. RB1007 from Randox Laboratories (Ibach, Switzerland), respectively (Graber et al., 2012). Plasma glucose concentration was measured using kit no. 61269 from BioMerieux (Marcy l’Etoile, France) (Graber et al., 2012). Plasma insulin concentration was measured using kit no. PI-12K from EMD Millipore Corporation (Billerica, MA, USA). Plasma IGF-1 concentration was measured using kit no. A15729 from Beckman Coulter (Fullerton, CA, USA). Plasma GH concentration was measured by radioimmunoassay as described previously (Vicari et al., Reference Vicari, van den Borne, Gerrits, Zbinden and Blum2008).
Statistical analyses
The natural logarithm of the plasma FFA, BHB and GH concentration was calculated to approximate normal distribution of these variables and was used in all statistical analyses. To evaluate the normality of residuals, a normality test was used in data distribution (PROC UNIVARIATE), and skewness between −1 and 1, kurtosis between −2 and 2 and a non-significant Shapiro–Wilk test were used as criteria for normality. To analyze correlations of plasma metabolites and hormones (FFA, BHB, glucose, insulin, IGF-1 and GH) with dry matter intake (DMI), feeding behavior, lying behavior, steps and motion index, a Pearson correlation was used (PROC CORR; SAS 9.3, SAS Institute Inc. (2011)). Pearson’s correlation analysis was also used to analyze correlations among the different plasma metabolites and hormones.
Because in the current study most metabolites and hormones were correlated (Table 1b), as a second step, cluster analysis with the Ward method was performed using plasma FFA, BHB, glucose, insulin, IGF-1 and GH concentration as explanatory variables (PROC CLUSTER). Based on the cubic clustering criterion, pseudo F statistic and pseudo t-squared, cows were clustered in four clusters using the tree procedure (PROC TREE). The cluster with the very good metabolic status included only six cows that had a 0-day DP, a 12 kg lower average milk yield and lower feed intake than other clusters. Because of the limited number of animals and the extremely low milk production in this cluster, the cluster with a very good metabolic status was excluded from the analysis. Clusters with poor, average and good metabolic status were compared.
Pearson’s correlation coefficients (P<0.05) (a) of plasma metabolites with fat-and-protein corrected milk (FPCM) yield, dry matter intake (DMI), energy balance (EB), feeding rate, number of meals and visits, meal time, lying time and bouts, steps and motion index; (b) among plasma free-fatty acids (FFA), β-hydroxybutyrate (BHB), glucose, insulin, IGF-1 and growth hormone (GH) concentrations in dairy cows

Ns=not significant.
1 FFA is analyzed using the natural logarithm of FFA, BHB is analyzed using the natural logarithm of BHB and GH is analyzed using the natural logarithm of GH.
*P<0.05, **P<0.01.
To evaluate the plasma concentration of metabolites and hormones, FPCM yield (kg/day), EB (kJ/kg0.75∙per day) and BW for cows with different metabolic status, a GLM was used (PROC GLM). The independent variable was cluster:
Y i=clusteri + ε i
where clusteri indicates the mean of cluster i (i=good, average or poor) and ε i indicate the random residual. To evaluate DMI, feeding behavior, lying time, steps and motion index for cows with different metabolic status, the GLM was extended with dry period length (0-day DP or 30-day DP) and parity (2 or ⩾3) as dependent variables.
y ijkl=clusteri + DPj + parityk + ε ijk
where DPj indicates the DP length (i= 0-, or 30- DP) and parityk indicates the parity of the cow (j=parity 2, or ⩾3).
The model was analyzed using a backward elimination procedure with a stay-in P-value of <0.05 in the type III Wald test.
Results
Correlations between plasma metabolites and hormones and behavioral traits
The average daily FPCM yield was negatively correlated with plasma glucose, insulin and IGF-1, and positively with plasma FFA, BHB and GH (P<0.05) (Table 1a). Dry matter intake was negatively correlated with plasma FFA and GH, and positively with plasma glucose and IGF-1 (P<0.05). Energy balance was negatively correlated with the plasma FFA, BHB and GH, and positively with plasma glucose, insulin and IGF-1 (P<0.05). Feeding rate was negatively correlated with plasma GH, and positively with plasma glucose (P<0.05). A number of meals per day was negatively correlated with plasma FFA and GH. Number of visits to the feeder was negatively correlated with plasma FFA and BHB, and positively with plasma glucose and IGF-1 (P<0.05). Meal time and lying time were negatively correlated with plasma FFA, and lying time was positively correlated with plasma IGF-1 (P<0.01). Steps and motion index were negatively correlated with plasma FFA and BHB (P<0.05).
The plasma FFA concentration was negatively correlated with the plasma glucose, insulin and IGF-1, and positively with the plasma BHB and GH (P<0.01) (Table 1b). The plasma BHB concentration was negatively correlated with the plasma glucose and insulin concentration (P<0.05). The plasma glucose concentration was negatively correlated with the plasma GH concentration, and positively with the plasma insulin and IGF-1 concentration (P<0.05). The plasma IGF-1 concentration was negatively correlated with the plasma GH concentration (P<0.01).
Relation between metabolic status and feeding and lying behavior, steps and motion index
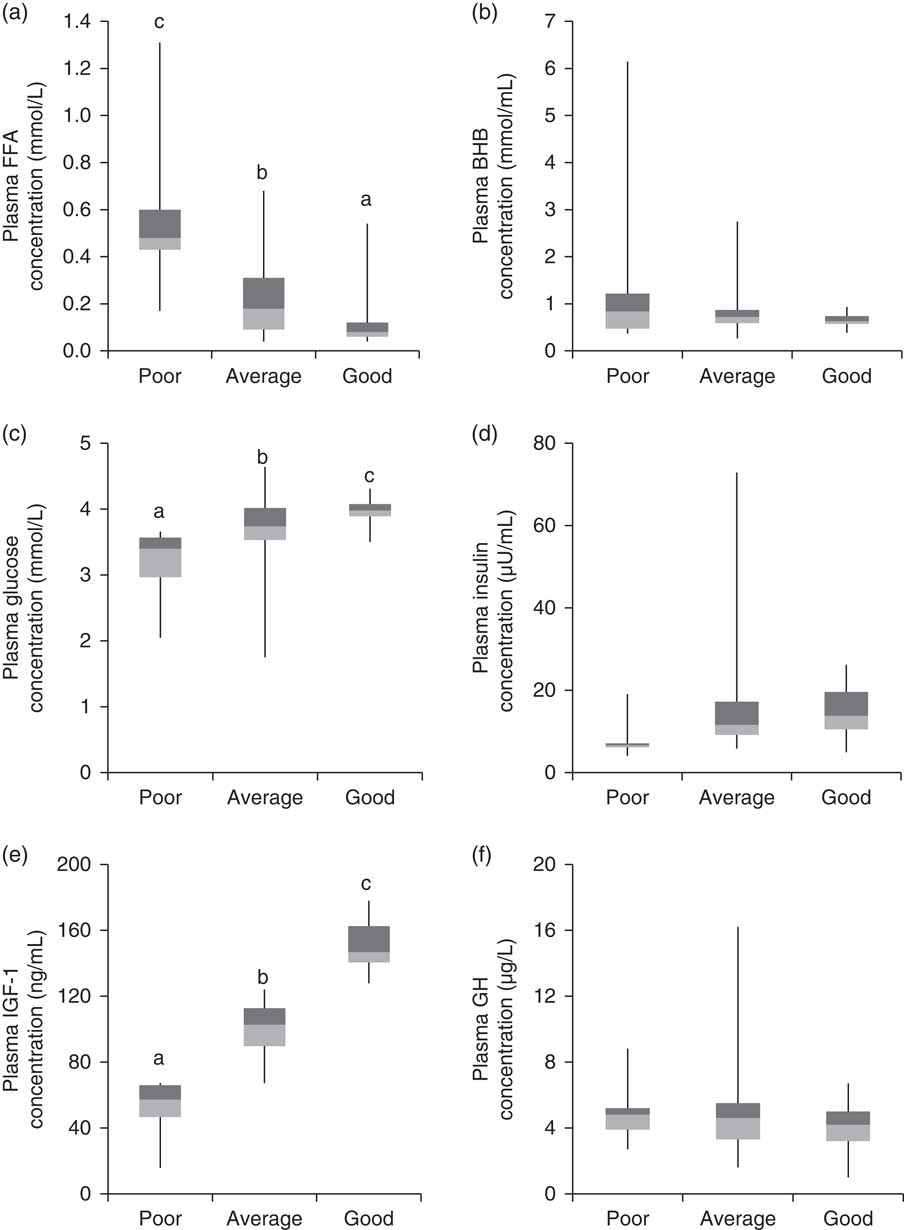
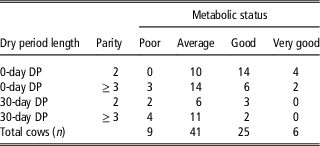
Cows were clustered for metabolic status based on their plasma FFA, BHB, glucose, insulin, IGF-1 and GH concentration in week 4 postpartum. This resulted in four groups of cows with a poor, average, good or very good metabolic status. Cows with a poor, average or good metabolic status had a 0-day or 30-day DP length, and parity 2 or ⩾3 (Table 2). All six cows with a very good metabolic status had a 0-day DP length and were not included in further analyses. Cows with a good metabolic status had lower plasma FFA concentration (Figure 1a), and greater plasma glucose (Figure 1c) and IGF-1 concentration (Figure 1e) than cows with average or poor metabolic status (P<0.01) (Table 3). Cows with an average metabolic status had lower plasma FFA and greater plasma glucose and IGF-1 concentrations than cows with poor metabolic status. Cows with a good metabolic status tended to have a lower plasma BHB (Figure 1b) and greater plasma insulin (Figure 1d) than cows with a poor metabolic status (P<0.10). Plasma IGF-1 increased with metabolic status (adjusted R 2: 0.82, P<0.01; Figure 1e). Energy balance increased with metabolic status (P<0.01). Cows with a good metabolic status tended to have lower FPCM yield than cows with a poor or average metabolic status (P<0.10). Body weight did not differ between cows with different metabolic status.
The plasma (a) free-fatty acids (FFA), (b) β-hydroxybutyrate (BHB), (c) glucose, (d) insulin, (e) IGF-1 and (f) growth hormone (GH) concentration for cows clustered for metabolic status based on plasma FFA, BHB, glucose, insulin, IGF-1, and GH concentration. Values represent the minimum, first quartile, median, second quartile and maximum. a,b,cValues with different symbols differ (P<0.05).

Number of cows in different clusters based on the plasma free-fatty acid (FFA), β-hydroxybutyrate (BHB), glucose, insulin, IGF-1 and bovine growth hormone (GH) concentration

DP=dry period.
Plasma metabolite and metabolic hormone concentrations in week 4 postpartum for cows with different metabolic status after a 0- or 30-day dry period

FFA=free-fatty acids; BHB, β-hydroxybutyrate; GH=growth hormone; FPCM=fat-and-protein corrected milk; EB=energy balance.
Metabolic status was based on the plasma FFA, BHB, glucose, insulin, IGF-1 and GH concentration. Values are presented as LSM and pooled SE (SEp).
a,b,cValues with different superscripts differ (P<0.05).
1 FFA, BHB and GH were log-transformed for analyses, but are shown as actual values with confidence intervals.
Cows with good or average metabolic status had greater DMI and basal ration intake than cows with a poor metabolic status (P<0.01) (Table 4). Cows with a good metabolic status had more meals per day than cows with an average or poor metabolic status (P<0.05). Cows with a good metabolic status tended to have a longer lying time than cows with a poor metabolic status (P<0.10). Irrespective of the metabolic cluster, cows with a 0-day DP had greater DMI (21.9±0.3v20.5±0.5 kg/day), basal ration intake (15.0±0.3v.13.5±0.4 kg DM/day) and visits to the feeder (29.0±1.5v.24.2±1.9/day) than cows with a 30-day DP (P<0.05). Cows of parity 2 had a lower feeding rate (0.20±0.01v.0.24±0.01 kg/min), and more visits to the feeder (29.7±1.7v.23.1±1.6/day), longer meal times (233±9v.195±9 min/day) and more steps (1280±57v.1085±56/day) and motion index (5234±233v.4464±230) (P<0.01) than cows with parity ⩾3.
Behavior in week 4 postpartum of cows with different metabolic status after a 0- or 30-day dry period

C=cluster; DP=dry period length; P=parity; DM=dry matter.
Metabolic status was based on the plasma free-fatty acids, β-hydroxybutyrate, glucose, insulin, IGF-1 and bovine growth hormone concentration. Values are presented as LSM and pooled SE (SEp).
a,b,cValues with different superscripts differ (P<0.05).
Discussion
The aim of this study was to analyze the relationships between metabolic status, based on plasma metabolites and metabolic hormones, and feeding behavior, lying behavior, steps and motion index of dairy cows in week 4 postpartum. First, Pearson’s correlation analysis was used to correlate metabolites and metabolic hormones with behavior. In particular, plasma FFA concentration was related to the behavioral indicators. Dry matter intake, number of meals and visits to the feeder, meal times, lying times, steps and motion index were all lower at a greater plasma FFA concentration. Plasma BHB, glucose, insulin, IGF-1 and GH concentration were related to only three or fewer behavioral indicators, and the strength of these correlations was generally lower than between FFA concentration and behavioral indicators. This seems to indicate that cows with a greater FFA concentration, in particular, have a lower feed intake, partly explained by lower feed intake related behavior and lower activity. Our results are in-line with previous studies that found that cows with a greater plasma FFA concentration have lower feed intake (Waterman et al., Reference Waterman, Schwalm and Schultz1972; Lean et al., Reference Lean, Farver, Troutt, Bruss, Galland, Baldwin, Holmberg and Weaver1992) and lower walking activity (Adewuyi et al., Reference Adewuyi, Roelofs, Gruys, Toussaint and van Eerdenburg2006). Because in the current study most metabolites and hormones were correlated (Table 1b), as a second step, cluster analysis was performed to cluster cows for metabolic status based on their plasma FFA, BHB, glucose, insulin, IGF-1 and GH concentration. Cows were clustered in four groups for poor, average, good or very good metabolic status. Plasma IGF-1 concentration seemed to have the largest impact on clustering (R 2=0.82), followed by plasma FFA concentration (R 2=0.30) and glucose (R 2=0.23). Correlations with individual metabolites and metabolic hormones and behavior, however, indicated that plasma FFA concentration had more and stronger correlations with feeding behavior, lying behavior, steps and motion index than IGF-1. This might indicate that high plasma FFA is more related to behavior and feelings in week 4 of lactation than plasma IGF-1, possibly because cows did not recover from the catabolic state at this time.
To our knowledge, no other studies have directly related metabolic status with behavioral parameters. However, previous studies evaluated the relationships between disease events in early lactation and metabolic status and reported plasma metabolites for the diseased and non-diseased cows. These studies reported that cows with a metabolic disease, metritis or mastitis had lower metabolic status as reflected by a greater plasma FFA, BHB and haptoglobin, and lower plasma calcium concentration, than non-diseased cows (Soriani et al., Reference Soriani, Trevisi and Calamari2012). In addition, cows with metabolic disease in previous studies had lower daily feeding time (Urton et al., Reference Urton, von Keyserlingk and Weary2005), decreased activity and rumination (Soriani et al., Reference Soriani, Trevisi and Calamari2012, Stangaferro et al., Reference Stangaferro, Wijma, Caixeta, Al-Abri and Giordano2016), compared with non-diseased cows. In another study, cows with ketosis had lower feed intakes, feeding times, meal times and fewer meals and feeder visits than cows without ketosis (González et al., Reference González, Tolkamp, Coffey, Ferret and Kyriazakis2008). The lower reported DMI, and number of meals and visits to the feeder in these earlier studies are in accordance to our findings. In contrast, in our study, steps, motion index and meal time were not different among cows with different metabolic status. It should, however, be noted that in previous studies cows were diseased and likely showed sickness behavior, whereas cows in our study were not clinically diseased. The current study illustrates how behavior measures like a number of meals per day and lying time can be an indicator for metabolic status, even in case of no clinical disease.
On average, cows with a good metabolic status had a lower plasma FFA concentration and greater plasma glucose and IGF-1 concentrations compared with cows with an average or poor metabolic status. Better metabolic status was associated with greater DMI, basal ration intake and a number of meals, and tended to be associated with a longer daily lying time. These behaviors can be automatically recorded and may be reliable indicators of metabolic status. A number of visits to the feeder can be measured as proximity to the feed bunk using sensors, and can be processed into a number of meals. However, these sensors are unlikely to be used at present in commercial settings. Meanwhile, lying time can be recorded with commercially available sensors that are widely used for estrus detection (Rutten et al., Reference Rutten, Kamphuis, Hogeveen, Huijps, Nielen and Steeneveld2017). Lying time may, therefore, be a useful indicator for metabolic status, although the relation should be studied further, as well as potential interactions with other factors such as stocking density. Reduced lying time may be indicative of restlessness or discomfort, for example, because of udder pressure (Huzzey et al., Reference Huzzey, Von Keyserlingk and Weary2005; Bertulat et al., Reference Bertulat, Isaka, de Prado, Lopez, Hetreau and Heuwieser2017).
In the current study, plasma FFA concentration had stronger correlations and plasma IGF-1 concentration had similar correlations with behavior in week 4 of lactation, compared with correlations between EB and behavior in our previous study (Kok et al., Reference Kok, Van Hoeij, Tolkamp, Haskell, Van Knegsel, De Boer and Bokkers2016). These results imply that plasma FFA has a stronger relation with behavior than calculated EB. It could be hypothesized, therefore, that plasma metabolites like FFA may better reflect cow health and feelings than the EB itself, because metabolic status better reflects the degree to which the animal can cope with the catabolic state typical in early lactation. In addition, it could be hypothesized that the relation between behavior and plasma metabolites may even be stronger in cows with a conventional dry period due to a more severe NEB and poorer metabolic status, than in cows with a 0-day or 30-day dry period.
Relations between metabolic status and behavior can be different for other weeks in early lactation. Daily lying time, for example, was shown to decrease in the weeks after calving, with the lowest lying time in week 4, after which lying time gradually increased and then leveled off at about 12.5 h per day (Maselyne et al., Reference Maselyne, Pastell, Thomsen, Thorup, Hänninen, Vangeyte, Van Nuffel and Munksgaard2017). Plasma FFA concentration, in contrast, peaks in the 1st week after calving (Chen et al., Reference Chen, Gross, van Dorland, Remmelink, Bruckmaier, Kemp and van Knegsel2015). Together, these two patterns imply that associations between plasma FFA concentration and daily lying time are different over time. Variable relations between metabolic status and behavior may be explained by the duration of the catabolic state and interactions with other motivations. For example, when cows were given access to feed and a lying place for only 12 h/day for a period of 2 weeks, they prioritized lying time over feed intake and consequently lost weight (Munksgaard et al., Reference Munksgaard, Jensen, Pedersen, Hansen and Matthews2005). The authors hypothesized that, if the experiment had lasted longer, a more severe weight loss could shift these behavioral time budgets toward feeding at the cost of lying time.
The application of different dry period lengths was used to create variation in metabolic status between cows in early lactation. A potential drawback of this method could be that short or no dry period affect behavior independent of metabolic status. However, the model to evaluate the effect of metabolic status on behavior corrected for effects of dry period length and parity. Correlations between metabolites and metabolic hormones and behavior were performed without dry period length and parity included as covariates in the model. Including dry period length and parity in a GLM to evaluate the effects of a plasma metabolite on behavior (results not shown) resulted in similar relations between plasma metabolites and behavior compared with the correlations presented in Table 1a.
The direction of causation between plasma metabolites or metabolic status with behavioral traits in dairy cows is unclear. For example, less feed-directed behavior and activity may result in lower DMI and more body fat mobilization, which is related to a greater plasma FFA and BHB concentration and a lower glucose and insulin concentration (Lean et al., Reference Lean, Farver, Troutt, Bruss, Galland, Baldwin, Holmberg and Weaver1992). Vice versa, greater FFA concentration is related with metabolic acidosis and a feeling of discomfort that may decrease appetite and DMI (Waterman et al., Reference Waterman, Schwalm and Schultz1972; Allen et al., Reference Allen, Bradford and Oba2009).
In conclusion, better metabolic status, as indicated by plasma metabolites and metabolic hormones, in dairy cows in week 4 of lactation after a short or no dry period was associated with a greater DMI, increased feeding activity and a tendency to more time spent lying, compared with poor metabolic status. A compromised metabolic status was reflected in altered cow’s behavior in week 4 of lactation.
Acknowledgments
The authors thank DairyNL (Zuivel-NL; organization of the Dutch dairy supply chain, the Netherlands) and the Dutch Ministry of Economic Affairs (EZ, the Netherlands) for financing this study, which is part of the Public–Private Partnership ‘Sustainable Dairy Chain’ (Duurzame Zuivelketen), the Netherlands. The authors also thank Dairy Campus (Lelystad, the Netherlands), Rudi Koopmanschap and the Veterinary Physiology Group of the University of Bern (Switzerland) for their technical support and laboratory analyses during the experiment. This study was conducted as part of the PhD theses of the first two authors.
Declaration of interest
None.
Ethics statement
The Institutional Animal Care and Use Committee of Wageningen University and Research approved the experimental protocol in compliance with the Dutch law on Animal Experimentation (protocol no. 2014125).
Software and data repository resources
None.