I. INTRODUCTION
Much effort has been paid to the research of ternary metal one-dimensional (1D) vanadate nanoscale materials, which exhibits potential applications in high energy density lithium batteries, sensors and photocatalysis.Reference Filho, Ferreira, Santos, Fiho and Alves1 β-Mn2V2O7 microtubes and hollow microspheres with low-dimensional magnetic properties have been synthesized by a simple hydrothermal process by Liu et al.Reference Liu and Qian2 By the similar hydrothermal process, silver vanadateReference Holtz, Filho, Brocchi, Martins, Durán and Alves3 and bismuth vanadateReference Yu and Kudo4 nanowires have also been synthesized successfully. Krupanidhi et al.Reference Singh, Kumari, Varma and Krupanidhi5 reported the synthesis of ferroelectric bismuth vanadate (Bi2VO5.5) (BVO) nanotubes within the nanoporous anodic aluminum oxide templates by a sol–gel method. By a simple wet chemical route at room temperature, silver vanadate (β-AgVO3) nanorods with the length of 20–40 μm and diameter of 100–600 nm have been obtained by Singh et al.Reference Singh, Polychronopoulou, Rebholz and Aouadi6 Lithium vanadium oxide (LiV3O8) nanorods have been used as cathode materials for lithium ion batteries indicating the highest discharge capacity of 302 mAh/g in the range of 1.8–4.0 V. The capacity remains 278 mAh/g after 30 cycles.Reference Xu, Wang, Song, Wang, Yan and Yoshimura7 Silver vanadate nanoribbons exhibit surface-enhanced Raman scattering effect that can be used for identifying human serum transferrin and human serum apotransferrin in the concentration of 10 μM.Reference Zhou, Shao, Que, Cheng, Zhuo, Tong and Lee8 The silver vanadate nanoribbons may be used as biomonitor in such a system.
Among ternary metal vanadates, calcium vanadate exhibits application potential in optical devices, lithium batteries and electrochemical sensors owing to good optical properties, electrochemical and lithium insertion properties.Reference Jouanneau, Verbaere and Guyomard9, Reference Tashtoush, Qudah and El-Desoky10 As of date, there are only reports related to the solid-state reaction at high temperature using calcium carbonate (CaCO3) and vanadium pentoxide (V2O5) as the raw materials for the synthesis of calcium vanadate.Reference Nakajima, Isobe, Tsuchiya, Ueda and Manabe11 Whereas here are some references in the literature on bulk calcium vanadate, such reports are quite scanty relating to 1D calcium vanadate nanomaterials. Calcium vanadate nanorods with sheaf-shaped structure have been synthesized successfully.Reference Pei, Pei, Xie, Yuan, Li and Zhang12 However, the growth process of the calcium vanadate nanorods is still confusing. Calcium vanadate nanorods may also demonstrate novel properties owing to their small dimension structure for efficient electron transport. Therefore, it is important to explore the growth process of the calcium vanadate nanorods for the research of novel properties. Especially, great interest has been devoted to metal vanadates for the research of electrochemical properties that may be attributed to their high specific capacity and special crystal structure.Reference Baudrin, Laruelle, Denis, Touboul and Tarascon13–Reference Inagaki, Morishita, Hirano, Gupta and Nakajima16 Different kinds of biological molecules, such as uric acid, cysteine and catechol have been electrochemically determined by zinc oxide (ZnO) nanorods,Reference Zhang, Wang, Ai, Sun, Wan, Zhu, Xian, Jin and Yamamoto17 gold (Au) nanorodsReference Sudeep, Joseph and Thomas18 and Au/titanium dioxide (TiO2) nanorod composites,Reference Wei, Liu, Gu and Liu19 respectively showing the application potential of the nanorods for electrochemical determination of biological molecules. Tartaric acid is a kind of hydrocarboxylic acid and widely used in food, chemical industry, and pharmacology fields.Reference Kvaratskhelia and Kvaratskhelia20 Several research groups have reported the electrochemical determination of tartaric acid at different electrodes. For example, electrochemical response of tartaric acid at platinum (Pt), copper (Cu), tantalum (Ta), copper–mercury (Cu–Hg) electrodes has been analyzed.Reference Kvaratskhelia and Kvaratskhelia20 The indirect chemiluminescence (CL) determination of tartaric acid with a relative standard deviation of less than 2% has also been reported.Reference Galkwad, Silva and Bendito21 But the reliable electrochemical detection of tartaric acid using conventional electrodes has been hampered; accordingly, it is important for the accurate determination of tartaric acid to look for such conventional electrodes also. The calcium vanadate nanorods are proposed to be used as the modifying materials on glassy carbon electrode for electrochemical determination of tartaric acid.
In this article, the formation process of the calcium vanadate nanorods has been analyzed based on the morphology and phases of the samples obtained from different hydrothermal conditions. The nucleation and crystal growth combined with crystal splitting process have been proposed to explain the formation and growth of calcium vanadate nanorods. The calcium vanadate nanorods are used as the modifying materials on glassy carbon electrode for analyzing the electrochemical behaviors of tartaric acid. The calcium vanadate nanorod-modified glassy carbon electrode exhibits low detection limit of 2.4 μM and linear range of 0.005–2 mM. The analytical performance makes the calcium vanadate nanorods as potentially promising for the development of electrochemical sensors to detect tartaric acid.
II. EXPERIMENTAL SECTION
Sodium orthovanadate (Na3VO4) (AR grade, purity: ≥99.9%) and Ca(CH3COO)2·H2O (AR grade, purity: ≥99.0%) were purchased from Aladdin Reagent Co., Ltd. (Shanghai, China) and Sinopharm Chemical Reagent Co., Ltd. (Shanghai, China), respectively. All raw materials were used without further purification. In a typical process, 0.18 g Ca(CH3COO)2·H2O and 0.2 g Na3VO4 were dissolved into 60 mL distilled water. Then, the mixture was placed into a 100 mL autoclave. The autoclave was maintained at 80–180 °C for 0.5–24 h. Subsequently the autoclave was cooled in natural air. The white precipitates were filtered, washed with distilled water for several times and dried at 60 °C in air. Finally, the white calcium vanadate nanorod powders were gained.
Scanning electron microscopy (SEM) observation was performed using Nova nanoSEM FEI 430 SEM (FEI, Eindhoven, Netherlands) with a 15-KV accelerating voltage. Transmission electron microscopy (TEM) and high-resolution TEM (HRTEM) samples were prepared by putting several drops of solution with calcium vanadate nanorods onto a standard copper grid with a porous carbon film after the calcium vanadate nanorod samples were dispersed into distilled water and treated for about 10 min using supersonic wave apparatus. TEM and HRTEM observations were performed using JEOL JEM-2100 TEM (Tokyo, Japan) operating with a GATAN digital photography system. X-ray diffraction (XRD) pattern was carried out on a Bruker AXS D8 x-ray diffractometer (Karlsruhe, Germany) equipped with a graphite monochromatized Cu Kα radiation (λ = 1.5406 Å). The sample was scanned at a scanning rate of 0.05°/s in the 2θ range of 20°–80°.
The calcium vanadate nanorod suspension was prepared by dispersing 10 mg nanorods in 10 mL dimethylformamide (DMF) solvent with sufficient ultrasonication for about 1 h until a uniform nanorod suspension was obtained. Prior to modification, a glassy carbon electrode with a diameter of 3 mm was polished to a mirror with polish paper and alumina pastes of 0.5 μm, and cleaned in an ultrasonic cleaner with alcohol and water sequentially. A calcium vanadate nanorod-modified glassy carbon electrode was prepared by coating 10-μL nanorod suspension on the surface of bare electrode and allowed to evaporate liquid at room temperature.
Tartaric acid was purchased from Sinopharm Chemical Reagent Co., Ltd. (Shanghai, China), which is analytical grade. Electrochemical (EC) measurement was performed in a model CHI6046 electrochemical working station. The calcium vanadate nanorod-modified glassy carbon electrode serves as the working electrode; a platinum plate and saturated calomel electrode (SCE) serve as the counter electrode and reference electrode, respectively. All potentials are with respect to SCE. Cyclic voltammograms (CVs) were recorded in the potential range of −1.0–1.0 V at a potential scan rate of 50 mV/s in the mixed solution of 0.1 M CH3COONa–CH3COOH and tartaric acid with different concentrations. Electrochemical impedance spectroscopy (EIS) was carried out at an amplitude of 10 mV in the frequency range from 10 to 0.1 Hz with Fe (CN)63− as a probe. All measurements were carried out at room temperature.
III. RESULTS AND DISCUSSION
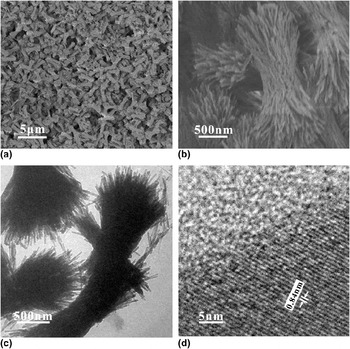
Figures 1(a) and 1(b) show the general morphology and size of the calcium vanadate nanorods with different resolutions synthesized from the hydrothermal conditions of 180 °C for 24 h. SEM observation [Fig. 1(a)] shows that the products are composed of rod-shaped nanostructures with a typical length of about 3 μm. The average diameter of the nanorods is about 50 nm [Fig. 1(b)]. The nanorods form a kind of sheaf-shaped structure with the top and bottom fanning out while the middle remains thin. The length of the sheaf-shaped structures is about 3 μm. TEM image of the calcium vanadate nanorods [Fig. 1(c)] further proves the sheaf-shaped structure. The nanorods with the diameter of about 50 nm have straight structure and smooth surface. The HRTEM image with regular lattice fringes [Fig. 1(d)] shows that the nanorods consist of good single crystalline structure. The interplanar spacing is about 0.84 nm according to the HRTEM measurement and calculation by the software of Digital Micrograph (Gatan Inc., Pleasanton, CA) applied in HRTEM, which is same as that for {100} plane of hexagonal Ca10V6O25.
Electron microscopy images of the calcium vanadate nanorods obtained from the hydrothermal conditions of 180 °C for 24 h. (a) and (b) SEM images of the calcium vanadate nanorods with different magnifications. (c) TEM image of the calcium vanadate nanorods. (d) HRTEM image of single calcium vanadate nanorod.

Obviously, the calcium vanadate nanorods have been synthesized easily by the facile hydrothermal process without any surfactants. However, the formation process of the calcium vanadate nanorods is still confusing. It is considered that the hydrothermal temperature, reaction time and raw materials have important roles on the formation and growth of the nanorods, which is also proved by other literatures.Reference Khue, Vu, Dang and Nguyen22, Reference Ma, Guo, Zhang, Zhang and Wang23 Therefore, the growth condition dependence on the morphologies, sizes, and phase transformation of the calcium vanadate nanorods has been discussed in detail to analyze the possible formation process of the calcium vanadate nanorods.
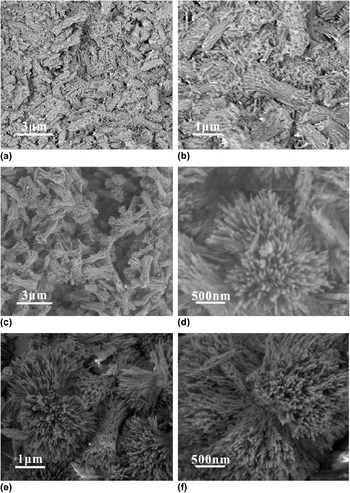
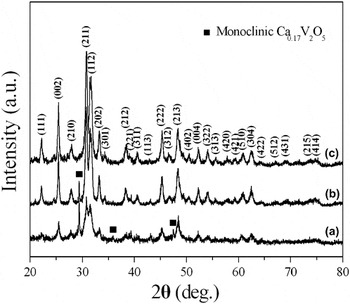
Figure 2 is the time dependence on the formation of the calcium vanadate nanorods showing the morphological evolution of the nanorods. It is obviously observed that highly complex shapes with the sheaf-like structures occur at the initial reaction stage at 180 °C for 0.5 h [Figs. 2(a) and 2(b)]. However, the length of the sheaf-like structures is about 2 μm, even smaller than 1 μm. As the reaction proceeds to 6 and 12 h, the calcium vanadate nanorods with sheaf-shaped structures are formed [Figs. 2(c)–2(f)]. The length of the sheaf-shaped structures increases to about 3 μm. However, the diameter of the calcium vanadate nanorods obtained at 180 °C for different durations is similar. Obviously, the nanorods grow mainly along the elongated direction. The time-dependence results show that the reaction time promotes the formation and growth of the calcium vanadate nanorods with sheaf-shaped structure. The phase transformation during the growth process of the calcium vanadate nanorods is shown in Fig. 3. At different growth periods of the calcium vanadate nanorods, the XRD patterns of the calcium vanadate nanorods are similar. However, the intensity of the diffraction peaks of hexagonal Ca10V6O25 phase [Joint Committee on Powder Diffraction Standards (JCPDS) card, No. 52-0649] increases obviously with the increase of the reaction time. The monoclinic Ca0.17V2O5 phase (JCPDS card, No. 26-1125) [Fig. 3(a)] forms besides the predominant Ca10V6O25 phase at the initial formation stage of calcium vanadate nanorods. The intensity of the diffraction peaks of the monoclinic Ca0.17V2O5 phase located at 2θ = 29.2°, 35.8°, and 47.5° decreases with the reaction time increasing to 12 h at 180 °C. Monoclinic Ca0.17V2O5 phase disappears and only hexagonal Ca10V6O25 phase exists in the final products with the reaction time increasing to 24 h at 180 °C. The calcium vanadate nanorods were obtained at 180 °C for different time with the same other conditions, such as raw materials and their ratio. Therefore, only reaction time contributes to the change of the XRD intensity of the products. The results show that the longer reaction time promotes the crystalline degree of the nanorods and phase transformation from monoclinic Ca0.17V2O5 to hexagonal Ca10V6O25 phase during the growth process of the calcium vanadate nanorods.
SEM images of the products synthesized at 180 °C for different time. (a) and (b) 0.5 h, (c) and (d) 6 h, (e) and (f) 12 h.

XRD patterns of the products synthesized at 180 °C for different time. (a) 0.5 h, (b) 12 h, and (c) 24 h.

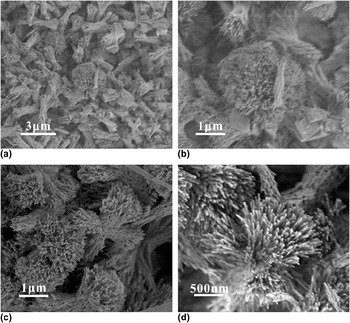
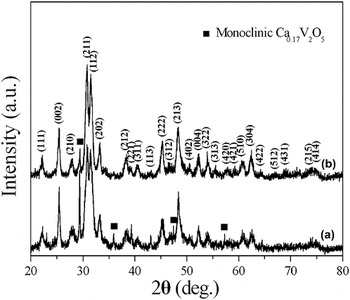
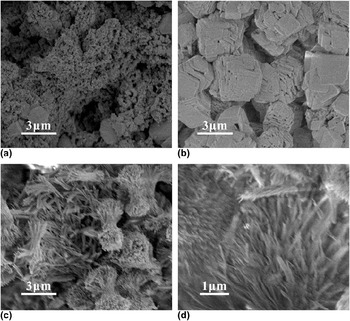
Figure 4 shows the SEM images of the products synthesized at different temperature for 24 h. Obviously, calcium vanadate nanorods with the sheaf-shaped structure and similar size can still be obtained at different hydrothermal temperature for 24 h. However, some microscale particles are also observed from the products [Figs. 4(a) and 4(b)] besides the nanorods when the hydrothermal temperature is 80 °C Figure 5 is the XRD patterns of the calcium vanadate nanorods synthesized at 80 and 120 °C, respectively, for 24 h. Obviously, the XRD patterns of the calcium vanadate nanorods are still similar. However, monoclinic Ca0.17V2O5 phase [Fig. 5(a)] also occurs when the hydrothermal temperature is 80 °C. With the hydrothermal temperature further increasing to 120 °C, the monoclinic Ca0.17V2O5 phase decreases obviously [Fig. 5(b)]. The results display that monoclinic Ca0.17V2O5 phase forms at low hydrothermal temperature and reaction time, which is the initial formation stage of the calcium vanadate nanorods. Hydrothermal temperature and reaction time play essential roles on the formation of highly crystalline calcium vanadate nanorods with high-purity hexagonal Ca10V6O25 phase.
SEM images of the products synthesized at different temperature for 24 h (a) and (b) 80 °C, (c) and (d) 120 °C.

XRD patterns of the products synthesized at different temperature for 24 h. (a) 80 °C, (b) 120 °C.

The formation of the calcium vanadate nanorods with sheaf-shaped structure may also be controlled by Ca raw materials. Figure 6 is SEM images of the products obtained from different Ca raw materials at 180 °C for 24 h. Obviously, no calcium vanadate nanorods are observed from the products synthesized using CaO and CaCO3 as the Ca raw materials, respectively [Figs. 6(a) and 6(b)]. Only microscale particles and sheet-shaped structures form. CaCO3 is difficult to be dissolved in water. CaO is slightly soluble in water forming Ca(OH)2 alkaline solution. So CaCO3 and CaO are difficult to react with Na3VO4 to form calcium vanadate crystals. It is noted that the calcium vanadate nanorods [Figs. 6(c) and 6(d)] are observed using CaCl2 as the Ca raw material. Some freestanding nanorods also exist in the products besides the sheaf-shaped structures. Similar to Ca(CH3COO)2, CaCl2 is also soluble in water and reacts with Na3VO4 to form calcium vanadate crystals, resulting in the formation of the calcium vanadate nanorods. The results show that solvable Ca raw materials have important roles on the formation of calcium vanadate nanorods.
SEM images of the products synthesized at 180 °C for 24 h using different Ca raw materials. (a) CaO, (b) CaCO3, (c) and (d) CaCl2.

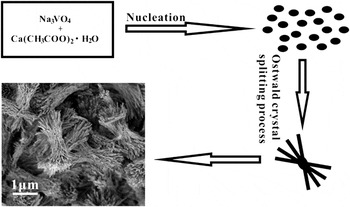
The synthesis of the calcium vanadate nanorods is free of any surfactants. Based on the above discussions, the formation and growth of the calcium vanadate nanorods with sheaf-shaped structure may be explained based on the nucleation and crystalline growth combined with crystal splitting process. The formation and growth schematic of the calcium vanadate nanorods have been demonstrated in Fig. 7. At the initial stage, such as low hydrothermal temperature and short reaction time, Ca(CH3COO)2 and Na3VO4 react to form hexagonal Ca10V6O25 phase and a small amount of monoclinic Ca0.17V2O5 phase. These mixed phases precipitate from the hydrothermal solution to form calcium vanadate cores. With the increase of the hydrothermal temperature and reaction time, calcium vanadate nanorods form according to the Ostwald nucleation and crystal growth process.Reference Katsman, Yaish, Rabkin and Beregovsky24, Reference Dubrovskii, Sibirev, Suris, Cirlin, Harmand and Ustinov25 The sheaf-shaped structures have also been obtained which can be explained by a crystal splitting process.Reference Tang and Alivisatos26 An individual crystal splits apart, forming many subindividuals with simple splitting and sheaf-shaped structure during the crystal growth. Different materials have different crystal splitting ability depending on their crystal structure. The formation of the sheaf-shaped structures requires fast crystal growth.Reference Tang and Alivisatos26 It has been suggested that the Ca10V6O25 has definite crystal splitting ability.Reference Pei, Pei, Xie, Yuan, Li and Zhang12 Fast crystal growth can lead to a situation of metastability, which is thermodynamically favorable for a large crystal to split. The splitting is possible if the oversaturation exceeds a certain critical level. Depending on the level of supersaturation, materials can take on different degrees of splitting, resulting in a number of subforms of split crystals. With the increase of the hydrothermal temperature and reaction time, monoclinic Ca0.17V2O5 phase totally transforms into hexagonal Ca10V6O25 phase, resulting in the final formation of the calcium vanadate nanorods with sheaf-shaped structures.
Schematic illustration of the formation and shape evolution of the calcium vanadate nanorods.

It has been shown that ternary oxide 1D nanomaterials may be used as modifying materials on glassy carbon electrode for electrochemical determination of biological molecules.Reference Dong, Pei, Chu and Zhang27 Calcium vanadate nanorods, as a kind of important ternary oxide 1D nanoscale material, may also exhibit good electrochemical sensing properties for the electrochemical determination of biological molecules. Among the biological molecules, tartaric acid is widely used in food and chemistry industry, pharmacology and other fields. So it would be of great significance if convenient method for the determination of tartaric acid for food, chemical industry, pharmaceutical quality and safety is developed.Reference Kvaratskhelia and Kvaratskhelia20, Reference Yan, Wang, Han, Wan and Bai28 Therefore, the calcium vanadate nanorods are attempted to be used as the modifying materials on glassy carbon electrode to research the possibility for the electrochemical determination of tartaric acid.
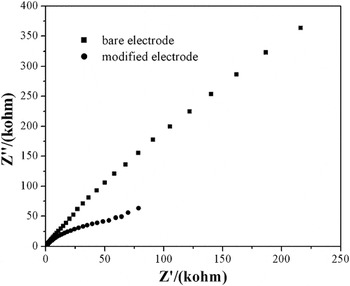
It is known that EIS is an effective tool for the research of the interface properties of modified electrodes. The semicircle diameter of the EIS equals the electron transfer resistance, which controls the electron transfer kinetics through the electrode interface.Reference Fu, Yuan, Tang, Chai and Xu29 EIS is shown in Fig. 8 so as to understand the properties of the calcium vanadate nanorods during the electrochemical sensing process of tartaric acid. The impedance spectrum of a bare glassy carbon electrode is a semicircle in all frequency domains showing that the electrode process is controlled by electron transfer process. The impedance spectrum of the calcium vanadate nanorod-modified glassy carbon electrode consists of a semicircle at high alternating current (AC) modulation frequency and a line at low AC modulation frequency. The results show that the electrode process is controlled by electron transfer process at high frequency and diffusion process at low frequency. The diameter of the Nyquist circle at the bare glassy carbon electrode is larger than that at the calcium vanadate nanorod-modified glassy carbon electrode showing that the charge transfer through the calcium vanadate nanorods is relatively facile.
Electrochemical impedance spectroscopy of a bare glassy carbon electrode and calcium vanadate nanorod-modified glassy carbon electrode. K3Fe(CN)6, 1 × 10⁻³ mol/L; KCl, 0.1 mol/L.

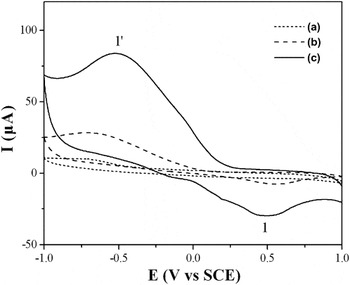
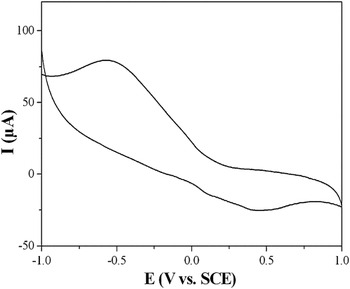
Figure 9 shows the electrochemical behaviors of tartaric acid at the bare glassy carbon electrode and calcium vanadate nanorod-modified glassy carbon electrode in 0.1 M CH3COONa–CH3COOH solution with and without 2 mM tartaric acid. Almost no CV peaks are observed from the CV curves of the bare glassy carbon electrode and calcium vanadate nanorod-modified glassy carbon electrode in 0.1 M CH3COONa–CH3COOH solution without tartaric acid. It is suggested that the calcium vanadate nanorod and the bare glassy carbon electrode have almost no electrochemical activity in 0.1 M CH3COONa–CH3COOH solution. The electrochemical behaviors are different in 0.1 M CH3COONa–CH3COOH with and without tartaric acid. One anodic CV peak (cvp1) is located at 0.48 V, and one cathodic peak (cvp1′) is located at −0.53 V, respectively. The anodic and cathodic CV peaks are only observed in 0.1 M CH3COONa–CH3COOH and 2 mM tartaric acid solution at the calcium vanadate nanorod-modified glassy carbon electrode. Therefore, it is considered that the CV peak is caused by tartaric acid. The electrochemical reaction of tartaric acid at the calcium vanadate nanorod-modified glassy carbon electrode is a semireversible process. The CVs of tartaric acid at the calcium vanadate nanorod-modified glassy carbon electrode using different initial potential scan direction and reversal potential were measured so as to analyze whether the anodic and cathodic peaks are semireversible process. It is observed that the intensity of the electrochemical CV peaks maintains similarity when changing initial potential scan direction and reversal potential. So cvp1 is the oxidation process of the products originated from the potential of cvp1′. Similar to the electrochemical behavior of tartaric acid at the CuGeO3 nanowire-modified glassy carbon electrode,Reference Cai, Pei, Yang, Pei, Fan and Fu30 calcium vanadate nanorods may participate in the reduction process of tartaric acid. Therefore, it is possible for the reduction of tartaric acid to cause deposition of tartrate at the calcium vanadate nanorod-modified glassy carbon electrode. Cvp1–cvp1′ can be assigned to oxidation and reduction process between tartaric acid and tartrate.
(a) CV of the bare glassy carbon electrode in 0.1 M CH3COONa-CH3COOH and 2 mM tartaric acid solution, scan rate, 50 mV/s. CVs of the calcium vanadate nanorod-modified glassy carbon electrode in 0.1 M CH3COONa–CH3COOH solution in absence (b) and presence (c) of 2 mM tartaric acid. Scan rate, 50 mV/s.

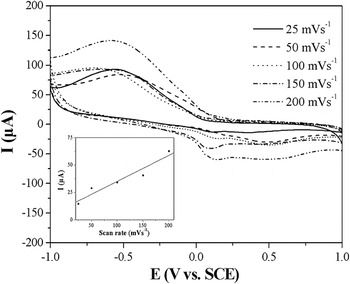
Scan rate has an important role on the electrochemical response of biological molecules at modified glassy carbon electrode.Reference Zhang, Deng, Feng, Kuang and Yang31, Reference Xia and Ning32 The CV curves of tartaric acid at calcium vanadate nanorod-modified glassy carbon electrode in the mixed solution of 0.1 M CH3COONa–CH3COOH and 2 mM tartaric acid using different scan rate have been shown in Fig. 10. With the scan rate decreasing from 50 to 25 mV/s, the intensity of the CV peaks decreases obviously. With the increase of the scan rate from 50 to 200 mV/s, the intensity of the CV peaks increases. In addition, the potential of the anodic peak of tartaric acid at the calcium vanadate nanorod-modified glassy carbon electrode shifts negatively with the increase of the scan rate. The results are different from those reported by Li et al.Reference Li and Zhang33 The anodic peak potential in the CVs of ascorbic acid in [bmim][BF4] shifted positively with the increase of the scan rate. The cathodic wave shape distorted severely when the scan rate was higher than 0.5 V/s. The effect of scan rate on the oxidation current of tartaric acid is analyzed which is shown in the bottom left part of Fig. 10. There is a nearly linear relation between scan rate and anodic current in the range of 25–200 mV/s. The results are similar to those reported by Xia et al.,Reference Xia and Ning32 which shows that the scan rate affects the intensity and position of the electrochemical CV peaks of tartaric acid at the calcium vanadate nanorod-modified glassy carbon electrode.
CVs of the calcium vanadate nanorod-modified glassy carbon electrode in the mixed solution of 0.1 M CH3COONa–CH3COOH and 2 mM tartaric acid using different scan rate. The inset in the bottom left part is the calibration plot of the intensity of the anodic peak against the scan rate.

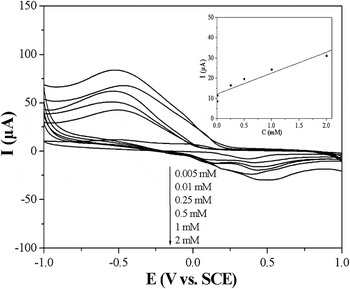
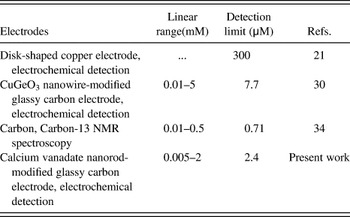
The linear range and detection limit of tartaric acid at the calcium vanadate nanorod-modified glassy carbon electrode are analyzed by measuring the CV curves of tartaric acid with the concentration of 0.005–2 mM. The results are shown in Fig. 11. The inset in the upper-right part of Fig. 11 is the calibration plot of the intensity of anodic peak with the concentration of tartaric acid. The intensity of the CV peak of tartaric acid at the calcium vanadate nanorod-modified glassy carbon electrode increases obviously with increasing the concentration of tartaric acid. The potential of the CV peak shifts to more negative direction with the decrease of the concentration of tartaric acid. The correlation coefficient is 0.997. The detection limit is 2.4 μM at a signal-to-noise ratio of 3 and linear range is 0.005–2 mM. Table I compares the linear range and detection limit of the calcium vanadate nanorod-modified glassy carbon electrode for tartaric acid determination to those using other electrodes and methods. Compared with the electrochemical responses of tartaric acid using other electrodes,Reference Galkwad, Silva and Bendito21, Reference Cai, Pei, Yang, Pei, Fan and Fu30, Reference Fu, Song and Fang34 the calcium vanadate nanorod-modified glassy carbon electrode shows a comparable detection limit and linear range.
CVs of the tartaric acid with different concentration at the calcium vanadate nanorod-modified glassy carbon electrode. CH3COONa–CH3COOH, 0.1 M, scan rate, 50 mV/s. The inset in the upper-right part is the calibration plot of the intensity of anodic peak against the concentration of the tartaric acid.

Analytical data for tartaric acid determination using different electrodes and methods.

The stability and reproducibility of the calcium vanadate nanorod-modified glassy carbon electrode are analyzed in a continuous mode. When the same calcium vanadate nanorod-modified glassy carbon electrode repeats detection tartaric acid for the 20th time in the mixed solution of 2 mM tartaric acid and 0.1 M CH3COONa–CH3COOH solution [Fig. 12], the relative standard deviation (RSD) is 9.8%. The calcium vanadate nanorods are adsorbed firmly on the glassy carbon electrode. So the stability of the calcium vanadate nanorod-modified glassy carbon electrode is good, which is considered attributable to its structure stability.
CV Of the calcium vanadate nanorod-modified glassy carbon electrode in the mixed solution of 0.1 M CH3COONa–CH3COOH and 2 mM tartaric acid recycling for 20th time. Scan rate, 50 mV/s.

IV. CONCLUSIONS
In summary, crystalline calcium vanadate nanorods with sheaf-shaped structure have been prepared via a facile hydrothermal route without any surfactants. The formation and growth of the calcium vanadate nanorods may be explained via the nucleation and crystal growth combined with crystal splitting process based on the analysis of the products synthesized from different hydrothermal conditions. The calcium vanadate nanorods can be used as the modifying materials on glassy carbon electrode for the electrochemical determination of tartaric acid. The electrochemical behavior of tartaric acid at the calcium vanadate nanorod-modified glassy carbon electrode shows that one pair of semireversible electrochemical peaks are observed. The detection limit is 2.4 μM with a linear range of 0.005–2 mM. The calcium vanadate nanorods show promising potential as the modifying materials on glassy carbon electrode for the electrochemical determination of tartaric acid or other biological molecules.
ACKNOWLEDGMENT
This work was supported by the Natural Science Foundation of Anhui Province (1208085QE98).