I. INTRODUCTION
A combination of low specific weight, good machinability and castability, great damping behavior, and high recycling potential are the reasons why magnesium alloys have attracted attentions in automotive and aerospace industries in recent years. Reference Kainer1 In particular, the use of several kinds of magnesium alloys has been increased in automotive applications such as the engine blocks, steering wheels and transmission casings due to their weight reduction. Reference Schumann and Friedrich2 The addition of rare earth (RE) elements remarkably improves the mechanical properties of Mg alloys at both room and high temperature due to solution hardening and precipitation hardening. Reference Song and St John3–Reference Alizadeh, Mahmudi, Ngan and Langdon11 RE elements have many merits, such as purifying alloy melt, modifying castability, refining the microstructure, improving the mechanical properties and anti-oxidization properties. Reference Anbu selvan and Ramanathan12 Among magnesium alloys, heat-resistant Mg–Gd–Y–Zr alloys are particularly attractive because of their excellent mechanical properties. Reference He, Zeng, Peng, Gao, Nie and Ding13,Reference Wang, Meng, Zhang and Tang14 It was reported that the precipitation sequence for these alloys involves super-saturated solid solution (S.S.S.S.) → β″ (D019) → β′ (cbco) → β1 (fcc) → β (fcc), which is similar to that of WE54 alloy but different from the three-stage sequence: S.S.S.S. → β″ (D019) → β′ (cbco) → β (bcc). The metastable β′ phase, which has a shape of convex lens and is thermally stable, plays an important role in the age hardening of the alloy. Reference He, Zeng, Peng, Gao, Nie and Ding13 The cubic shaped Mg5Gd(Y) particles at grain boundaries are also potential sources of strengthening. Reference Wang, Meng, Zhang and Tang14
The wear behavior of magnesium alloys is another crucial concern, which has become one of the main subjects of investigations during recent years. In certain applications such as automotive brakes, engine components (piston and cylinder bores), lightweight alloys, and composites are subjected to sliding motion. However, only a few studies have been conducted to date on the wear behavior of the Mg alloys. The wear behavior of the AZ91 alloy under various normal loading and sliding speeds was studied by Chen et al. Reference Chen and Alpas15 They observed that the wear regime changes from mild to severe when the surface temperature reaches 74 ± 15 °C. Lim et al. investigated a wear map as a function of the applied load and rotation speed. Reference Lim, Lim and Gupta16 Zafari et al. investigated tribological behavior of the AZ91 and AZ91–3 wt% RE magnesium alloys at elevated temperatures. They have reported that with increasing the sliding speed from 0.4 to 1 m/s at the wear temperature of 25 °C, the wear rates of AZ91 and AZ91–3 wt% RE alloys decreased. Also, they reported that the AZ91 + 3 wt% RE showed better wear resistance than AZ91 at higher wear temperatures. The superior wear behavior of AZ91 + 3 wt% RE at the elevated temperatures was attributed to its higher thermal stability and strength. Reference Zafari, Ghasemi and Mahmudi17 Recently, Hu et al. studied the wear behavior of Mg–10Gd–3Y–0.4Zr alloy during dry sliding. Reference Hu, Wang, Chen, Yin, Ding and Ji18 They showed that the Mg–10Gd–3Y–0.4Zr alloy exhibited lower wear rate compared with cast-T6 AC8A aluminum alloy under the same conditions.
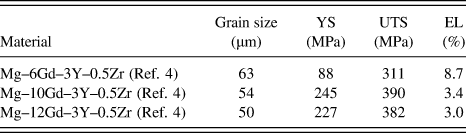
In the previous study, Reference Jafari Nodooshan, Liu, Wu, Rao, Zhou, He, Ding and Mahmudi4 the effect of Gd on the room-temperature tensile properties of the T6 treated Mg–xGd–3Y–0.5Zr alloys was investigated, showing an increase in the tensile strength of the alloy with increasing Gd contents up to 10 wt%. However, the hardness of the alloys increased continuously with addition of Gd up to 12 wt%.
Addition of Gd element to Mg–xGd–3Y–0.5Zr magnesium alloy clearly influences mechanical and wear properties of these alloys. The aim of the present study was to investigate effect of the different weight percentages of the Gd addition on the wear behavior of Mg–xGd–3Y–0.5Zr alloys at wear temperatures of 25–200 °C under normal loads of 3–15 N and at the sliding speeds of 0.03–0.18 m/s. The effects of mechanical properties such as hot hardness were also used for analyzing the wear behavior of the alloys. Also, the wear results of the Mg–10Gd–3Y–0.5Zr alloy under the same conditions from Ref. Reference Hu, Wang, Chen, Yin, Ding and Ji18 were presented for comparison.
II. EXPERIMENTAL PROCEDURES
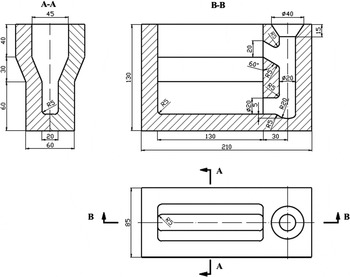
Mg–12Gd–3Y–0.5Zr and Mg–6Gd–3Y–0.5Zr alloys were produced via die casting. High purity Mg (>99.95%) was first melted in an electric resistance furnace under a mixed atmosphere of CO2 and SF6 with the ratio of 100:1 at 755 °C. The Mg–90Gd (wt%), Mg–25Y (wt%), and Mg–25Zr (wt%) master alloys were gradually added to the melt and mixed mechanically. The melt was held at 755 °C for 20 min, and then at the pouring temperature of 730 °C, melt was casted into a steel mold (Fig. 1) preheated to 200 °C. Based on the experimental results reported by He, Reference He19 specimens were solution heat treated at 500 °C for 6 h and then quenched into cold water. After solution treatment, Mg–12Gd–3Y–0.5Zr alloy was isothermally aged at 225 °C for 16 h and Mg–6Gd–3Y–0.5Zr was aged at the same temperature for 80 h, both of these were the peak aged conditions of the respective materials.
The schematic of steel mold.

Dry sliding wear tests were performed using a Ball-on-flat type wear apparatus according to the ASTM G133-02 standard. 20 Wear test samples in the form of rectangular 50 mm × 30 mm × 5 mm flat specimens were machined from the bottom part of the cast ingot shown in Fig. 1. The surface preparation procedure of the wear test samples consisted of grinding surfaces manually by 240, 400 and 800 grit SiC papers, respectively and then polishing with 1.0 and 0.05 μm alumina powder slurry using a low-speed polishing machine. The surface roughness of the wear test samples after polishing was 0.8 μm. The polished surfaces were cleaned in an ultrasonic bath using alcohol before wear tests.
The ball was 6 mm in diameter, made of AISI 52100 type bearing steel (1.00 wt% C, 0.35 wt% Mn, 0.23 wt% Si, 1.45 wt% Cr, 0.025 wt% P (max.), 0.025 wt% S (max.), and the balance Fe) with a hardness of 60 HRC (Rockwell C hardness) used as the sliding counterface in all of the tests. Wear tests were conducted under normal loads of 3, 5, 7, 10, and 15 N, at sliding speeds of 0.03, 0.06, 0.12 and 0.18 m/s and sliding temperatures of 25, 100, 150, and 200 °C for a total sliding distance of 400 m. The design of the wear tests was based on the previous work of Hu et al. Reference Hu, Wang, Chen, Yin, Ding and Ji18
Wear rate was estimated by measuring the weight loss of the specimen after each test. The volume loss was calculated by taking the weight difference of the sample before and after each test. The weight loss is defined as:
 $$\Delta W = ({W_{\rm{a}}} - {W_{\rm{b}}})\quad ,$$
where W a and W b are the weights of the sample after and before wear testing, respectively. The volume loss of the alloy that is related to density (q), was calculated using the expression:
 $${\rm{Volume}}\,{\rm{loss}}\left( {{\rm{m}}{{\rm{m}}^3}} \right) = {{{\rm{Weight}}\,{\rm{loss}}\left( {\rm{g}} \right)} \over {{\rm{Density}}\left( {{{\rm{g}} \mathord{\left/ {\vphantom {{\rm{g}} {{\rm{m}}{{\rm{m}}^3}}}} \right. \kern-\nulldelimiterspace} {{\rm{m}}{{\rm{m}}^3}}}} \right)}} \times 1000\quad .$$
The volumetric wear rate (mm3/km) was calculated using the expression:
 $${\rm{Wear}}\,{\rm{rate}}\left( {{{{\rm{m}}{{\rm{m}}^3}} \mathord{\left/ {\vphantom {{{\rm{m}}{{\rm{m}}^3}} {{\rm{km}}}}} \right. \kern-\nulldelimiterspace} {{\rm{km}}}}} \right) = {{{\rm{Volume}}\,{\rm{loss}}\left( {{\rm{m}}{{\rm{m}}^3}} \right)} \over {{\rm{Sliding}}\,{\rm{distance}}\left( {{\rm{km}}} \right)}}\quad .$$
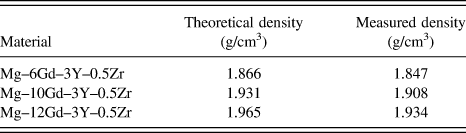
The density of the specimens was determined by using Archimedes principle. To obtain the density of all specimens, they were first weighed in air and afterward they were submerged in water and weighed again (water temperature was taken into account since density varies with temperature). The Density was calculated from weight loss measurements. The Theoretical and measured density values for the tested alloy are listed in Table I.
Density of the tested specimens.

Vickers hardness measurements of the alloys were also conducted on the wear samples at the testing temperatures of 25, 100, 150, 175, 200, 250, and 300 °C. The samples were held at the testing temperature for 20 min before hardness measurements were made. A load of 10 N at an approaching rate of 0.5 mm/min was applied for a dwell time of 30 s. At least three indentations were made on each sample and the lengths of the diagonals were quantified by an optical microscope. The average values of these diagonals were used to estimate the hardness values using the following relationship:
 $${\rm{HV = }}{{{\rm{0}}{\rm{.1854}}P} \over {{d^{\rm{2}}}}}\quad {\rm{,}}$$
where P is the applied load in N and d is the average diagonal length in mm.
The microstructure of the wear samples and worn surfaces was studied by a scanning electron microscope (SEM) equipped with an energy-dispersive x-ray (EDX) analysis. X-ray diffraction (XRD) and optical microscopy were also utilized to identify phases. Characterization of phases was performed in a JEOL-2010 transmission electron microscope (TEM; JEOL Ltd., Tokyo, Japan), operating at 200 kV. Thin foils for the TEM observations were prepared by twin jet electro polishing in a solution of 25% HNO3 and 75% methanol cooled down to −20 °C. Further thinning was carried out using low energy ion beam milling.
III. RESULTS
A. Microstructure and aging response
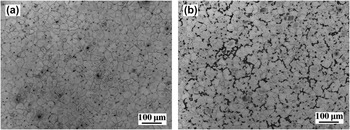
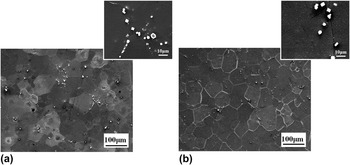
The microstructures of the as-cast Mg–6Gd–3Y–0.5Zr and Mg–12Gd–3Y–0.5Zr alloys are shown in Fig. 2. These microstructures consist of nearly equiaxed grains of α-Mg solid solution surrounded by a divorced eutectic of α-Mg solid solution, and RE-rich second phase particles. The volume fraction of the intermetallic phases increased with increasing Gd content. Figure 3 shows the SEM images of the microstructure of the alloys after solution heat treatment and aging (T6 treatment). After T6 heat treatment, the eutectic phases dissolve into the matrix. Some unevenly distributed small cuboid-shaped particles are observed at grain boundaries and within grains. These cuboid-shaped particles are a type of compound with high RE contents and a size of 0.3–2.8 μm as shown in Fig. 3. As it can be seen in Fig. 3, the volume fraction of cuboid-shape particles increased with increasing Gd content. With increasing Gd content, the age hardening response of the alloys was enhanced. Gd addition increases the volume fraction of second phase particles and reduces the grain size (Table II). The Mg–12Gd–3Y–0.5Zr alloy exhibited the strongest age hardening response, for which the hardness rapidly rose to a maximum value after 16 h. In contrast, Mg–6Gd–3Y–0.5Zr alloy showed its maximum hardness value after 80 h. It was also reported by Wang et al. Reference Wang, Meng, Zhang and Tang14 that addition of Y improved the age hardening response of the Mg–10Gd–xY–0.4Zr alloys, where the alloy with higher Y content showed its peak hardness in the primary stage of the aging treatment.
Optical micrographs of the as-cast Mg–xGd–3Y–0.5Zr alloys: (a) x = 6 and (b) x = 12.

SEM micrograph of the Mg–6Gd–3Y–0.5Zr (a) and Mg–12Gd–3Y–0.5Zr (b) alloys in the aged condition.

Grain size, tensile properties and hardness of the T6 treated Mg–xGd–3Y–0.5Zr alloys. Reference Jafari Nodooshan, Liu, Wu, Rao, Zhou, He, Ding and Mahmudi4

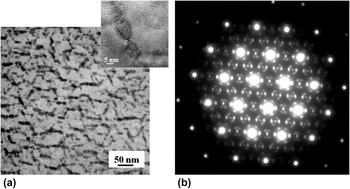
Figure 4 shows the bright field image and the corresponding selected area electron diffraction (SAED) pattern of the aged Mg–12Gd–3Y–0.5Zr alloy with the electron beam parallel to the (0001) zone axis. It can be seen that β′ precipitates, with base centered orthorhombic structure and circular cross sections parallel to (0001) plane, have been formed, as indicated in Fig. 4(a). The size of β′ precipitates was about 40 nm in diameter, with a thickness of less than 15 nm. The inset of Fig. 4(a) shows the high resolution TEM (HRTEM) image of the β′ phase.
(a) TEM image and (b) the corresponding SAED pattern of the aged alloy (B // [0001]α).

XRD pattern of the Mg–6Gd–3Y–0.5Zr and Mg–12Gd–3Y–0.5Zr alloys has been illustrated in our previous paper. Reference Jafari Nodooshan, Liu, Wu, Rao, Zhou, He, Ding and Mahmudi4 The results revealed that alloys are composed of α-Mg solid solution, Mg5(Gd,Y), and Mg24Y intermetallic compounds. Mechanical properties and grain size of the Mg–6Gd–3Y–0.5Zr, Mg–10Gd–3Y–0.5Zr, and Mg–12Gd–3Y–0.5Zr alloys from the author's previous work Reference Jafari Nodooshan, Liu, Wu, Rao, Zhou, He, Ding and Mahmudi4 are listed in Table II. It was reported that significant improvements observed in the age hardening response and tensile strength of the Mg–Gd–Y–Zr alloys were attributed to the dense β′ plate-shape particles formed on the prismatic planes of the α-Mg matrix and cuboid-shaped Mg5(Gd,Y) particles. Reference Jafari Nodooshan, Liu, Wu, Rao, Zhou, He, Ding and Mahmudi4,Reference He, Zeng, Peng, Gao, Nie and Ding13
B. Hot hardness
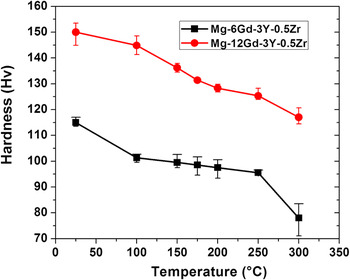
The temperature dependence of the Vickers hardness (H V) values for the investigated alloys is plotted in Fig. 5. The Mg–12Gd–3Y–0.5Zr alloy with a higher Gd content has higher hardness at room and elevated temperatures. Figure 5 shows that the hardness of Mg–12Gd–3Y–0.5Zr alloy is about 30% higher than that of the Mg–6Gd–3Y–0.5Zr alloy at room temperature. With increasing temperature, hardness of both alloys decreased continuously, such that a decrease of about 22% was observed in the hardness of Mg–12Gd–3Y–0.5Zr alloy as the temperature increased from room temperature to 200 °C, while that of the Mg–6Gd–3Y–0.5Zr was even more pronounced. The high thermal stability of Mg–12Gd–3Y–0.5Zr alloy at the higher testing temperatures could be correlated to the existence of thermally stable β′ and cubic shaped precipitates, causing a higher resistance to the applied stresses in the deformation zone at high temperatures.
Hardness variations of the Mg–xGd–3Y–0.5Zr alloys containing 6 and 12 wt% Gd element versus temperature.

C. Wear rate
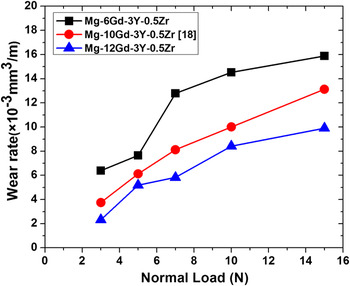
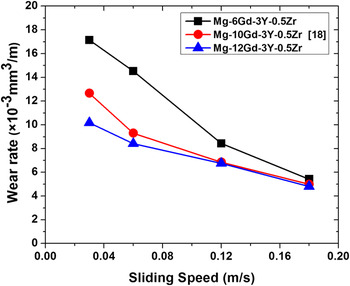
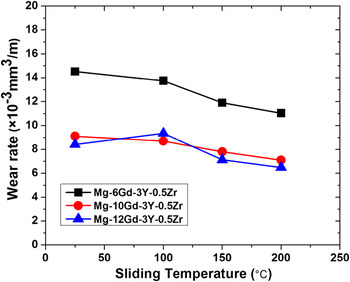
To investigate the effect of Gd content on the wear resistance of the alloy, a comparison is made between the alloys with different compositions (Mg–6Gd–3Y–0.5Zr, Mg–10Gd–3Y–0.5Zr, Reference Hu, Wang, Chen, Yin, Ding and Ji18 and Mg–12Gd–3Y–0.5Zr alloys). Figure 6 represents the variation of wear rate as a function of applied load for different Gd-containing alloys. The sliding speed and temperature were 0.06 m/s and 25 °C, respectively. It is observed that the wear rate increased almost linearly with increasing applied load in all samples, whereas the Mg–6Gd–3Y–0.5Zr alloy showed a more pronounced wear rate during the wear test at higher applied loads. The figure shows that the alloy with 12 wt% Gd possesses the lowest wear rate and thus the highest wear resistance among the tested alloys. Figure 7 shows the variations of the wear rate with sliding speed for the alloys containing different amounts of Gd at the sliding temperature of 25 °C under 10 N applied load. It can be seen from the plot that the Mg–12Gd–3Y–0.5Zr alloy has the lowest wear rate at all sliding speeds. The wear rates of the alloys decreased gradually with increasing the sliding speed and achieved their minimum values at 0.18 m/s. The wear rate of the Mg–12Gd–3Y–0.5Zr at 0.18 m/s is almost 50% lower than that at 0.03 m/s. Although the Mg–6Gd–3Y–0.5Zr alloy showed the highest wear rate at all sliding speeds, its wear rate at 0.18 m/s was almost 68% lower than that at 0.03 m/s. At the 0.18 m/s speed, both of the alloys exhibit almost the same wear rates. The variation of wear rate as a function of wear testing temperature for Mg–6Gd–3Y–0.5Zr, Mg–10Gd–3Y–0.5Zr, Reference Hu, Wang, Chen, Yin, Ding and Ji18 and Mg–12Gd–3Y–0.5Zr alloys under a normal load of 10 N and at sliding speeds of 0.6 m/s is illustrated in Fig. 8. As it can be seen in the figure, the wear rate of Mg–6Gd–3Y–0.5Zr shows its maximum value at room temperature, but wear rate decreases with increasing sliding temperature from room temperature to 200 °C. However, the wear rate of Mg–12Gd–3Y–0.5Zr alloy shows its maximum value at 100 °C, where wear rate decreases with further increasing temperature.
Variations of the volumetric wear rate with normal load for the Mg–xGd–3Y–0.5Zr alloys at the sliding speed of 0.06 m/s at temperature of 25 °C for 400 m sliding distance.

Variations of the volumetric wear rate with sliding speed for the Mg–xGd–3Y–0.5Zr alloys under the normal load of 10 N at the temperature of 25 °C for 400 m sliding distance.

Variations of the volumetric wear rate with sliding temperature for the Mg–xGd–3Y–0.5Zr alloys under the normal load of 10 N and sliding speed of 0.06 m/s for 400 m sliding distance.

D. Worn surfaces
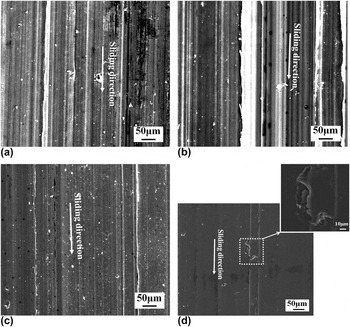
Figure 9(a) shows the micrograph of the worn surface of the Mg–6Gd–3Y–0.5Zr alloy tested at 5 N load. The micrograph reveals that numerous continuous grooves have formed on the wear surface. These parallel grooves are indicative of microplowing, the effect which is also observed on similar worn surfaces with increased severity when the alloy was tested at higher loads. Figure 9(d) shows the worn surface of the Mg–12Gd–3Y–0.5Zr alloy tested at 15 N load.
Comparison of SEM images of the Mg–6Gd–3Y–0.5Zr (a and b) and Mg–12Gd–3Y–0.5Zr alloys, (c and d) under 5 (a and c) and 15 (b and d) N applied load at the sliding speed of 0.06 m/s and temperature of 25 °C.

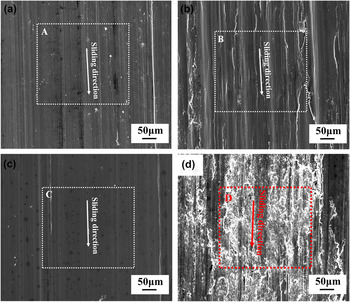
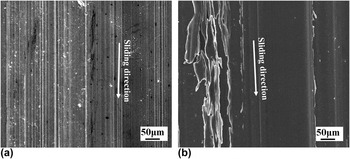
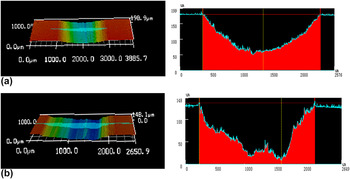
Figure 10 illustrates the wear surfaces of the Mg–6Gd–3Y–0.5Zr and Mg–12Gd–3Y–0.5Zr alloys at different sliding speeds under the normal load of 10 N and sliding temperature of 25 °C. As can be seen in Figs. 10(a) and 10(c), the wear mechanism for the Mg–6Gd–3Y–0.5Zr and Mg–12Gd–3Y–0.5Zr alloys at a sliding speed of 0.03 m/s is abrasive wear. However, by increasing the speed to 0.18 m/s the wear tracks are characterized by delamination wear for both alloys. For this mechanism, the compressive internal stress was expected to inhibit crack initiation and propagation. Table III shows the corresponding EDX analysis results of the wear tracks and worn surfaces depicted in Fig. 10. The worn surfaces of the Mg–12Gd–3Y–0.5Zr alloy at room and 200 °C are shown in Fig. 11. Figures 12(a) and 12(b) exhibits the three-dimensional optical surface profile images of the wear track generated at room temperature and 200 °C under the 0.06 m/s sliding speed and 10 N normal load, respectively.
Worn surfaces of the Mg–6Gd–3Y–0.5Zr alloy at the sliding speed of: (a) 0.03 m/s, (b) 0.18 m/s and Mg–12Gd–3Y–0.5Zr alloy at the sliding speed of (c) 0.03 m/s, (d) 0.18 m/s, under normal load of 10 N and wear temperature of 25 °C.

EDX analysis results of the wear tracks and worn surfaces for T6 treated Mg–6Gd–3Y–0.5Zr and Mg–12Gd–3Y–0.5Zr alloys in Fig. 10.

Comparison of SEM images of the Mg–12Gd–3Y–0.5Zr alloy at sliding temperatures of (a) 25 °C and (b) 200 °C under normal load of 10 N and the sliding speed of 0.06 m/s.

Three-dimensional surface contour of worn surface of the Mg–12Gd–3Y–0.5Zr alloy at sliding temperatures of (a) 25 °C and (b) 200 °C under normal load of 10 N and the sliding speed of 0.06 m/s.

E. Wear debris
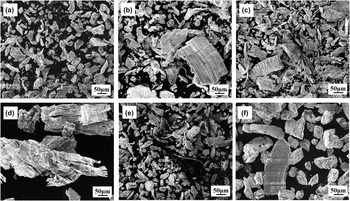
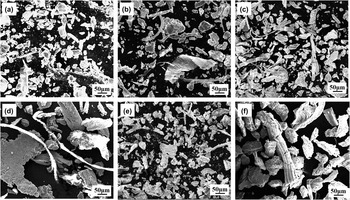
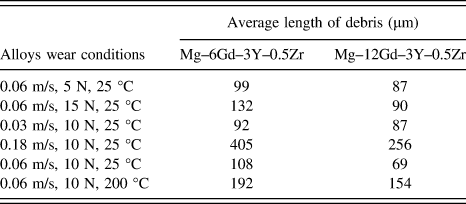
Scanning electron microscopy was carried out to observe wear debris which was collected after the wear test. The changes in morphology of wear debris were observed at different sliding speeds, sliding normal loads and sliding temperatures. Figures 13(a) and 13(b) illustrate the micrographs of wear debris of T6 treated Mg–6Gd–3Y–0.4Zr alloy at 5 N, and 15 N normal loading, respectively. At 5 N load, the abrasive wear process resulted in the loss of fine debris particles, as shown in Fig. 13(a). At higher normal load, the size of the debris increased and the small flakes were observed, as demonstrated in Fig. 13(b). This behavior is in accordance with the measured wear rates. Figures 13(c) and 13(d) shows the wear debris of Mg–6Gd–3Y–0.4Zr alloy produced after wear test at sliding speeds of 0.03 and 0.18 m/s, respectively. It is evident that the morphology of debris changed to oxidized flakes due to initiation of delamination wear. Due to the high sliding speed, debris trapped between the worn surface and counterface and they were compacted together and made the flakes, as it can be seen from Fig. 13(d). These flakes have the granular appearance, and could reach lengths of up to 500 μm. Figures 13(e) and 13(f) show the micrograph of the wear debris of the Mg–6Gd–3Y–0.4Zr alloy at 25 and 200 °C, respectively. At higher temperature, the shape of the wear debris was similar to that at 0.18 m/s sliding speed; while the size of the debris was much lower than that at higher sliding speed. Figure 14 shows the micrographs of wear debris in the T6 treated Mg–12Gd–3Y–0.4Zr alloy at different conditions, same as that shown in Fig. 13 for Mg–6Gd–3Y–0.4Zr alloy. The wear debris of the Mg–12Gd–3Y–0.4Zr alloy is similar to that of Mg–6Gd–3Y–0.4Zr alloy in the same condition; while, the size of the wear debris of the Mg–12Gd–3Y–0.4Zr alloy is smaller than that of Mg–6Gd–3Y–0.4Zr alloy. The average size of the debris was calculated by using the length of the debris and dividing the sum of the length of different debris to the quantity of the measured debris of the alloys under different conditions and listed in Table IV.
Scanning electron micrographs of the wear debris of the Mg–6Gd–3Y–0.5Zr alloy for 400 m sliding distance: (a) 0.06 m/s, 5 N, 25 °C; (b) 0.06 m/s, 15 N, 25 °C; (c) 0.03 m/s, 10N, 25 °C; (d) 0.18 m/s, 10N, 25 °C; (e) 0.06 m/s, 10 N, 25 °C; (f) 0.06 m/s, 10 N, 200 °C.

Scanning electron micrographs of the wear debris of the Mg–12Gd–3Y–0.5Zr alloy for 400 m sliding distance: (a) 0.06 m/s, 5 N, 25 °C; (b) 0.06 m/s, 15 N, 25 °C; (c) 0.03 m/s, 10N, 25 °C; (d) 0.18 m/s, 10N, 25 °C; (e) 0.06 m/s, 10 N, 25 °C; (f) 0.06 m/s, 10 N, 200 °C.

The average lengths of the wear debris for the alloys under different wear conditions.

IV. DISCUSSION
From Fig. 6, it is clear that in all conditions the Mg–12Gd–3Y–0.5Zr alloy has lower wear rates than the samples with lower Gd contents. The same behavior is also observed for the tests carried out at the normal load of 10 N and under the same sliding speeds of 0.03, 0.06, 0.12 and 0.18 m/s, as shown in Fig. 7. The main reason for the observed enhancement in wear resistance of the samples with addition of Gd is clearly related to Archad equation:
 $$Q = K{W \over H}\quad .$$
In this equation, Q is the wear rate (mm3/km), W the volume of worn material per distance, K is a constant called wear coefficient, and H is the hardness of the specimen in Vickers scale (kg/mm2). Archad concluded that the wear rate was proportional to the applied load and that the wear rate was independent of the apparent area of contact. Reference Archard21–Reference Deaquino-Lara, Soltani, Bahrami, Gutiérrez-Castañeda, García-Sánchez and Hernandez-Rodríguez24 The observed increase in the hardness of the more concentrated RE-containing alloy was a positive factor which could improve its wear resistance.
Hard particles act as barriers to dislocation movements and thus can cause resistance to indentation. Decrease in the interparticle distance at higher Gd contents is associated with higher collision number, interparticle blockage and stress concentration at the metal/particle interface. Greater stress will be required for production of plastic deformation in Mg–12Gd–3Y–0.5Zr of higher dispersoid content, as shown in Fig. 5. The larger hard particles in the Mg–12Gd–3Y–0.5Zr alloy act as barriers to the dislocation motion and exhibit greater resistance to deformation. In other words, greater stresses will be required to produce further plastic deformation on going from the alloy with coarser content to the alloy with finer particles. Essentially, this behavior can be associated with a dislocation mechanism in the metallic phase known as work-hardening or strain hardening. Reference Soltani, Jafari Nodooshan, Bahrami, Pech-Canul, Liu and Wu22 It was reported by Nie that the plate-shaped precipitates that form on prismatic planes of the magnesium matrix phase are most effective for dispersion strengthening; these precipitates provide the most effective barriers to dislocations gliding on the basal plane of α-Mg. Reference Nie25 Also, volume fraction and number density of precipitates per unit volume are reported as important factors in determining the strength of alloys besides the shape, orientation and distribution of precipitate particles. Reference Nie25,Reference He, Zeng, Peng, Gao, Nie and Ding26 As mentioned, the grain size of the alloys also decreased with increasing Gd content. The higher strength and hardness of the Mg–12Gd–3Y–0.5Zr alloy could be attributed to the solution strengthening, precipitation hardening and grain boundary strengthening. The existence of the dense β′ plate-shaped particles formed on the prismatic planes of the α-Mg matrix and cuboid-shaped Mg5(Gd,Y) particles in deformed region, which could act as obstacles to the movement of dislocations, could increase the hardness of near surface layers of Mg–12Gd–3Y–0.5Zr alloy. Also, the higher strength and stability of the Mg–12Gd–3Y–0.5Zr alloy could help to maintain the protective oxide layers at the high wear temperatures.
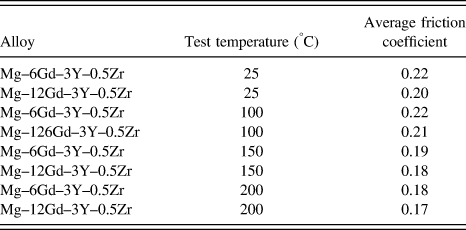
According to Archad equation, there is a relationship between wear rate and hardness. However, the wear rate not only depends on the hardness of the alloys, but also on other factors such as friction coefficient and oxidation layer on the worn surfaces. All these parameters can affect the wear rate. As shown in Table V, the friction coefficient of the alloys decreased with increasing test temperature (except for Mg–12Gd–3Y–0.5Zr, for which the friction coefficient increased with increasing the test temperature up to 100 °C, and it decreased with further increase of test temperature). Reduction of the friction coefficient with increasing test temperature can be the main reason for the contradiction between the theory and experimental results. Also the return of the wear debris to the worn surface can be another reason for the reduction of the wear rate with increasing the test temperature, while, the hardness of the alloy reduced with increasing the test temperature.
The average of friction coefficient of the Mg–6Gd–3Y–0.5Zr and Mg–12Gd–3Y–0.5Zr alloys tested at different temperatures under the normal load of 10 N and sliding speed of 0.06 m/s for 400 m sliding distance.

The worn surface of the Mg–6Gd–3Y–0.5Zr alloy at a sliding load of 5 N, sliding speed of 0.06 m/s, and the wear testing temperature of 25 °C indicates that plastic deformation and scratches were formed parallel to the sliding direction, suggesting that the abrasion wear mechanism is operative. The same wear mechanism was also observed for Mg–12Gd–3Y–0.5Zr alloy at the same sliding conditions, as shown in Fig. 9(c). However, it is evident from Fig. 9(d) that local delamination has occurred under 15 N load such that some flakes of the delaminated material are detectable on the worn surface. The short cracks were initiated and connected after a long incubation time, then a long crack formed and a layer was delaminated in a sliding cycle. Comparison of Figs. 9(c) and 9(d) suggests different wear mechanisms for the alloy tested at different loads. The dominant wear mechanism for Mg–12Gd–3Y–0.5Zr alloy tested at 15 N is a mixture of abrasion and delamination wear. Higher loads play an important role in increasing the probability of crack formation and growth. In the load-bearing components, the transmitted shear strains to the matrix could lead to more wear by delamination process. However, wear mechanism for the alloy at lower loads is abrasion. The abrasive wear resulted in surface deformation and damage in the form of deep grooves in the sliding direction, Reference Aung, Zhou and Lim27 as shown in Figs. 9(a)–9(c). The dominant wear mechanism for Mg–12Gd–3Y–0.5Zr alloy tested at 15 N is a mixture of abrasion and delamination wear.
At the higher sliding speeds, the increased contact temperature could oxidize the surface and retained debris. As it can be seen in Fig. 10 and Table III, the amount of oxide patches on the worn surfaces of the alloys increased with increasing sliding speed. The oxide layer, probably rich in iron and magnesium, was formed on the worn surfaces. This layer could limit the metallic contact with steel counterface, and subsequently, decreased the wear rate of the Mg–6Gd–3Y–0.5Zr and Mg–12Gd–3Y–0.5Zr alloys at the higher sliding speeds.
The wear rate of Mg–12Gd–3Y–0.5Zr alloy showed its maximum value at 100 °C and it gradually decreased with increasing temperature from 150 to 200 °C. At the sliding temperature below 100 °C, wear rate increased with increasing sliding temperature, as expected. Reference Chen and Alpas15 As it can be seen in Fig. 8, the wear rate of the alloy decreased by about 30% when the wear temperature increased from 100 to 200 °C. The average of friction coefficient of the Mg–12Gd–3Y–0.5Zr and Mg–6Gd–3Y–0.5Zr alloys tested at different temperatures are listed in Table V. The results showed that the friction coefficients of Mg–12Gd–3Y–0.5Zr specimens were lower than that those of Mg–6Gd–3Y–0.5Zr alloy. The friction coefficient of the Mg–12Gd–3Y–0.5Zr alloy slightly increased with temperature increase from room temperature to 100 °C, and then decreased with further increasing the test temperature such that it showed its minimum at 200 °C. The results of the friction coefficients are in good agreement with the wear rate results. As it can be seen from Fig. 8, the wear rate of the Mg–12Gd–3Y–0.5Zr alloy first increased with increasing temperature from room temperature to 100 °C and then decreased with further increase in the test temperature. The friction coefficient of Mg–6Gd–3Y–0.5Zr alloy reduced continuously with increasing test temperature. At the higher sliding temperatures; the soft Mg debris had a tendency to stick to the counterface of the steel ball and reduce the wear rate and friction coefficient at higher temperatures. The adhesion of the soft Mg debris to the counterface caused reduction in friction coefficient and subsequently resulted in reduction of the wear rate of the alloys. The trapped and adhesive wear debris acted as a protective layer and reduced the wear rate. Reference Hu, Wang, Chen, Yin, Ding and Ji18 As deduced from Fig. 13(d), the wear debris was extruded during sliding between the steel counterface and Mg alloy. Some of these particles can be recycled into the worn surface at higher temperatures and reduce the wear rate of the alloys. Also, from Fig. 12(b), it is clear that the worn surface of the alloy at 200 °C is not smooth due to the recycling of the wear debris into the worn surface, which results in reduction of the wear rate of the alloy at this temperature.
V. CONCLUSIONS
-
(1) The effects of 6 and 12 wt% Gd additions on the wear behavior of the Mg–xGd–3Y–0.5Zr alloys were studied at the wear temperatures of 25–200 °C under normal loads of 3–15 N and at sliding speeds of 0.03–0.18 m/s.
-
(2) The alloys containing different Gd contents showed similar wear mechanisms in the same conditions. The abrasive wear was identified as the main wear mechanism of the Mg–Gd–Y–Zr alloys under lower loads. On the other hand, the dominant wear mechanism at the higher loads was determined to be a mixture of abrasion and delamination wear.
-
(3) The wear rate of the Mg–6Gd–3Y–0.5Zr and the Mg–12Gd–3Y–0.5Zr alloys decreased by about 68 and 50%, respectively, as the sliding speed increased from 0.03 to 0.18 m/s. The lower wear rate of the alloys at higher speeds was attributed to the formation of compact oxide patches on the worn surfaces of the alloys and this could limit the metallic contact with steel counterface and thus decreasing the wear rate of the alloys at the higher sliding speeds.
-
(4) The wear rate and friction coefficient of the Mg–12Gd–3Y–0.5Zr, and Mg–6Gd–3Y–0.5Zr alloys decreased as the temperature increased from 100 to 200 °C.
ACKNOWLEDGMENTS
This project is sponsored by National Natural Science Foundation of China (No. 51275295), Shanghai Rising-Star Program (No. 14QB1403200) and Research Fund for the Doctoral Program of Higher Education of China (Nos. 20120073120011 and 20130073110052).