Introduction
It has been known for more than 100 years that snouts of glaciers vary in a pattern that seems to be governed by weather conditions a number of years before. It has also been known for some time that glaciers in a given region do not necessarily react in the same way to changing large-scale weather conditions (see, e.g., Paterson, 1969, p. 233). It is exceptional for all the glaciers in a specific mountain region to react synchronously. The rule is rather that each individual glacier has its own pattern of variation, where the climate is one of several explanatory variables (but normally the most important). In this paper we wish to illustrate this, using examples from a mountain region in Norway.
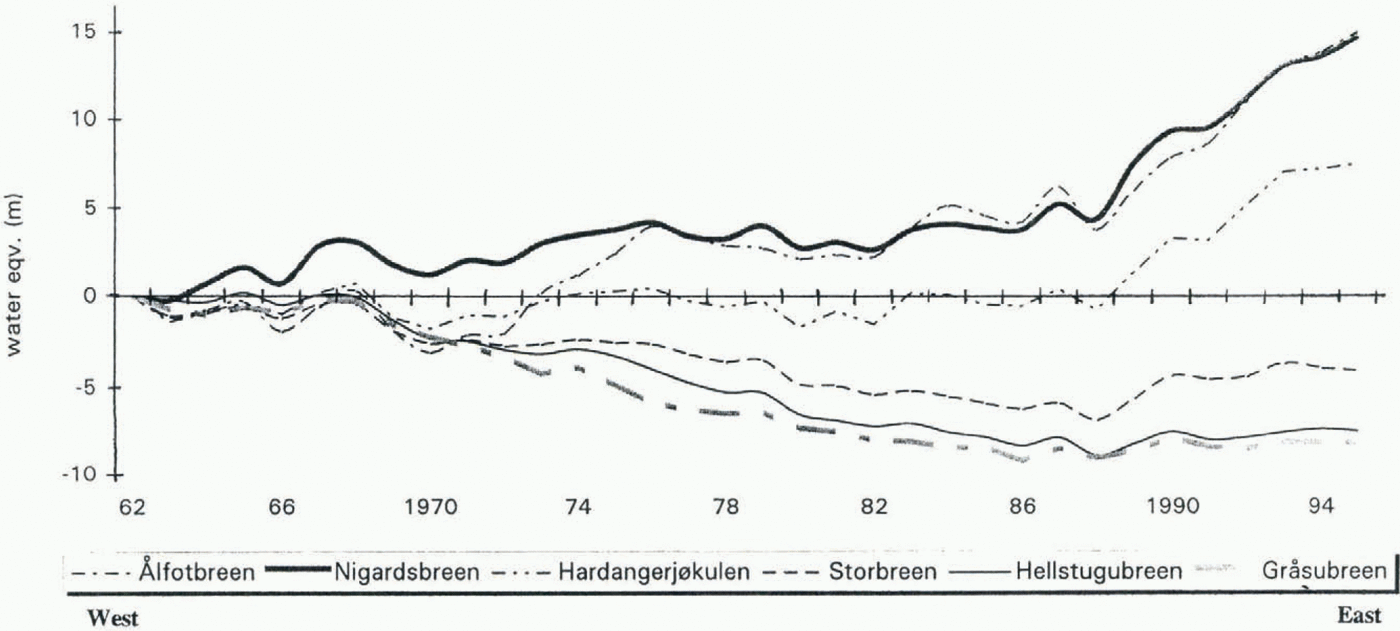
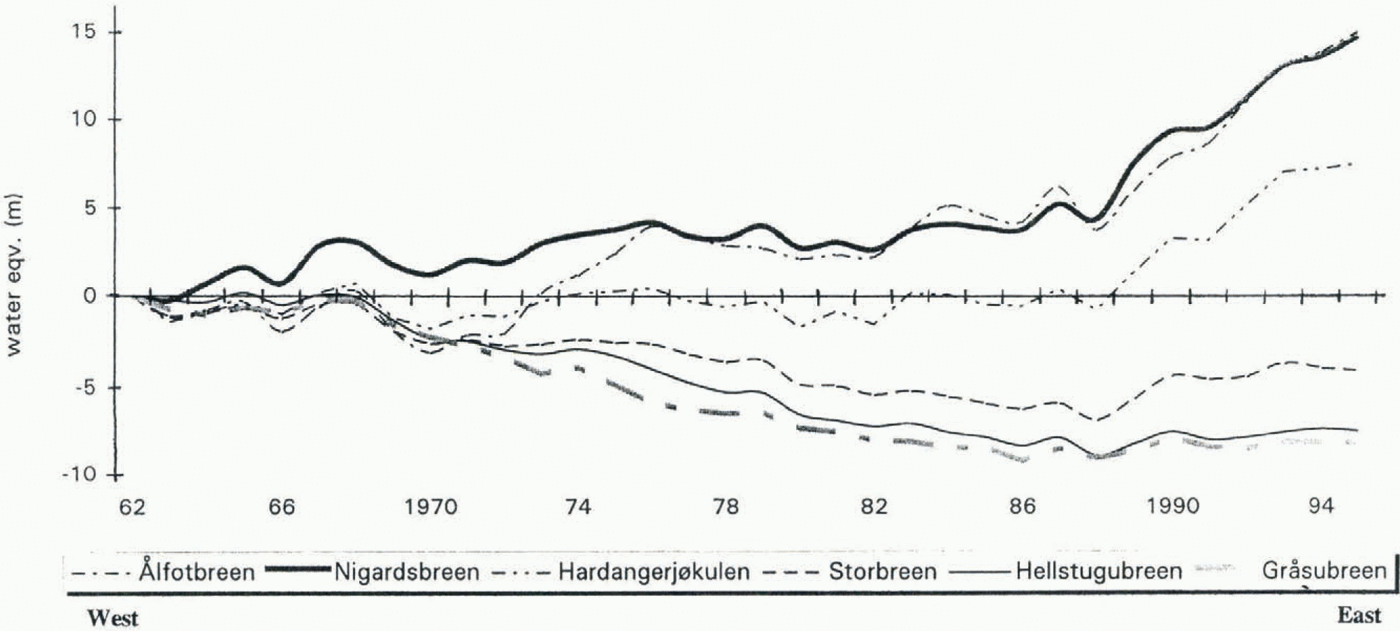
The cumulative net balance for six glaciers in southern Norway during the period 1963–95. Their location is shown in Figure 2.
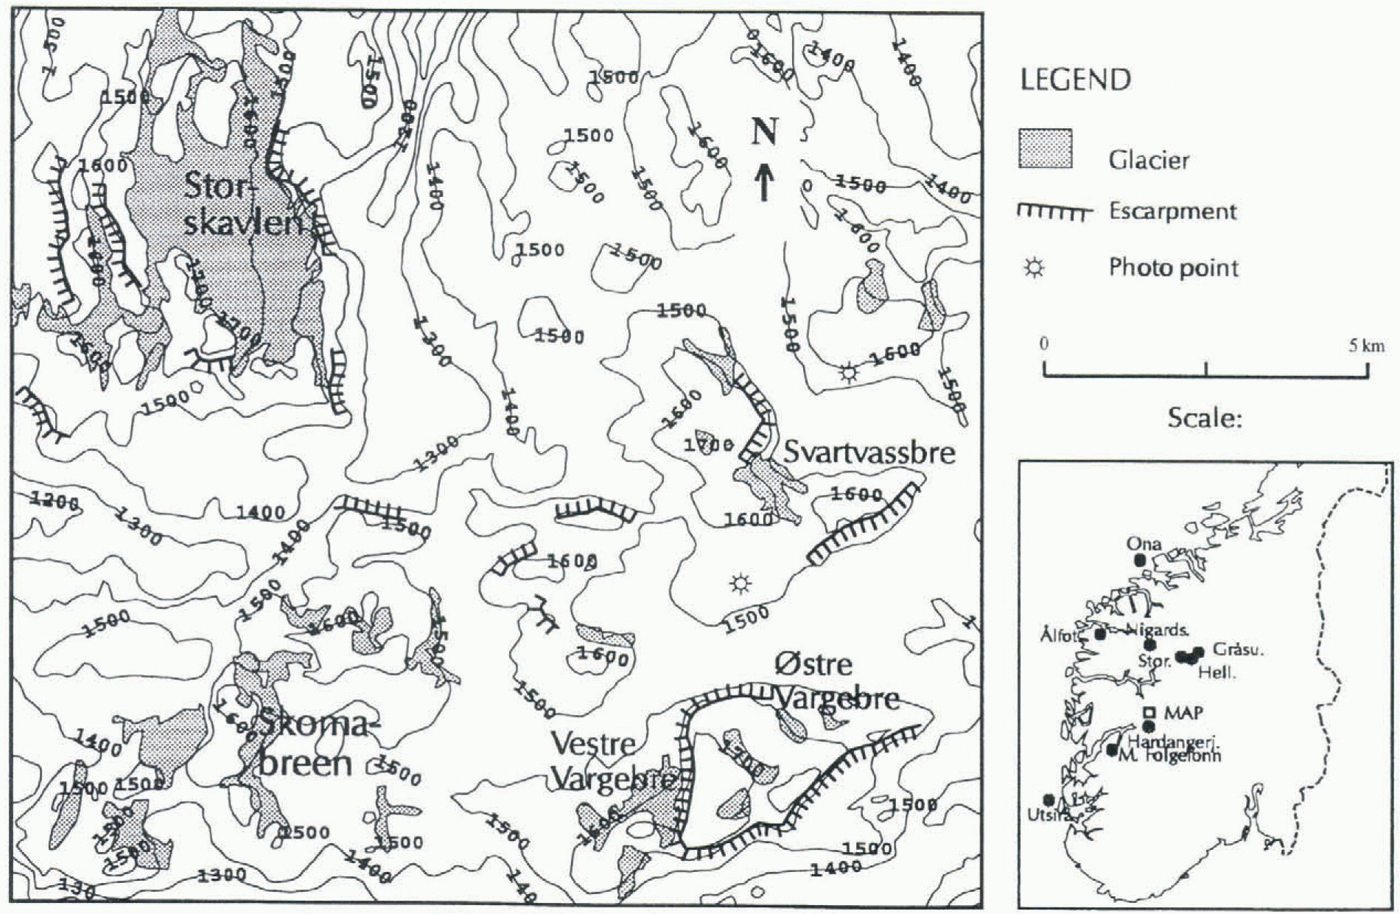
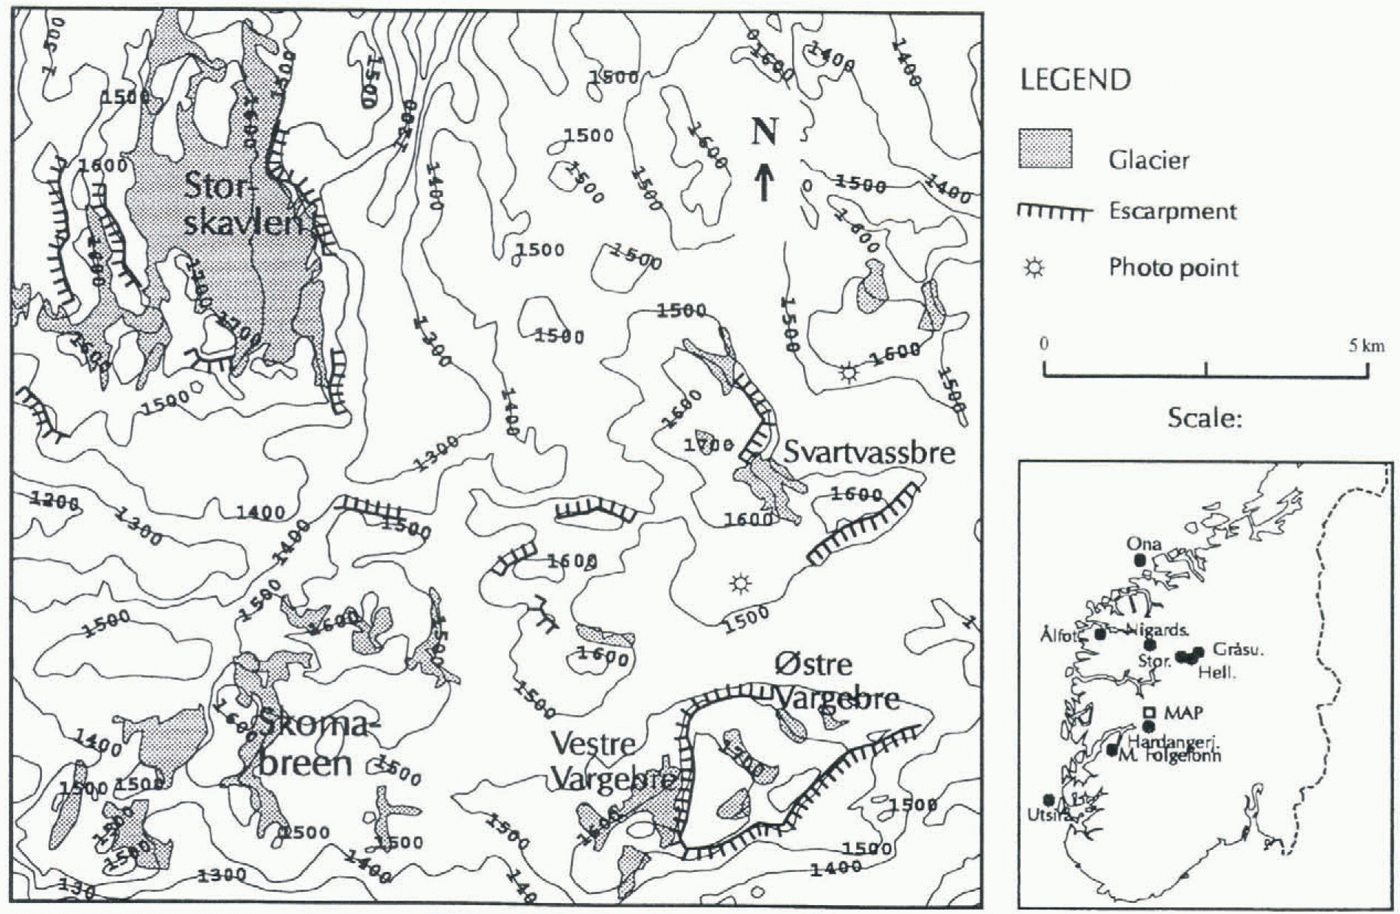
Map of the Aurland Mountains with the glaciers mentioned in the text. The contour interval is 100 m. The map of southern Norway gives the location of the weather stations used and the glaciers presented in Figure 1.
In southern Norway, mass-balance measurements have been carried out on six glaciers since 1962 along a transect from the maritime west coast to the more continental eastern side of the Jotunheimen Mountains. The measurements were carried out using the standard stratigraphic method (Østrem and Brugman, 1991). The cumulative net balances for 1963–95 are shown in Figure 1, station and their location in Figure 2. The cumulative net balance variation along this profile is quite clear. The glaciers closest to the west coast (Ålfotbreen and Nigardsbreen) have increased their mass considerably, especially since 1988. A glacier on the water divide between western and eastern Norway, Hardangerjøkulen, had a balance close to zero up to 1988, but has increased since then. The glaciers further east (Storbreen, Hellslugubreen and Gråsubreen) have all decreased.
Glaciers In The Aurland Mountains
The Aurland Mountains are located in the inner part of the Sognefjord area, close to the main water divide (see Fig. 2). The area is a mountain plateau, mainly at 1200–1400 m a.s.l., but with some isolated plateaux as high as 1600–1700 m. The highest plateaux are composed of hard Precambrian rock, which were pushed over the softer Cambro-Silurian rocks during the period of the Caledonian mountain formation. The plates often end in escarpments. These high plateaux contain some glaciers, the largest of which is Storskavlen, which covers 7.45 km2. The other glaciers are all smaller than 1 km2. A multidisiplinary post-regulation programme has been carried out in the regulated Aurland watercourse. One project in this programme is an investigation of the glacier Svartavassbreen which terminates in one of the reservoirs. The purpose was to see if the changed water level had influenced the glacier front. A preliminary mapping of the glacier in 1988 indicated, however, that this glacier had increased its volume considerably compared to a map from 1969. It was already known that a nearby glacier, Omnsbreen, had shrunk considerably in the same period (Høgevard, 1987). The project was therefore changed into a study of the local volume changes of some of the glaciers in the Aurland Mountains.
Investigations
Mapping
In September 1969 the mountain region was mapped by aerial photography, at the end of a summer when there was little snow left on the glaciers. These photos were used to draw maps of Storskavlen and Svartavassbreen. In September 1989 we made a ground survey of the same two glaciers and drew new maps.
Snow distribution measurements
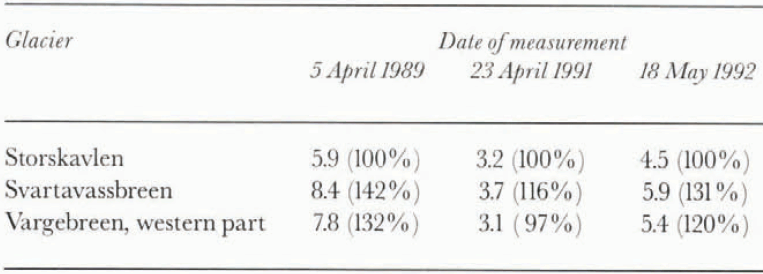
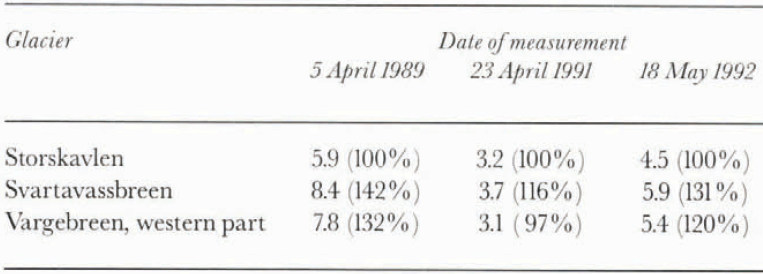
Mean snow depths in meters. The numbers in parentheses are percentages of the Storskavlen mean value
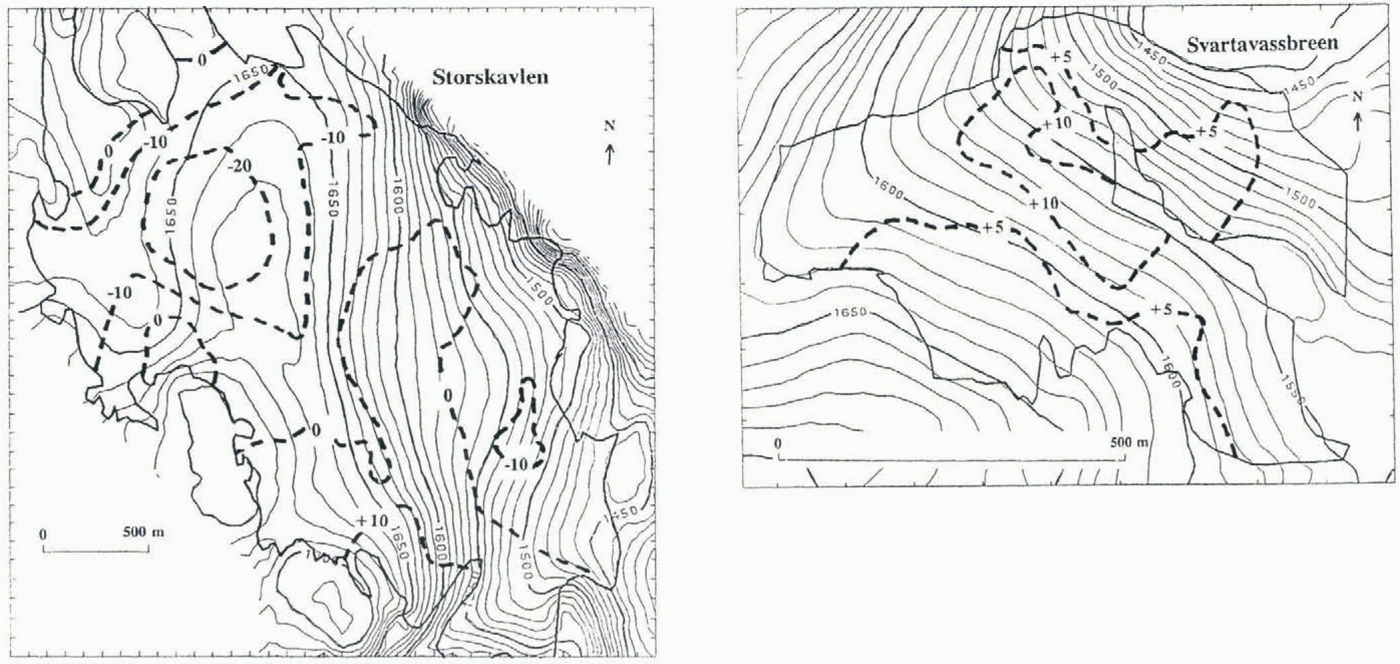
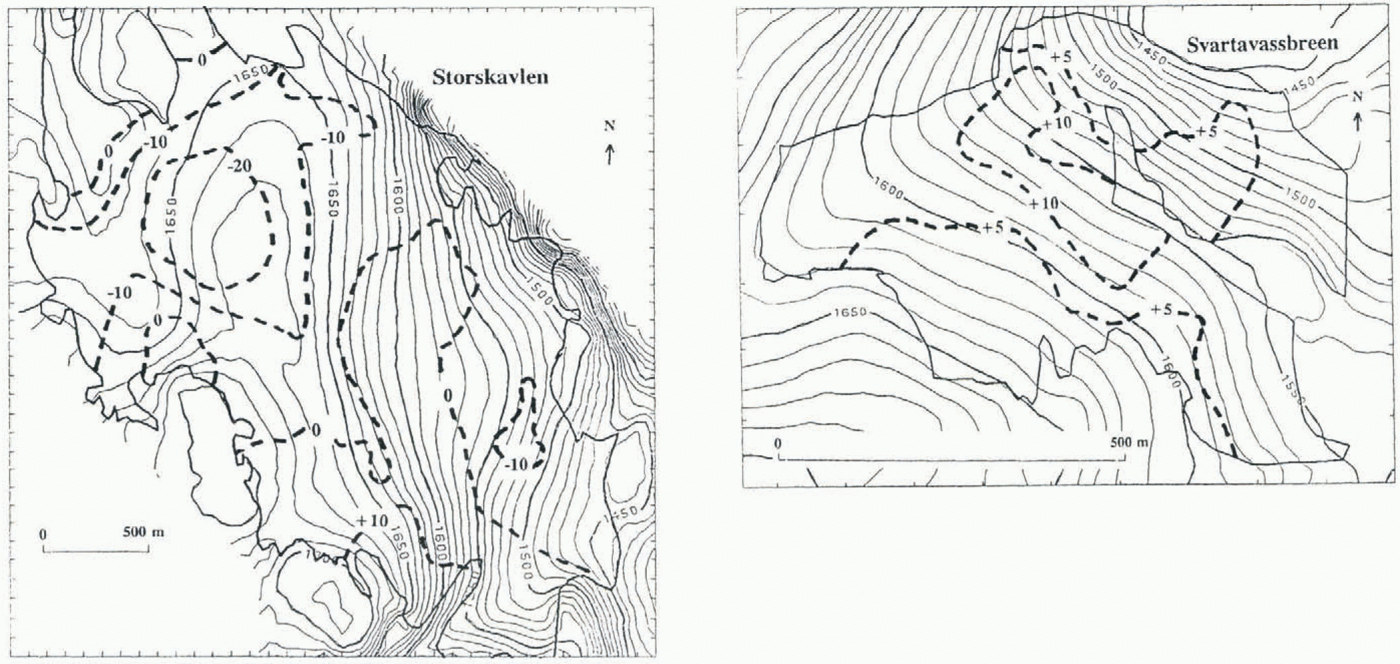
The vertical surface displacement in meters (dashed lines), 1969–89, for Storskavlen and Svartavassbreen, calculated from maps. The contour lines are from the 1969 maps.
In 1989, 1991 and 1992 the snow distribution on Storskavlen, Svartavassbreen and the western part of Vargebreen was measured by traditional sonding along transects across the glaciers. The mean snow depths are presented in Table 1. The winter of 1988–89 was dominated by strong westerly winds and was one of the wettest this century. In 1990–91 the weather was much drier and the winds were less strong and coming from different directions. The 1991–92 winter was more like that of 1988–89.
Older ground photos
The first good topographic map of this area was constructed from ground photos taken by the Norwegian Geographic Survey in 1940–43. We have been able to get copies of some of these photos covering Storskavlen, Svartavassbreen and Vargebreen in 1941. In September 1995 we found the ground positions used in 1941 for Vargebreen and Storskavlen and rephotographed these glaciers.
Results
Storskavlen
The vertical-elevation changes from 1969 to 1989 are shown in Figure 3. The map is rather complicated. Some areas have thinned more than 20 m, but other parts have increased more than 10 m. The areas that have lost mass are those with little winter accumulation due to wind erosion away from these areas, while the areas with growth are those where drifting snow deposits. On average, Storskavlen has lost 4.2 m of ice or firn averaged over the surface area of the glacier over these 20 years, or 0.2 m year–1.
Svartavassbreen
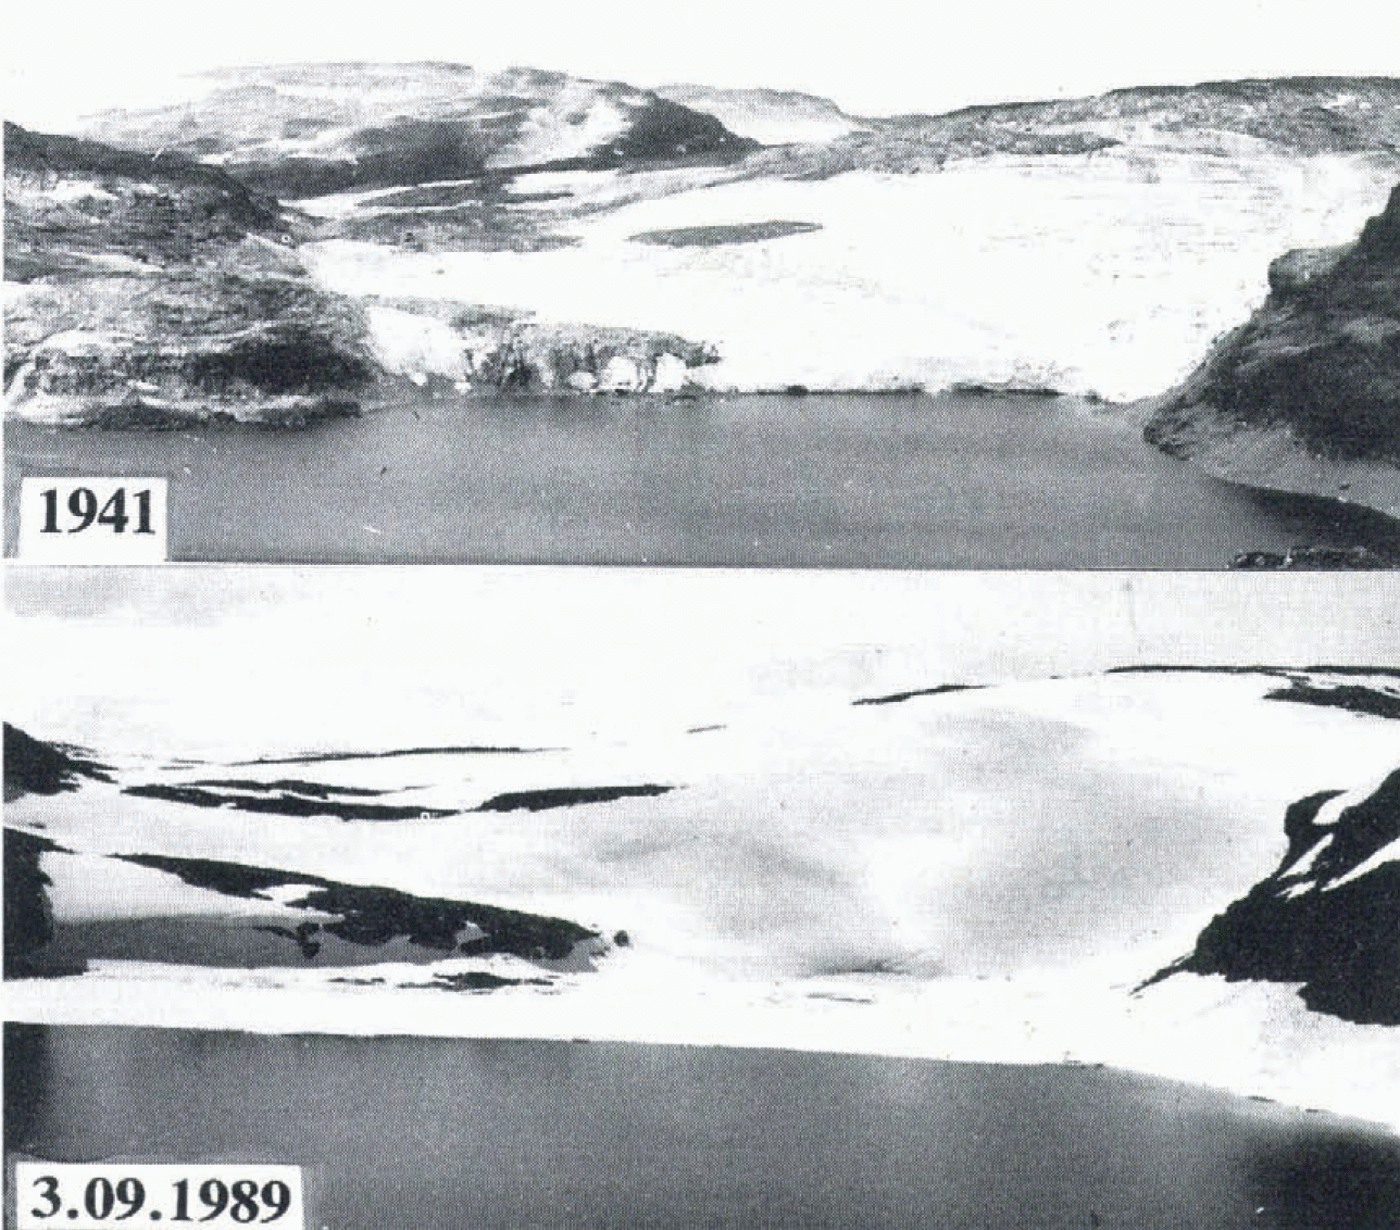
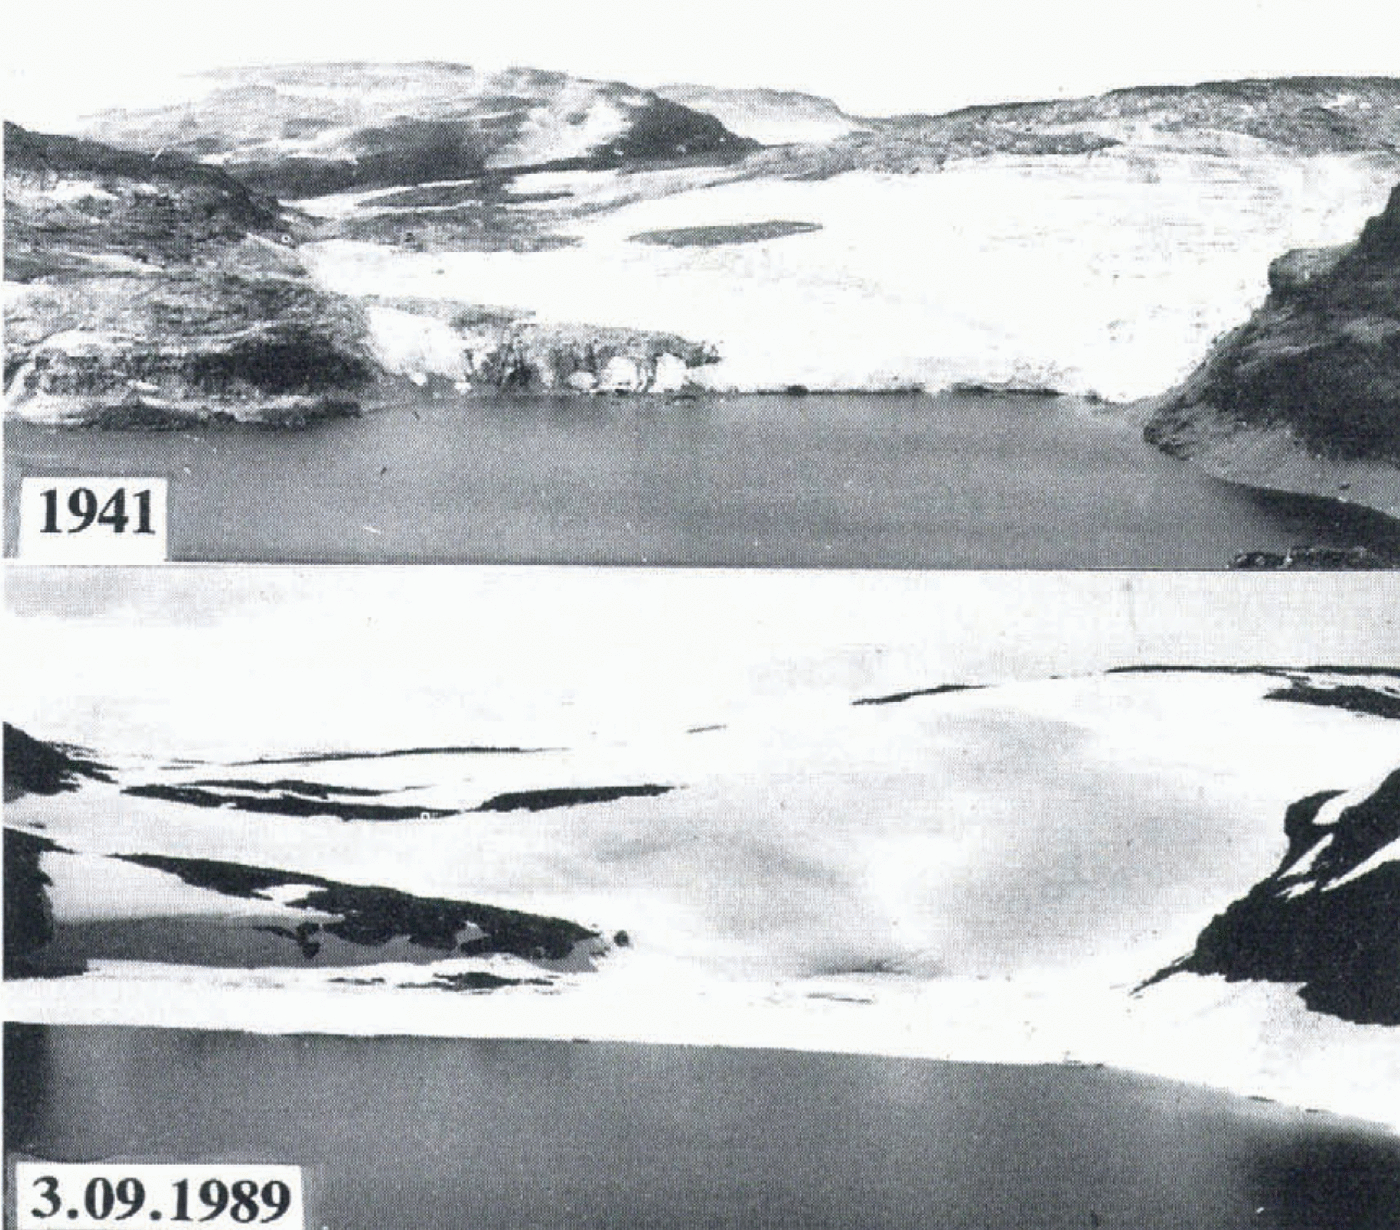
The righthand map in Figure 3 also shows the vertical displacement on Svartavassbreen over the same period. The whole surface of Svartavassbreen has been rising, some areas more than 10 m. On average the glacier has thickened by 5.8 m, or 0.3 m year–1. This increase can be visualized by comparing air photos from 1969 (not presented) with the photo from 1989 in Figure 4. In 1969 the glacier was nearly divided by a rock ridge at 1550 m. In 1989 this ridge was buried by snow and ice, its presence only indicated by a long crevasse. The ground photo from 1941 in Figure 4 shows the glacier at that time to be larger than in 1969, but smaller than in 1989. Between 1989 and 1994, Svartavassbreen has continued to thicken, but the increase has not yet been quantified by mapping.
Vargebreen
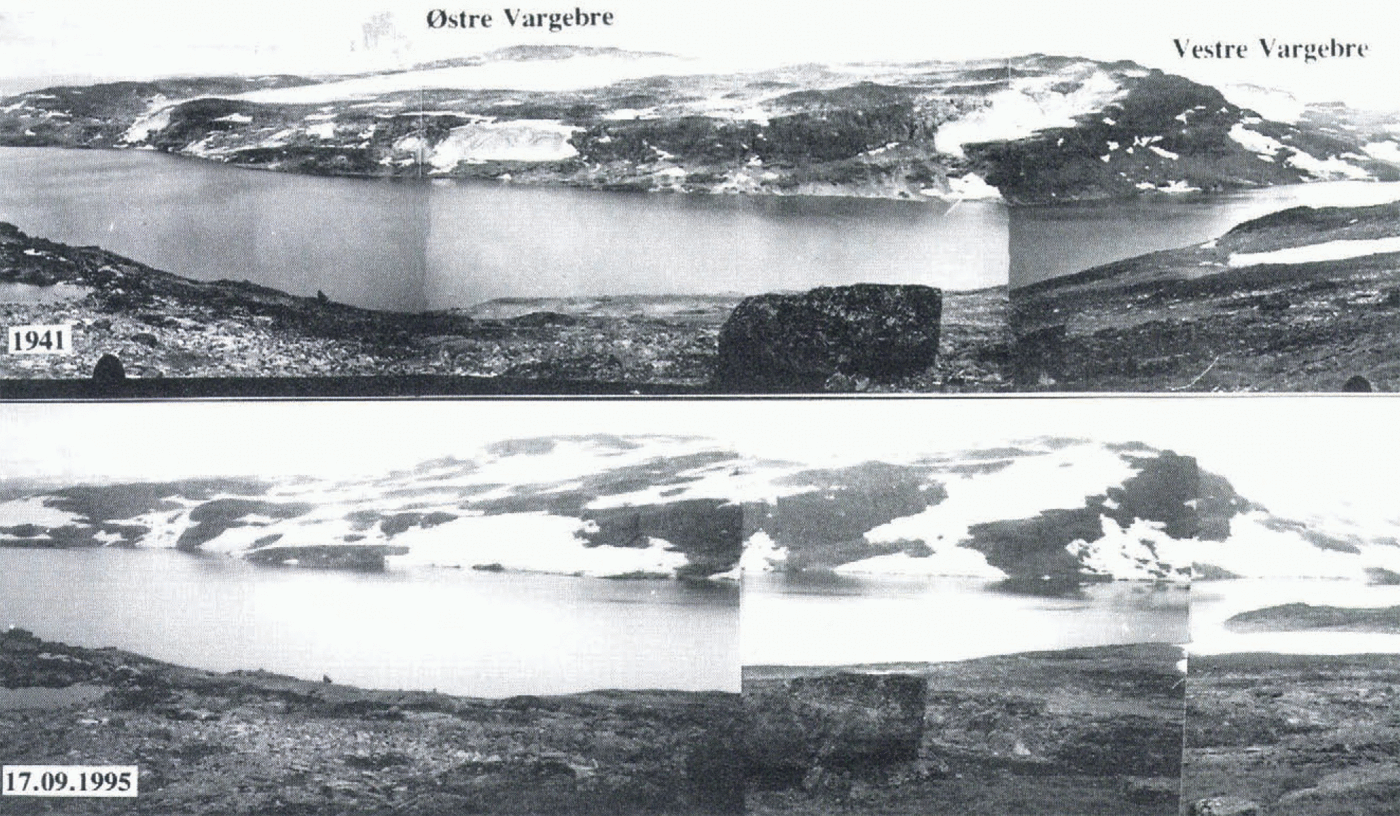
We have no maps, but ground photos from 1941 and 1995 (see Fig. 5). In 1941 the eastern part was clearly seen to be a small ice cap, but in 1995 we see no ice, only large snow patches that we know have accumulated since 1988. In 1969 some small ice patches were still seen on the air photos. The eastern part of Vargebreen is no longer a true glacier and seems to have nearly disappeared like Omnsbreen (Messel, 1971; Høgevard, 1987). However, similar ground photos of the western part of Vargebreen indicate small differences in the ice extent between 1941 and 1995.
Discussion
If the only glaciological information were the curves in Figure 1, we would expect the glaciers in the Aurland Mountains (see Fig. 2) to have behaved much like the Hardangerjøkulen. This would mean that the glaciers should have changed little in net volume over the period 1969–89. However, one glacier (Svartavassbreen) has increased strongly, one glacier has areas showing increase and decrease (Storskavlen) and two glaciers (Omnsbreen and Vargebreen, eastern part) have strong decreases.
The pattern of changes on Storskavlen is much the same as found on the small ice caps Rioukojektna, northern Sweden (Rosquist and Østrem, 1989), and Midtre Folgefonni,
Fig. 4. Photos of Svartavassbreen, taken by Norwegian Geographic Survey in 1941 (upper) and by the authors on 3 September 1989 (lower). The photo from 1941 is taken from a slightly higher altitude.
90 km southwest of Aurland (Østrem and Tvede, 1986). On these ice caps the areas most exposed to westerly winds have decreased, while the areas where drifting snow accumulates have increased. The hypothesis is that an increase in the frequency and magnitude of wind from the western sector has increased the snowdrift from the wind-exposed parts of the glacier over to the more sheltered parts. Svartavassbreen and Vargebreen received more snow compared to Storskavlen during the stormy 1988–89 winter than during the calm 1990–91 winter (see Table 1). Our hypothesis is that this wind-drift effect does much to explain the local differences we find on the Aurland glaciers. Because there is no homogeneous
Photos of the eastern part of Vargebreen taken from the same location in 1941 by Norwegian Geographic Survey (upper) and on 19 September 1995 by the authors (lower). Parts of the western Vargebre can be seen to the right. The water level of Lake Vargevatn in the foreground was raised 8 m in the late 1970s for hydropower production.
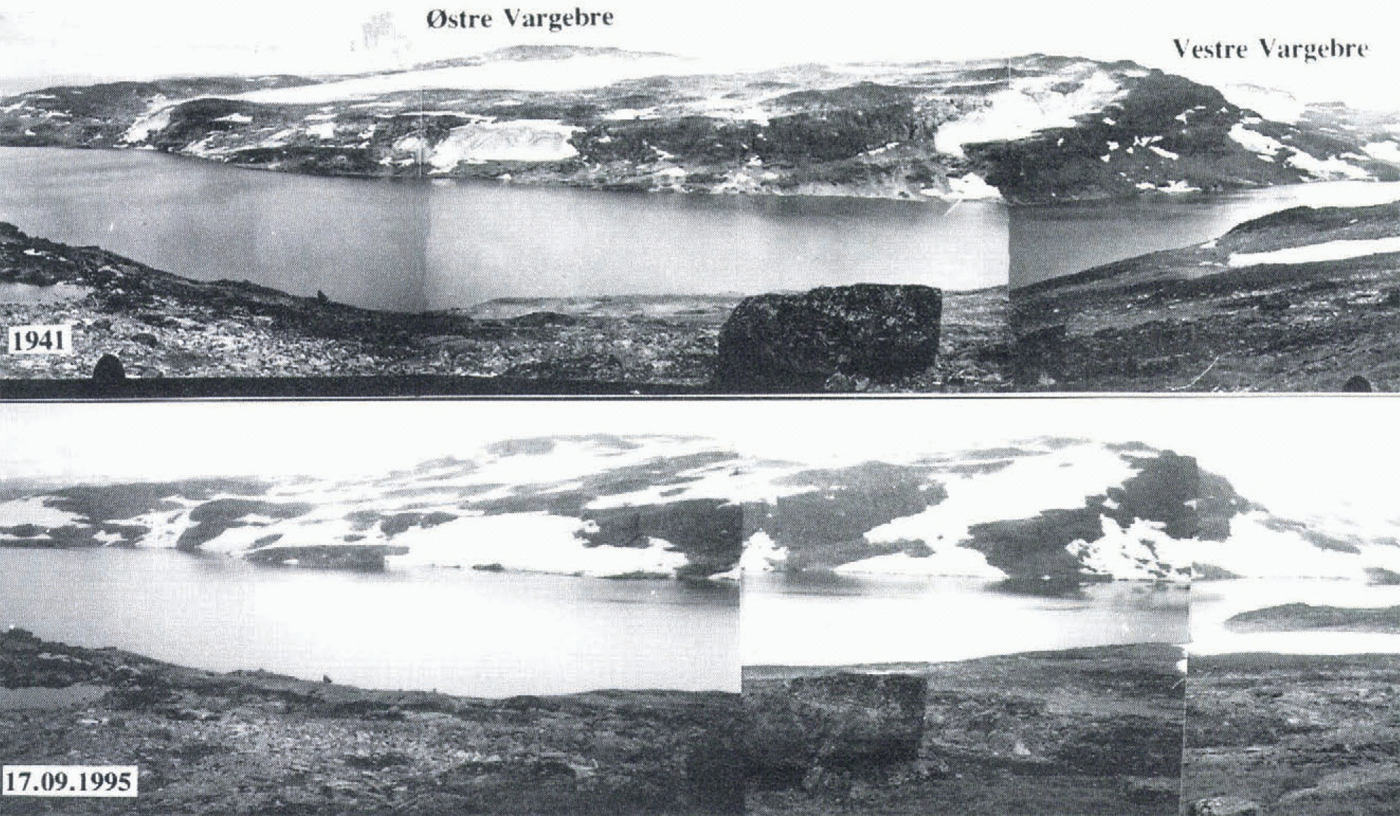
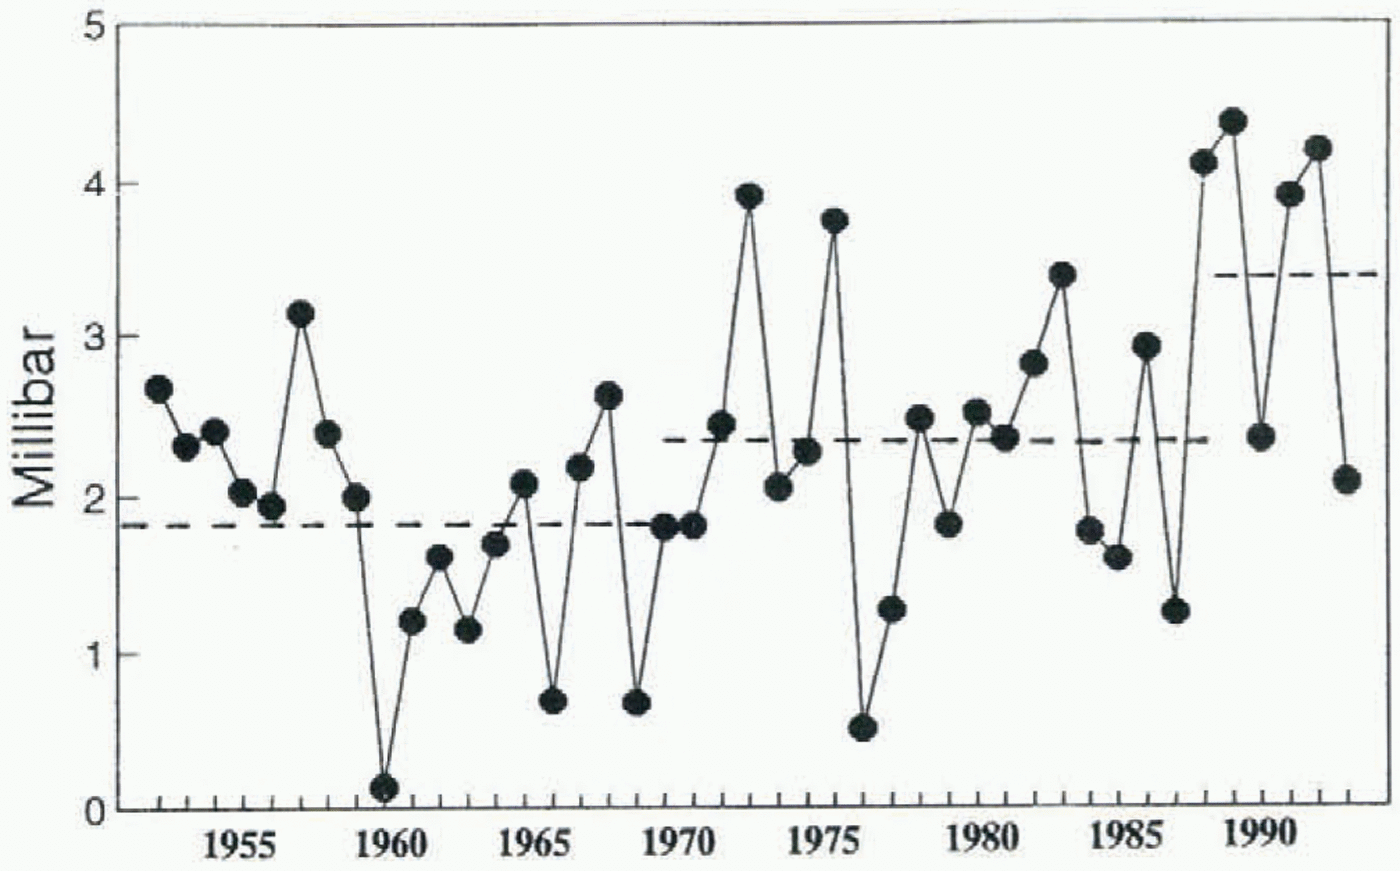
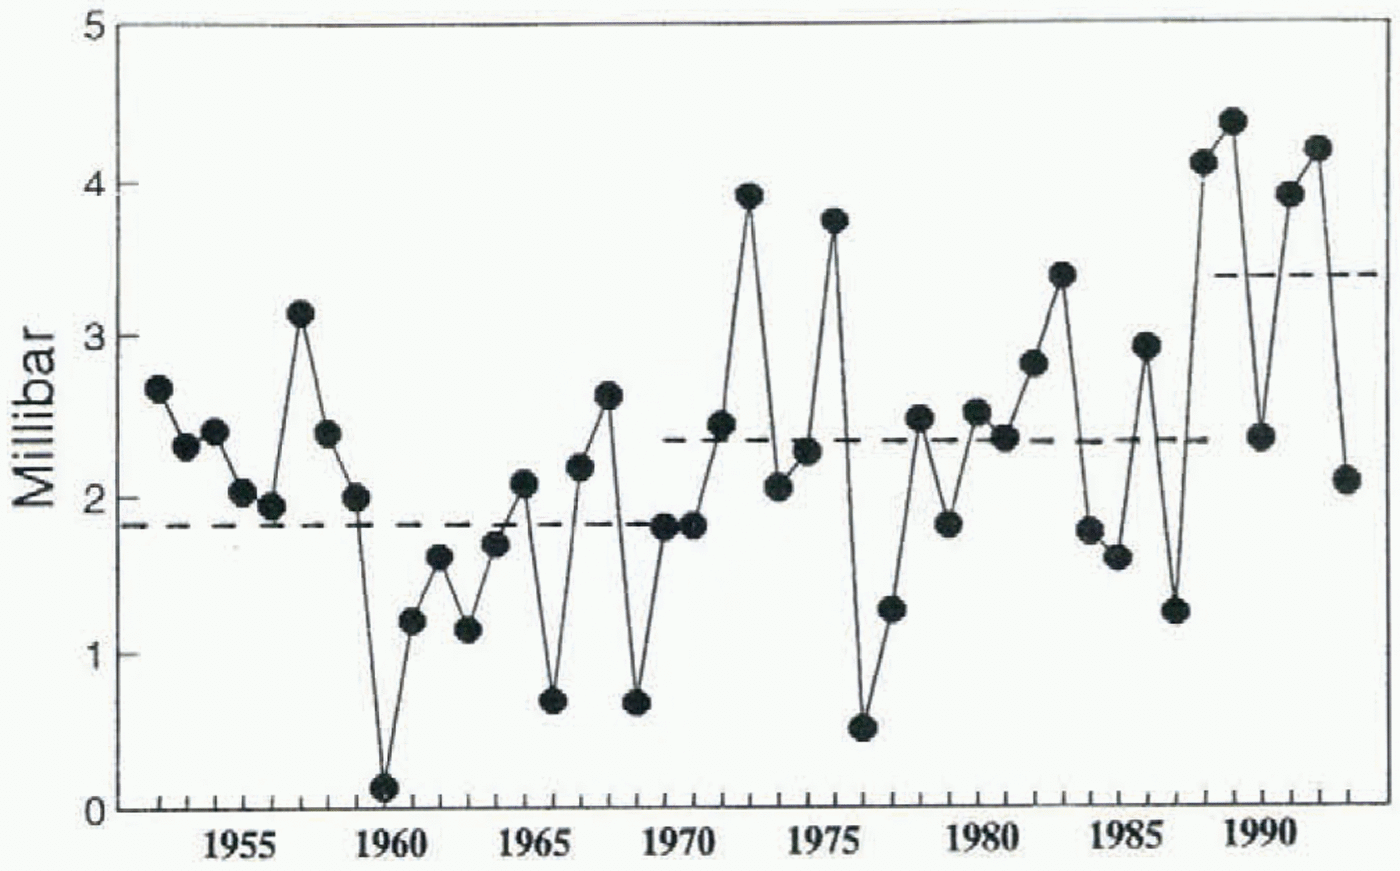
Fig. 6. Mean winter air-pressure difference between the synoptic meteorological stations at Utsira and Ona for the winters 1952–94. See Figure 2 for location. The winter period is October–April. The winter averages for the periods 1952–69, 1970–89 and 1990–94 are indicated.
long-term wind series from weather stations in the high mountains of southern Norway, we use the air-pressure data from stations at the west coast. These air-pressure data have recently been tested for trends and are presented, together with similar data from the other North Atlantic countries, in Frich and others (1996).
The mean air pressure for the snow accumulation season (October–April) at the two synoptic lighthouse stations Utsira and Ona (see Fig. 1 for locations) is calculated for each winter. The difference between the two stations is a measure of the strength of the westerly winds. A large pressure difference signifies strong winds, while a small pressure gradient means a calm winter. The results for the period 1952–94 are presented in Figure 6. The mean value for the period 1952–69 was 1.82 hPa, for the period 1970–89 it was 2.33 hPa and for the winters 1990–94 it increased to 3.37 hPa. The winters between the base maps (1969 and 1989) in Figure 3 had stronger mean westerly winds than the preceding period 1952–69. This tendency has strengthened during the winters 1990–94. The winter with the strongest wind was 1990, followed by 1993, 1989, 1992 and 1973. A wind speed increase at the west coast of southern Sweden has also been reported by Bergstrøm (1993).
The air-pressure data support our hypothesis that there must have been a general increase in the amount of drifting snow from west to east and away from the wind-exposed areas. The topography of the glacier surface itself and of the surrounding terrain must be given attention when analyzing the glacier changes where wind drift is an important factor. For the glaciers studied in the Aurland Mountains it is necessary to study the ice-free terrain to the west. This will give us an idea of how large the potential “snowdrift-supplying area” is. Sublimation of the drifting snow may be a factor limiting the extent of this supplying area. However, as most of the drifting in the mountains of west Norway takes place during snowstorms when the air is close to saturation, the sublimation of drifting snow is probably small. From Figure 1 it is seen that eastern Vargebre is surrounded by escarpments. This will probably strongly limit the snowdrift onto this glacier from the terrain below the escarpments. The terrain to the west of Svartavassbreen, however, does not terminate in escarpments, and thus this glacier has a larger supplying area than eastern Vargebre.
These examples demonstrate some of the limitations in the use of glaciers as climate indicators. Which climate parameters do they indicate? This is not a new question, as we know that the mass change of a glacier is a product of the entire energy balance. But the relative importance of each climate parameter varies considerably. If only one glacier in the Aurland Mountains were used in a climate-monitoring programme, which one should be chosen? Our study shows that on a meso-scale it is important to have glacial areas representing the different exposures and that also the topography of the surrounding terrain must be taken into consideration. On a larger scale an increase in the wind speed may also give an increase in orographic precipitation. Holmlund and Fuenzalida (1995) suggest this as the reason behind anomalous behavior of glaciers in Tierra del Fuego, Chile.
Acknowledgements
This work has been financed by research funds from Norwegian Water Resources and Energy Administration under the program “Post-regulation studies in rivers”. Valuable assistance in the field has been provided by the local staff of the Oslo Energy Company in Aurland. Thanks also to E. Førland and O. E. Tveito at the Norwegian Meteorological Institute for providing the air-pressure data and other meteorological information, to A. Voksø for help in constructing the maps and to J. Brittain for checking the language. The suggestions made by G. Kaser at Universität Innsbruck helped to improve the paper significantly.