Introduction
Conservation of highly migratory marine species is typically challenging as they can travel through the waters of multiple jurisdictions and are exposed to multiple stressors throughout their migration (Lascelles et al., Reference Lascelles, Notarbartolo di Sciara, Agardy, Cuttelod, Eckert and Glowka2014). Increasing human activities create an additional challenge, as both known and potentially unknown impacts on marine species can act synergistically and cumulatively over space and time (Crain et al., Reference Crain, Kroeker and Halpern2008; Maxwell et al., Reference Maxwell, Hazen, Bograd, Halpern, Breed, Nickel, Teutschel, Crowder, Benson, Dutton, Bailey, Kappes, Kuhn, Weise, Mate, Shaffer, Hassrick, Henry, Irvine, McDonald, Robinson, Block and Costa2013). Compilation of data to establish some baselines of spatial and temporal distributions, as well as behaviours, is important for documenting changes in habitat use, and for putting current and future data in the appropriate context (Moore et al., Reference Moore, Grebmeier and Davies2003; Kennedy et al., Reference Kennedy, Hakam, Witting, Milani, Taei, Smith, Taylor, Teemari and Rotjan2021).
In the New York Bight, which encompasses waters from Cape May, New Jersey, USA to Montauk, New York, USA, establishing this context is essential as recent apparent increases in baleen whale sightings (Brown et al., Reference Brown, Robbins, Sieswerda, Schoelkopf and Parsons2018) and increases in research efforts continue. However, the apparent increase in sightings has also led to growing concerns for locally threatened and critically endangered species due to ongoing Unusual Mortality Events (UMEs; NOAA, 2021a), reports of vessel strikes (e.g. King et al., Reference King, Chou, Rekdahl, Trabue and Rosenbaum2021; NOAA, 2021e), and other potentially unknown impacts related to forthcoming offshore wind energy development. Previously, there have been limited focused studies on a single species using opportunistic data (e.g. Brown et al., Reference Brown, Robbins, Sieswerda, Schoelkopf and Parsons2018, Reference Brown, Sieswerda and Parsons2019), and at another level, there are studies using widespread systematic surveys with varying coverage in the New York Bight (e.g. Sadove & Cardinale, Reference Sadove and Cardinale1993; Roberts et al., Reference Roberts, Best, Mannocci, Fujioka, Halpin, Palka, Garrison, Mullin, Cole, Khan, McLellan, Pabst and Lockhart2016).
More recently, there have been significant dedicated survey efforts since 2017 across the New York Bight, with future efforts already underway (e.g. see King et al., Reference King, Chou, Rekdahl, Trabue and Rosenbaum2021; Zoidis et al., Reference Zoidis, Lomac-McNair, Ireland, Rickard, McKown and Schlesinger2021); however, there are few published records or accounts to provide baseline information with which to compare recent and any forthcoming results. Some data from previous systematic surveys have been incorporated in various modelling papers and technical reports (e.g. Roberts et al., Reference Roberts, Best, Mannocci, Fujioka, Halpin, Palka, Garrison, Mullin, Cole, Khan, McLellan, Pabst and Lockhart2016; Tetra Tech & LGL, 2020), but the spatial and temporal coverage of the area was overall limited from these prior survey efforts. A considerable amount of data from non-systematic surveys, primarily in the form of platforms of opportunity (namely whale-watching vessels) exist, but are largely only available through specific online data portals (see opdgig.dos.ny.gov/#/map and seamap.env.duke.edu). Although data portals are extremely useful for regional data sharing, the absence of these data in regional-focused data portals (e.g. northeastoceandata.org and portal.midatlanticocean.org) represents a significant lack of distribution data in nearshore waters. Additionally, data portals often only include GPS coordinates for each record. As a result, they frequently miss valuable behavioural information that speaks to the importance of the area for particular species and better informs management and mitigation efforts (such as whether particularly vulnerable life stages (e.g. calves) or important behaviours (e.g. feeding) occur in the area). Though present in data portals, it is clear that these opportunistic data are rarely included in published works even though they can be an important source for establishing baselines (Vinding et al., Reference Vinding, Bester, Kirkman, Chivell and Elwen2015), and consequently, these opportunistic data are not included when evaluating potential shifts in distribution and occurrence. With the dissemination of these data, shifts in these patterns can be more effectively assessed, eventually leading to the use of these types of data in management decisions.
Here, for the first time, baleen whale sightings obtained by non-systematic surveys and platforms of opportunity from the last two decades (1998–2017) are synthesized for the New York Bight, and overlap with anthropogenic use and management areas assessed. While the inherent sampling bias and lack of effort data associated with whale-watching vessels can present a challenge for typical quantitative and statistical analyses, these factors do not diminish the importance of these data types in providing information on the distribution and behaviours of baleen whales, especially considering that these non-systematic surveys and whale-watching vessels often provide finer-scale coverage in areas that may be missed by large-scale systematic surveys. Synthesis of these data also provides an important context with which to compare and contrast to data collected during current and future efforts, and can aid in data interpretation and identification of data gaps. This is vital for informing effective conservation management in an area that is human-dominated yet relatively data-poor and will be facing increasing anthropogenic pressures in the coming years.
Materials and methods
Baleen whale sightings were synthesized from non-governmental organization data holders off New York: Gotham Whale, the Coastal Research and Education Society of Long Island (CRESLI), the Riverhead Foundation for Marine Research and Preservation (RFMRP) and the Wildlife Conservation Society (WCS). This data collection complements more recent survey efforts in the northern areas of the New York Bight; however, due to conservation importance, opportunistic sightings of the critically endangered North Atlantic right whale (NARW) were also obtained from the North Atlantic Right Whale Consortium (NARWC; North Atlantic Right Whale Consortium, 2021) and the New Jersey Department of Environmental Protection, Division of Fish and Wildlife, New Jersey Endangered & Nongame Species Program (NJENSP; New Jersey Department of Environmental Protection, Division of Fish and Wildlife, New Jersey Endangered & Nongame Species Program, 2021). Gotham Whale collected data in the New York Bight apex while onboard a whale watching vessel that departed from Breezy Point, Queens, New York 1–5 times a week, generally from June–November, with limited effort in April, May and December (Brown et al., Reference Brown, Robbins, Sieswerda, Schoelkopf and Parsons2018, Reference Brown, Sieswerda and Parsons2019; Gotham Whale, unpublished) from 2011–2017. CRESLI collected data while onboard whale-watching vessels that departed from Montauk, on the eastern end of Long Island, New York, generally between June and September, either one, three, or five days a week depending on the year (from 2013–2017, 2009–2012 and 1998–2002, respectively). Sightings from RFMRP were collected opportunistically during aerial surveys from 1998, 2004 and 2005. Sightings from WCS were collected opportunistically during dedicated tagging voyages in 2016. Opportunistic sightings of NARW were reported individually to NARWC and NJENSP. It is important to note that sightings were obtained from trained marine mammal observers and that the number of sightings do not necessarily reflect the number of individual whales, rather just the number of times a baleen whale was seen.
Overlap between sightings and anthropogenic use and management areas was analysed using offshore wind energy areas, designated shipping lanes, coastal navigation channels and NARW Seasonal Management Areas (SMAs). Offshore wind energy areas were obtained from the Bureau of Ocean Energy Management (BOEM) Renewable Energy GIS Data Portal. Shipping lanes, coastal navigation channels and vessel transit counts from 2017 were obtained from the Northeast Ocean Data Portal. Impacts from vessels have been observed 2 km away from whales (Lesage et al., Reference Lesage, Omrane, Doniol-Valcroze and Mosnier2017), thus overlap was also analysed with a 2 km buffer around anthropogenic use areas.
Results
Baleen whale sightings and distribution
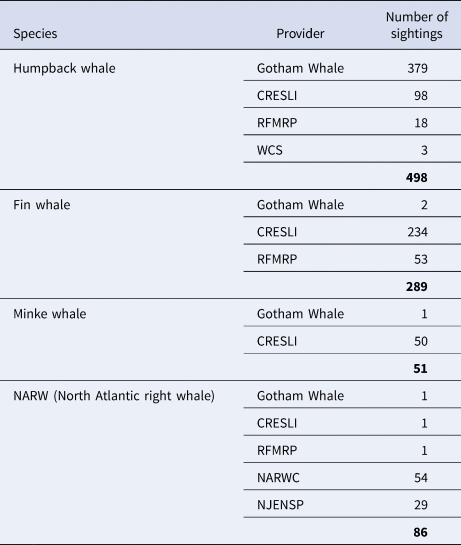
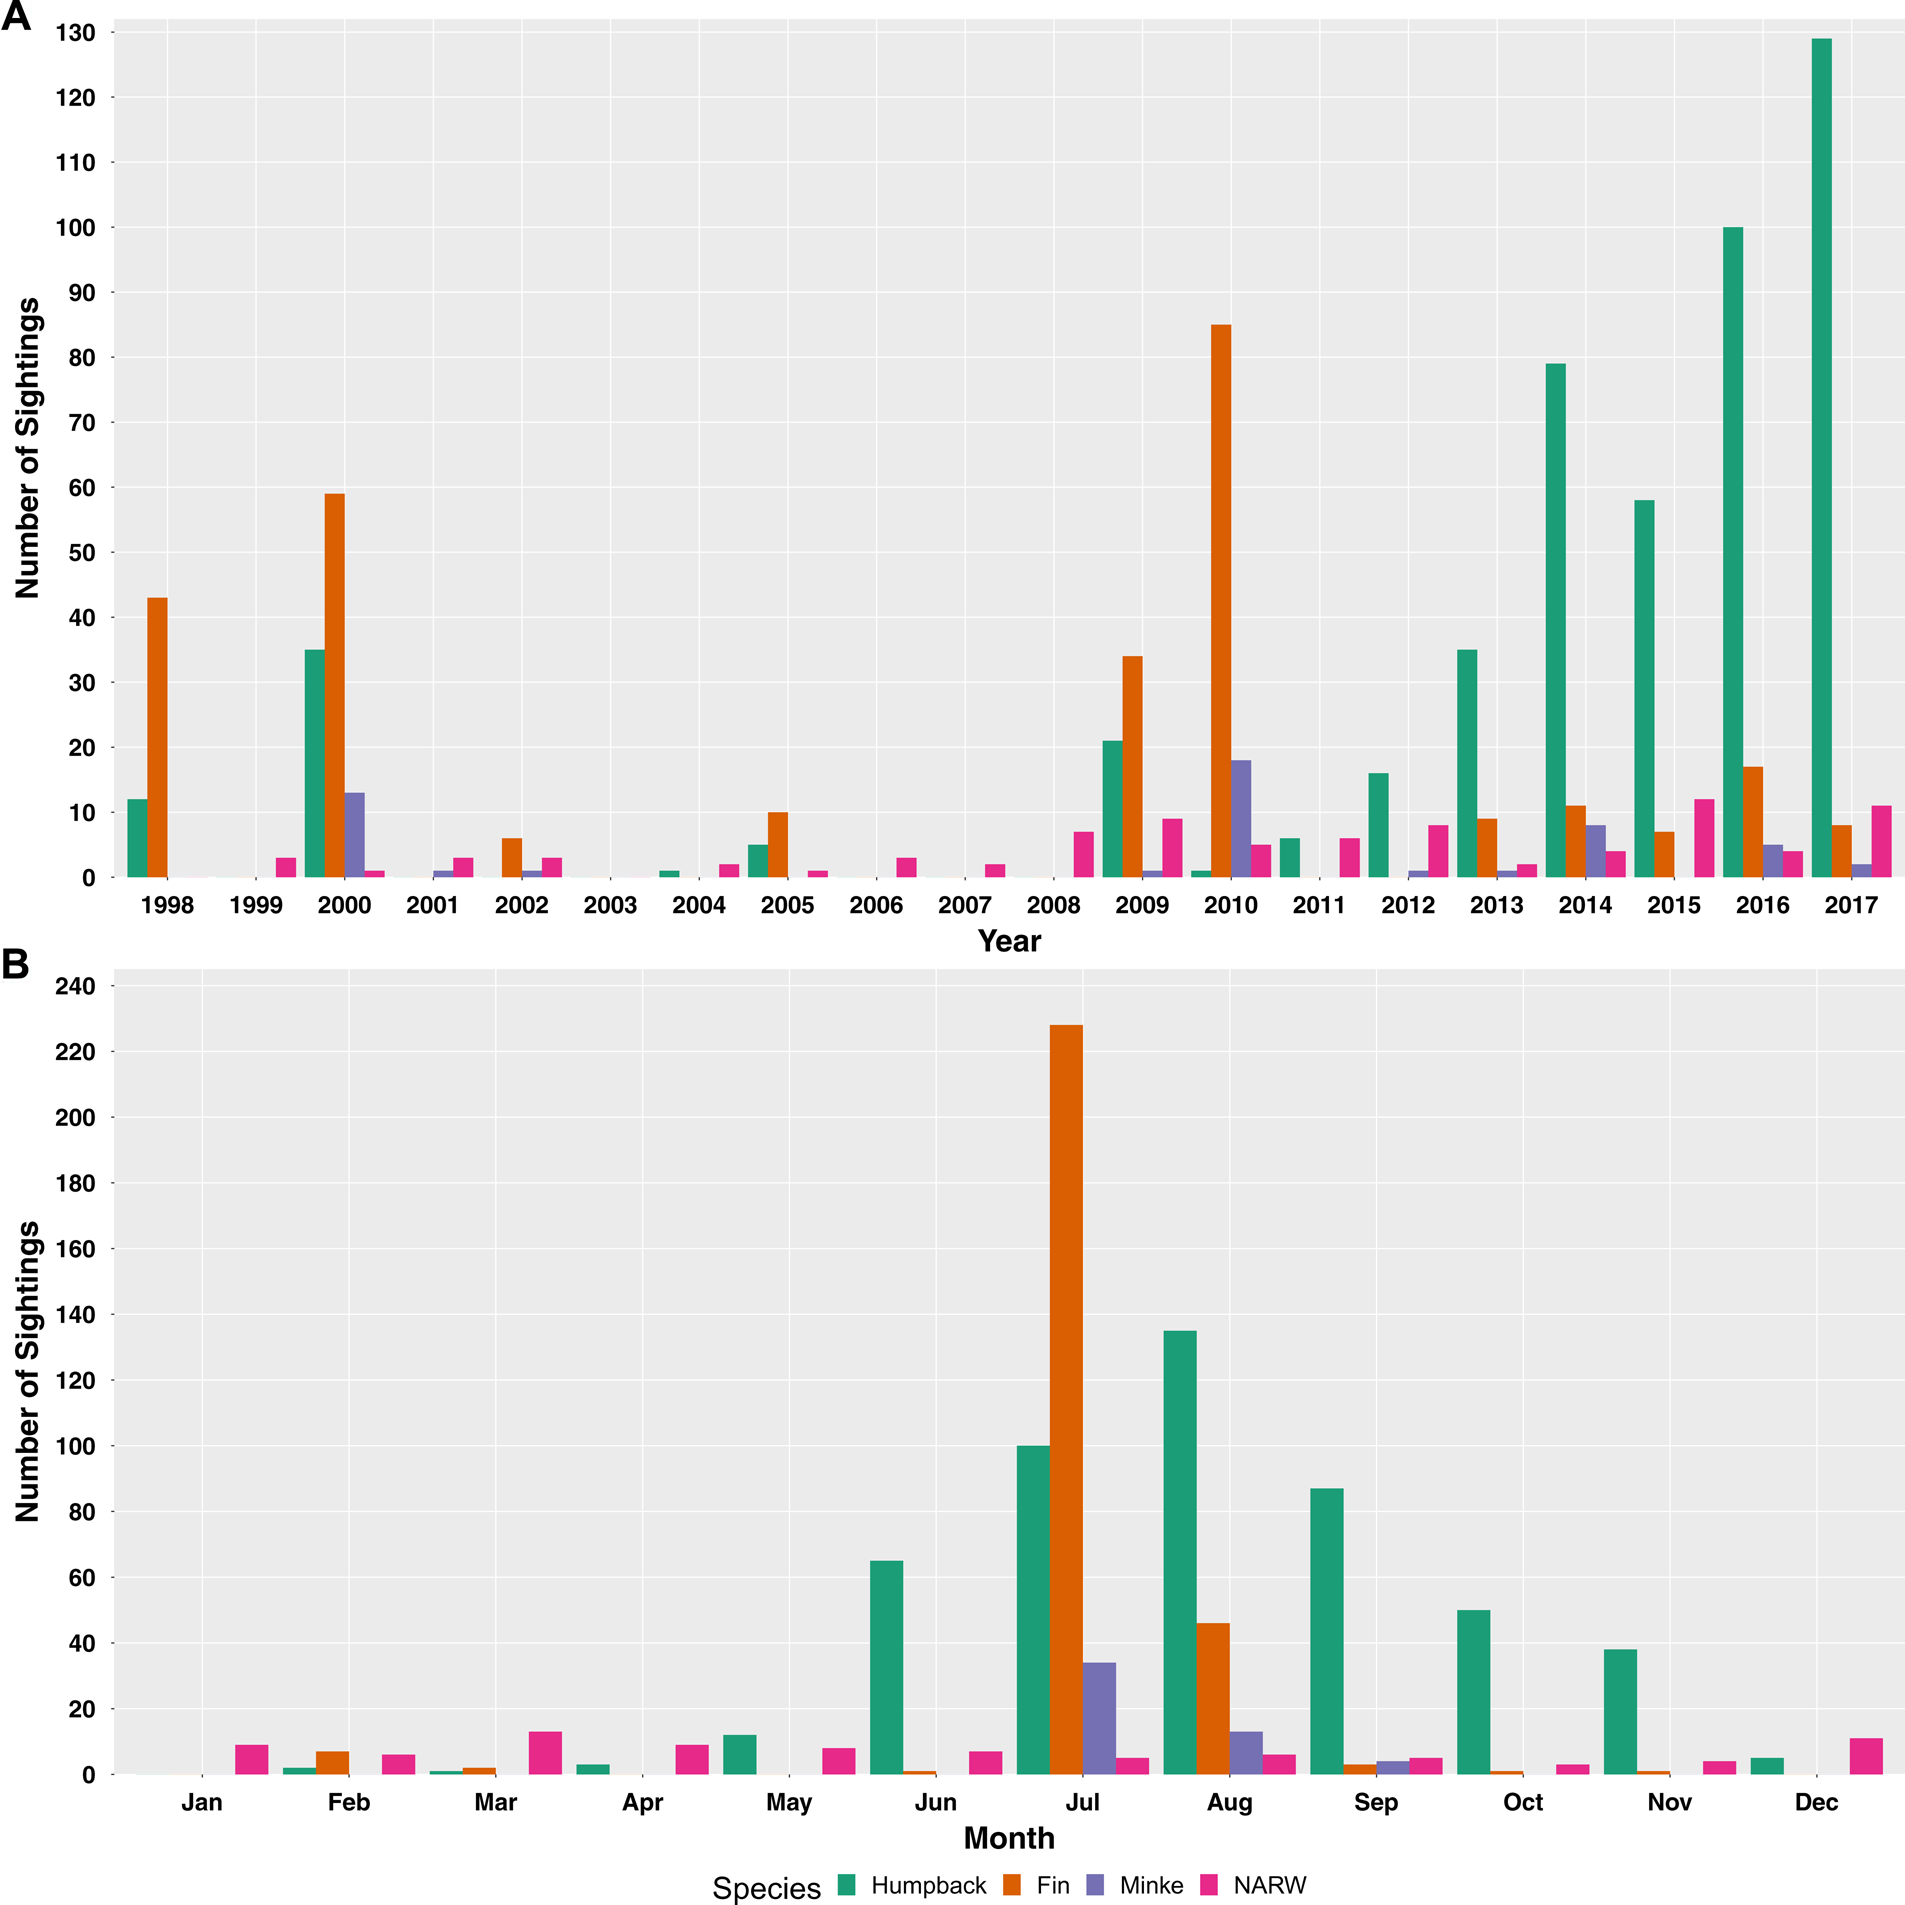
Four baleen whale species were sighted: humpback whale (Megaptera novaeangliae), fin whale (Balaenoptera physalus), North Atlantic minke whale (Balaenoptera acutorostrata acutorostrata; hereafter referred to as minke whale) and North Atlantic right whale (Eubalaena glacialis). From 1998–2017, just over 900 sightings were collected, with 498 humpback whale, 289 fin whale, 51 minke whale and 86 NARW sightings (Table 1). A majority of sightings were obtained from this past decade compared with the previous decade (648 sightings 2010–2017 vs 276 sightings 1998–2009; Figure 1A) and from summer and early autumn, June–September (Figure 1B), when more favourable weather allows for longer and a greater number of trips. Whale-watching trip sightings were reported by CRESLI and Gotham Whale.
The number of baleen whale sightings collected from 1998–2017, by species and provider (Gotham Whale, CRESLI – Coastal Research and Education Society of Long Island, RFMRP – Riverhead Foundation for Marine Research and Preservation, WCS – Wildlife Conservation Society, NARWC – North Atlantic Right Whale Consortium, and NJENSP – New Jersey Department of Environmental Protection, Division of Fish and Wildlife, New Jersey Endangered & Nongame Species Program)

Note that the number of sightings does not necessarily reflect the number of individuals.
(A) The total number of sightings per year by species during the study period (1998–2017); (B) the total number of sightings per month across the study period, by species (NARW – North Atlantic right whale).

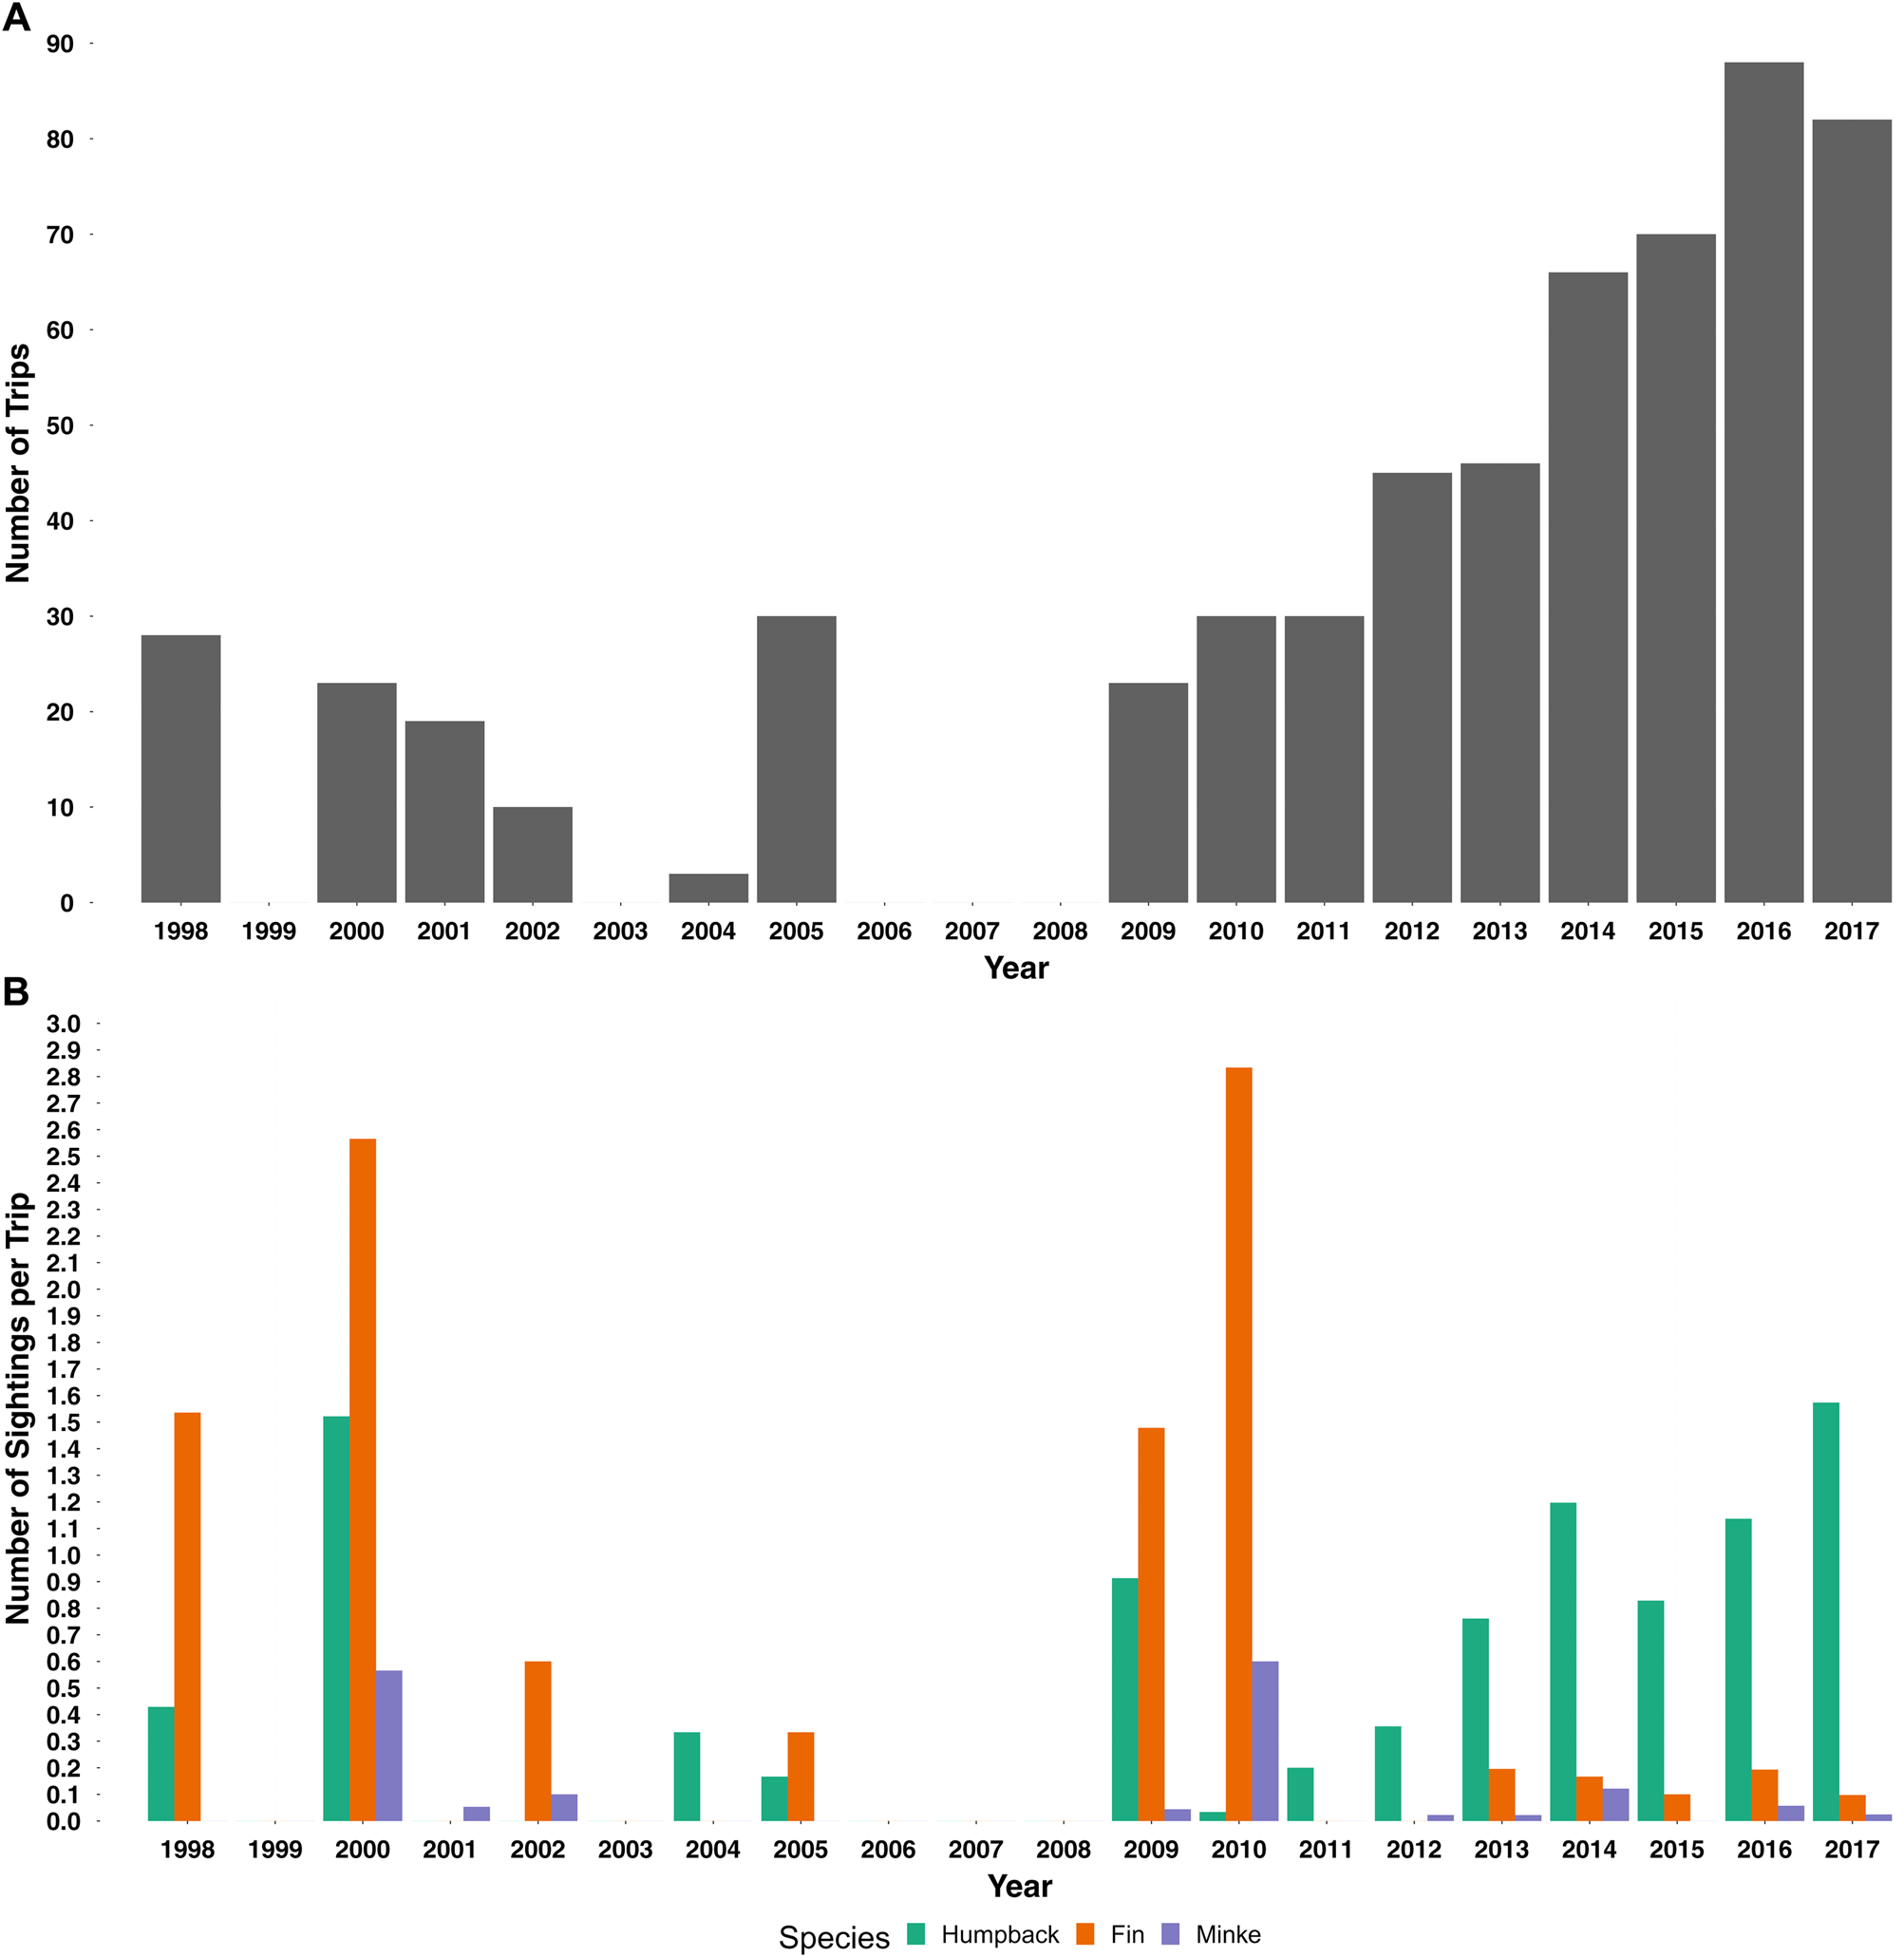
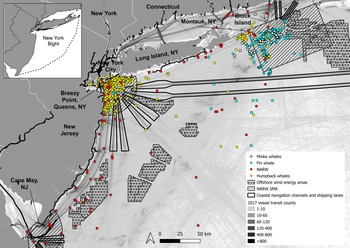
Humpback whales were seen throughout the year and study area, generally in coastal areas with some sightings further from shore (Figures 1B and 3). A majority of humpback whale sightings occurred in the New York Bight apex, off New York City (Brown et al., Reference Brown, Robbins, Sieswerda, Schoelkopf and Parsons2018, Reference Brown, Sieswerda and Parsons2019) (Figure 3) and were reported by individuals onboard a whale-watching vessel that conducts regular trips within this area. Humpback whales observed here were estimated to be juveniles based on their body length (Brown et al., Reference Brown, Robbins, Sieswerda, Schoelkopf and Parsons2018). Larger groups of humpback whales (of up to 16 individuals) were seen off Montauk compared with smaller groups off the New York City area and western Long Island. Feeding was observed throughout the study area and time period, including mother-calf pairs, nursing calves and cooperative feeding off Montauk (A.H. Kopelman, pers. comm., 25 March 2021). Interestingly, the number of humpback whale sightings per trip appears to have increased in recent years (Figure 2). This observation is likely concentrated in the New York Bight apex as the majority of humpback whale sightings were reported in the vicinity from whale-watching trips.
(A) The number of trips per year across all data sources; (B) the number of sightings per trip for each year by species. North Atlantic right whales (NARW) were not included as they were reported independently.

Study area and baleen whale sightings within the New York Bight (Cape May, New Jersey to Montauk, New York (shown in top left inset)).

Fin whales were also seen throughout the year, with sightings more concentrated off Montauk (Figures 1B and 3). Though part of this concentration of fin whale sightings was due to focused effort in that area from whale-watching trips, it is worth noting that there were only two fin whale sightings in the New York Bight apex in 10 years of regular and increasing effort there (DMB, unpublished data). In general, fin whale sightings were relatively further from shore compared with humpback whale sightings, and fin whale groups tended to be larger than those of humpback whales, with groups of up to 24 individuals observed off Montauk. Fin whales were also observed feeding, and mother-calf pairs and nursing calves were seen off Montauk.
Minke whales were only seen from July–September generally off eastern Long Island and Montauk (Figures 1B & 3). Similar to fin whales, they were more commonly seen further from shore than humpback whales. Again, despite considerable effort in the New York Bight apex, only one minke whale was sighted in the 10 years of effort there. A majority of sightings were of single individuals though some larger groups (4–12 individuals) were documented, with surface lunges and apparent feeding amongst humpback and fin whales observed (A.H. Kopelman, pers. comm., 27 January 2022).
Sightings of NARW occurred throughout the year (Figure 1B) and across the New York Bight (Figure 3). Organizations off eastern Long Island and the New York Bight apex each documented one NARW sighting in 2005, 2015 and 2016. In other reported sightings, mother-calf pairs and apparent feeding were observed throughout the New York Bight, as were sightings of individuals entangled in fishing gear. A surface-active group was observed off New York. The majority of sightings were of individuals or pairs, with one sighting documenting an estimated 11 individuals.
Overlap with human activities
Out of 924 baleen whale sightings, 43 (~5%) overlapped with coastal navigation channels, shipping lanes or offshore wind energy areas. Including a 2 km buffer around these three anthropogenic use areas increased the number of overlapping sightings to 226 (~24%). Of the 86 NARW sightings, 23 (27%) occurred within the spatial bounds of the NARW SMAs; of those 23, only 11 (<13% of the total number of NARW sightings) occurred during the months when the SMAs are in effect.
Discussion
Including these observations from non-systematic surveys and platforms of opportunity in published literature is timely as they provide a context for baleen whale distribution and behaviour in the New York Bight during a time when significant increases in human activities are concerning for conservation of locally threatened species and the critically endangered NARW. Ongoing UMEs and increasing human activities, such as shipping, commercial fishing and forthcoming offshore wind energy development, pose potential threats to baleen whales by way of vessel strikes and entanglement in fishing gear. Humpback, minke and NARW UMEs document evidence of human interaction (vessel strikes and entanglement) in many of the carcasses (NOAA, 2021b, 2021c, 2021d). These activities also contribute to increased ocean noise, which can lead to impacts ranging from communication masking to habitat modification, and hearing damage to injury (Jensen & Silber, Reference Jensen and Silber2003; Southall et al., Reference Southall, Bowles, Ellison, Finneran, Gentry, Greene, Kastak, Ketten, Miller, Nachtigall, Richardson, Thomas and Tyack2007; Clark et al., Reference Clark, Ellison, Southall, Hatch, van Parijs, Frankel and Ponirakis2009; Henry et al., Reference Henry, Cole, Hall, Ledwell, Morin and Reid2013; Weilgart, Reference Weilgart and Butterworth2017).
Including a 2 km buffer around anthropogenic use areas increased the number of overlapping sightings from 43 to 226, which represents a quarter of all sightings synthesized here. This is likely an underestimate of the real risk to baleen whales as anthropogenic use areas do not account for vessel speed or vessels transiting outside of designated shipping lanes (as evidenced by vessel transit counts in Figure 3; also see vessel traffic data on the Northeast Ocean Data Portal) and cumulative impacts, nor do sightings locations account for fine-scale movements and occupancy time in and around anthropogenic use areas. A large part of increasing vessel strike risk is likely due to the forthcoming increase in vessel traffic between ports and offshore wind farms for maintenance and upkeep during offshore wind operational phases. It is crucial to mention that these trips between ports and offshore wind farms will occur throughout the year and each year the wind farm remains operational, further contributing to ocean noise and cumulative impacts on baleen whales in the area. It should also be noted that vessel transit counts shown in Figure 3 only illustrate one year of data, while any other increase in vessel traffic to support offshore wind farms will be on-going for some time. Humpback whale sightings synthesized here (1998–2017) appeared closer to shore than fin and minke whale sightings (potentially due to seasonal shifts and prey type/availability; King et al., Reference King, Chou, Rekdahl, Trabue and Rosenbaum2021; Zoidis et al., Reference Zoidis, Lomac-McNair, Ireland, Rickard, McKown and Schlesinger2021; Smith et al., Reference Smith, Brown, Oliveras, Sieswerda, Ahearn and Reiss2022), and may not overlap spatially with shipping lanes and offshore wind energy areas; however, all sightings coincided with some level of vessel traffic (Figure 3). In the New York Bight, close encounters between baleen whales and recreational boats have also been observed (Brown et al., Reference Brown, Sieswerda and Parsons2019; Stepanuk et al., Reference Stepanuk, Heywood, Lopez, DiGiovanni and Thorne2021; WCS, unpublished data; see also LoBue, Reference LoBue2020 for information on how to avoid harmful interactions) and potential impacts of particular concern include vessel strikes and behavioural disturbance (Scheidat et al., Reference Scheidat, Castro, Gonzalez and Williams2004; Schaffar et al., Reference Schaffar, Madon, Garrigue and Constantine2009; Neilson et al., Reference Neilson, Gabriele, Jensen, Jackson and Straley2012).
Compiling NARW histories in the New York Bight can play a very important role for this critically endangered species as impacts from increasing human activities are currently moderated by a single NARW SMA off the Port of New York and New Jersey (New York City area), where vessel speed restrictions are in effect 1 November through 30 April each year (NOAA, 2020a, Figure 3).Footnote 1 Another NARW SMA exists at the entrance of the Delaware Bay, which overlaps with Cape May, New Jersey, and at Block Island just off Montauk, New York (NOAA, 2020a, Figure 3). While implementing vessel speed restrictions are beneficial for reducing vessel strikes and ocean noise (e.g. van der Hoop et al., Reference van der Hoop, Vanderlaan, Cole, Henry, Hall, Mase-Guthrie, Wimmer and Moore2015; Vancouver Fraser Port Authority, 2020), baleen whale sightings synthesized in this study occurred throughout the year and study area – beyond the spatial and temporal bounds of the NARW SMAs. Only 11 of the 86 (<13%) NARW sightings occurred within the spatial bounds of the NARW SMAs during the months when the SMAs are in effect. Also of considerable importance is that these opportunistic sightings continue to be reported but are rarely captured in the literature or data portals. For example, there was a NARW sighting in August 2021 made from shore near Jones Beach, Long Island (relayed to WCS by the New York State Young Birders Club), and another NARW sighting in November 2021 near the Throgs Neck Bridge in western Long Island Sound (relayed to WCS by City Island Oyster Reef). The latter sighting seems to be the western-most extent of any confirmed NARW in the Long Island Sound. Platforms of opportunity (whale-watching vessels) in past years typically were not operating during the time period when SMAs were in effect, thus it is probable that the number of NARW sightings synthesized here are an undercount. Furthermore, when in effect, recent data show only 20% and 60% vessel speed compliance at the Port of New York and New Jersey SMA and Delaware Bay SMA, respectively (NOAA, 2020c; Oceana, 2021). The Port of New York and New Jersey run a voluntary Clean Vessel Incentive Program (see https://panynj.gov/port/en/our-port/sustainability) that provides financial incentives to encourage practices and technologies that reduce emissions such as vessel speed reductions. Vessel speed reductions via the Clean Vessel Incentive Program occur within the same boundaries as the NARW SMA off New York City, potentially providing additional protection for baleen whales in that area year-round. While SMAs are useful in reducing risk from vessel strikes (Conn & Silber, Reference Conn and Silber2013), they do not account for whales present outside the space and time when the SMA is in effect, as seen in this synthesis (see also Laist et al., Reference Laist, Knowlton and Pendleton2014). Dynamic ocean management (see Maxwell et al., Reference Maxwell, Hazen, Lewison, Dunn, Bailey, Bograd, Briscoe, Fossette, Hobday, Bennett, Benson, Caldwell, Costa, Dewar, Eguchi, Hazen, Kohin, Sippel and Crowder2015) may be a useful approach as mitigation measures, such as temporary Slow Zones (triggered by a sighting or acoustic detection of NARW; NOAA, 2020b), can be adapted to reflect shifts in baleen whale occupancy and use throughout the New York Bight as impacts from human activities and climate change take place (e.g. in Gulf of Maine where climate change has shifted both prey and NARW foraging patterns; Pershing et al., Reference Pershing, Alexander, Hernandez, Kerr, Le Bris, Mills, Nye, Record, Scannell, Scott, Sherwood and Thomas2015; Record et al., Reference Record, Runge, Pendleton, Balch, Davies, Pershing, Johnson, Stamieszkin, Ji, Feng, Kraus, Kenney, Hudak, Mayo, Chen, Salisbury and Thompson2019). However, more incentive-based or mandatory regulations (see Oceana, 2021) are needed as non-compliance in voluntary Mid-Atlantic Slow Zones jumped to a high of 80% in 2020 (Oceana, 2021).
These data, while dependent on effort and more opportunistic in nature than standardized or systematic survey data, are clearly important in informing the context of baleen whales in the New York Bight. Continuation of these efforts provides valuable data for coastal waters, where many of the whale-watching operations occur, and where broad-scale survey efforts typically under-survey (e.g. Roberts et al., Reference Roberts, Best, Mannocci, Fujioka, Halpin, Palka, Garrison, Mullin, Cole, Khan, McLellan, Pabst and Lockhart2016; King et al., Reference King, Chou, Rekdahl, Trabue and Rosenbaum2021; Zoidis et al., Reference Zoidis, Lomac-McNair, Ireland, Rickard, McKown and Schlesinger2021). Additionally, efforts to integrate multiple data types are greatly needed to inform management of potential impacts from increasing anthropogenic pressures. For example, an incorporation of opportunistic and systematic data into a single distribution model is underway, and could provide the most comprehensive understanding of baleen whale occurrence and distribution in the New York Bight and inform best management practices for forthcoming offshore wind energy development. Standardization across organizations, both in effort and data collection methods, would also be beneficial for data synthesis and for providing more detailed information in a more comprehensive fashion across the region going forward. Even though this analysis may not provide a ‘perfect’ baseline due to the opportunistic nature of the data, it represents the only detailed baseline available in the region prior to recent broad-scale survey efforts. The synthesis and dissemination of two decades' worth of data here represents invaluable behavioural and habitat use information, which will aid in managing and mitigating against increasing anthropogenic pressures in the already heavily human-dominated New York Bight.
Data
The datasets used and/or analysed during the current study are available from the corresponding author upon reasonable request.
Acknowledgements
We thank Dr Ricardo Antunes, Christopher Spagnoli, Allison Chaillet DePerte, Catherine Granton, and Caroline Good for their support in collecting and synthesizing data, and to Merry Camhi, Maia Murphy, and the WCS NY Seascape team for their efforts to support this work. Also, thanks to Caroline Good for helpful feedback that strengthened our manuscript. Thanks to the trained and dedicated CRESLI volunteers for their help in rigorous data collection, and thanks to the Viking Fleet and their captains for allowing decades of whale-watching trips. We are also grateful to American Princess Cruises, and Gotham Whale staff: David S. Rosenthal, Catherine Granton, Kristi A. Collom, Artie Raslich, Celia Ackerman, Mitchell Steinhardt and Merryl Kafka for their data collection and management efforts. RFMRP aerial surveys were conducted under permits to Robert A. DiGiovanni Jr. as PI: Scientific Research Permit #1036-1744-00, with support from NOAA NEFSC grant #NA04NMF4720396, and National Fish and Wildlife Foundation through a Section 6 grant to the NYS DEC. Additional support for this work was provided by the Stavros Niarchos Foundation (SNF) to WCS. We are grateful to John McMurray and Jim Miller for providing valuable local knowledge, and Carissa King for her help in data collection.
Authors’ contributions
HCR and MLR conceived of the study; HCR, AHK, DMB, PLS, RAD Jr. and EC acquired the data; EC led the analysis, and EC, MLR and HCR drafted the manuscript. All authors provided feedback and approval of the submitted manuscript.
Financial support
Not applicable.
Conflict of interest
The authors declare that they have no competing interests.
Ethical standards
No ethical approval or consent to participate was required.