I. INTRODUCTION
Nickel–aluminum bronze (NAB) alloy is widely used for marine equipment such as propeller, pump, valve etc. due to the high mechanical properties and excellent corrosion resistance. As a quaternary system, NAB alloy typically contains 9–12 wt% Al and 6 wt% each of Fe, Ni, and Mn.Reference Jahanafrooz, Hasan, Lorrmer and Ridley1,Reference Hasan, Jahanafrooz, Lorimer and Ridley2 The addition of alloying elements improves the mechanical properties and inhibits the formation of γ2 phase (Al4Cu9), which is harmful to the corrosion resistance due to the high Al content.Reference Culpan and Rose3 Typical microstructure of as-cast NAB includes ɑ matrix phase, martensite β phase (β′ phase), iron rich κⅰ, κⅱ, κⅳ, and nickel rich κⅲ phases. According to Nakhaie's study, the anodic character of κ phases with tens of millivolt higher than copper rich ɑ phase, which increases the galvanic corrosion of NAB alloy.Reference Nakhaie, Davoodi and Imani4 The NAB alloy is also easily subjected to the selective phase corrosion in seawater.Reference Nakhaie, Davoodi and Imani4,Reference Wharton and Stokes5 It is well accepted that the corrosion of NAB is initially confined to the ɑ phase within the ɑ + κⅲ eutectoid microstructure.Reference Neodo, Carugo, Wharton and Stokes6
To improve the corrosion and mechanical properties of cast NAB alloy, several techniques have been used such as equal channel angular extrusion,Reference Gao and Cheng7,Reference Gao and Cheng8 friction surfacing,Reference Hanke, Fischer, Beyer and Santos9 and friction stir processingReference Ni, Xiao, Ma, Qiao and Zheng10–Reference Song, Zheng, Ni and Ma13 etc. It is commonly reported that these techniques significantly improves the corrosion and mechanical properties of as-cast NAB alloy due to the refined grains and simplified microstructure. However, it is difficult to use these techniques in real produce for large NAB propeller due to the low efficiency and high cost.
Heat treatment is traditionally used to modify the microstructure and improve the mechanical properties of NAB alloy in real produce.Reference Chen, Liang, Zhang, Zhang, Luo and Li14 Moreover, the simplified microstructure of ɑ, β′, and fine κⅱ phases can be also obtained when NAB alloy is cooled from the temperature of 860–930 °C at a high cooling rate,Reference Anantapong, Uthaisangsuk, Suranuntchai and Manonukul15 which is expected to improve the corrosion resistance of NAB alloy due to the decrease of galvanic corrosion. Therefore, the heat treatment of quenching followed by tempering is chosen in this study.
In addition, the fatigue properties are the main essential consideration on the marine application of NAB alloy. Chakrabarti et al.Reference Chakrabarti, Sarkar, Saravanan, Nagesha, Sandhya and Jayakumar16 reported that mean stress, defect size, and surface proximity had a significant influence on the high cycle fatigue life of cast NAB. CzyrycaReference Czyryca, Newman and Piascik17 found that both casted and weld NAB showed large closure loads, and the higher crack growth rate is due to the residual stress in the weldment. The microstructure also has a significant influence on the fatigue crack growth behavior of materials.Reference Shi, Zeng, Shi, Wang and Jia18,Reference Verdhan, Bhende, Kapoor and Chakravartty19 For titanium alloy, the thick ɑ platelets can deflect the main crack and thus slow the Fatigue crack growth rate (FCGR), while thin ɑ platelets can be cut easily by main crack.Reference Shi, Zeng, Shi, Wang and Jia18 The acicular and lamellar ɑ phases are most favorable to deflecting the main crack and improve the fatigue crack growth resistance compared to large primary ɑ grains and smaller transformed ɑ + β lamellae.Reference Verdhan, Bhende, Kapoor and Chakravartty19 However, the effects of microstructures on the fatigue crack growth behavior of NAB alloy have rarely been investigated.
In this study, as-cast NAB alloy is heat treated at different temper temperatures after quenching at 920 °C and the fatigue crack growth tests are performed using direct current potential drop (DCPD) method. The fatigue crack growth behavior of heat treated NAB alloy is investigated, and then the effects of microstructures and secondary cracks on the fatigue crack growth behavior of heat treated NAB alloy are discussed.
II. EXPERIMENTAL PROCEDURE
The NAB cast ingot with a dimension of ϕ150 mm × 200 mm is prepared by nonvacuum melting. The chemical composition of the cast NAB is determined by fluorescence spectrophotometer, as shown in Table I. The as-cast microstructure of NAB alloy includes ɑ matrix phase, martensite β phase (β′ phase), κⅱ, κⅲ and κⅳ phases (Fig. 1). The samples for fatigue crack growth test are heated up to 920 °C for 1 h followed by water quenching. After that, the samples are tempered at 350, 450, and 550 °C for 2 h, respectively, and then air cooling (coded as QT-350, QT-450, and QT-550, respectively). The samples for microstructure observation are cut, cold mounted, grounded, polished, and then etched by a solution of 5g FeCl3+2 ml HCl+95 ml C2H5OH. Phase structure is identified by a D8 ADVANCE x-ray diffractometere (XRD; D/max-IIIA, Rigaku, Tokyo, Japan) with Cu Kα radiation at room temperature. Tensile samples with gauge section of 15 mm × 4 mm × 1.5 mm are machined and then are tested on ZwickT1-Fr020 TN.A50 at the strain rate of 10−3 s−1.
The chemical composition of as-cast NAB alloy.

SEM micrograph of as-cast NAB alloy microstructure.

Fatigue crack growth tests are performed on a DLU-50 test machine from Bairuo (Shanghai, China) using three-point bending samples according to ASTM E399 and ASTM E647 standards. Figure 2 shows the exact dimensions of test sample. “U ref” is the reference voltage drop, and “U ac” is the main voltage drop. All fatigue crack growth tests are conducted at a stress ratio (R = K min/K max) of 0.3 with a sine-wave loading frequency of 1 Hz at room temperature. DCPD crack length measurement devices are used to monitor the crack propagation in computer based on the finite element analysis of electricity distribution. The stress intensity factor K is controlled by a software in accordance with ASTM E399. Fatigue fracture surface and crack propagation path from side surface of heat treated samples are observed by Sirion 200 scanning electron microscope (SEM; JEM-2100F, JEOL, Tokyo, Japan).
The dimensions of samples for fatigue crack growth test.
III. RESULTS
A. Microstructure
1. Heat treatments of NAB alloy
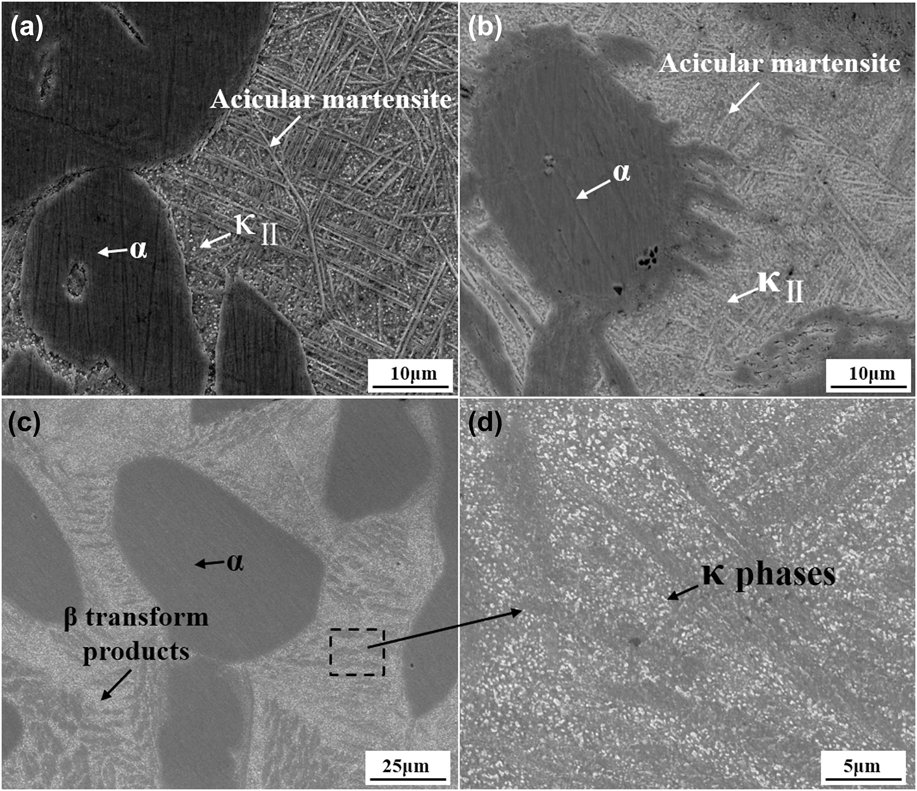
Figure 3 shows the microstructure of NAB alloy with different heat treatments. It can be seen that the microstructure of heat treated NAB alloy is significantly different from that of the as-cast one (Fig. 1). For QT-350 sample, the microstructures include α, κⅡ, and β′ phases [Fig. 3(a)]. The κⅡ and β′ phases are formed during quenching. The present result is consistent with Anantapong's study,Reference Anantapong, Uthaisangsuk, Suranuntchai and Manonukul15 which reports that α, κⅡ, and β′ phases are formed when NAB alloy is cooled from peak temperature of 860–930 °C at a high cooling rate. Figure 3(b) shows the microstructure of QT-450 sample. In comparison with lower temper temperature (350 °C), the amount of acicular martensite phase decrease and that of κⅡ phase increase. This indicates that acicular martensite phase decomposes and κⅡ phase is precipitated during tempering treatment. With further increasing temper temperature to 550 °C, acicular martensite phase disappears totally and more κ grains are formed. It is suggested that acicular martensite phase is transformed to α (Cu) and κ phases completely when the quenched sample is tempered at 550 °C.
SEM images of NAB alloy with different heat treatment. (a) QT-350, (b) QT-450, (c) QT-550 and (d) Enlarged image of the area inside the square frame shown in Fig. 3(c).
2. X-ray diffraction pattern analysis
Figure 4 shows the x-ray diffraction patterns of NAB alloy with different heat treatments. The curve of sample quenched at 920 °C is also included. As can be seen, in comparison with as-cast sample, quenched sample shows lower α (Cu) phase peaks and the (Fe, Ni) Al peaks disappear. It is indicated that the solution of (Fe, Ni) Al phases and α (Cu) phase into β phase occurs and large quantity of β phase are formed when the NAB alloy is heated to 920 °C. The quenching treatment leads to the formation of acicular β′ martensitic phase, which is consistent with SEM observation results [Fig. 3(a)]. The peaks of β′ martensitic phase decrease and that of α (Cu) and (Fe, Ni) Al phases increase with increase of temper temperature (see QT-350 and QT-450 curves). This indicates that β′ phase transfers to α (Cu) phase and (Fe, Ni) Al phases during tempering. With further increasing the temper temperature to 550 °C, the peaks of β′ martensite phase disappear completely, which indicates that β′ martensitic phase transfers to α (Cu) and (Fe, Ni) Al phases totally.
The x-ray diffraction patterns of NAB alloy with different heat treatment.
B. Tensile properties
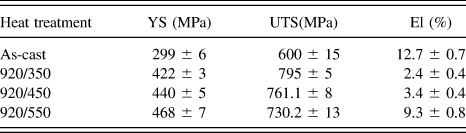
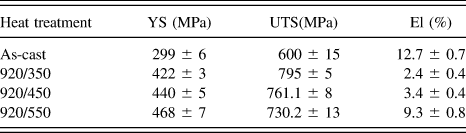
Figure 5 shows the stress–strain curves of NAB alloy at different heat treatment. The tensile properties are shown in Table II. As can be seen, the mechanical properties change significantly after different heat treatments. The QT-350 sample exhibits highest ultimate tensile strength and lowest elongation. The ultimate tensile strength decreases and the elongation increases with increase of temper temperature. With further increasing the temper temperature to 550 °C, the ultimate tensile strength and elongation are 730.2 ± 13 and 9.3 ± 0.8, respectively.
Engineering stress–strain curves of the NAB alloy with different heat treatment.
Tensile properties of NAB alloy with different heat treatment.
C. Fatigue crack growth rate
Figure 6 shows the FCGR for the heat treated NAB alloy in log–log coordinate. A distinct Paris' regime with different microstructures is illustrated followed this relationship:
 $${{{\rm{d}}a} \over {{\rm{d}}N}} = C{\left( {\Delta K} \right)^n}\quad ,$$
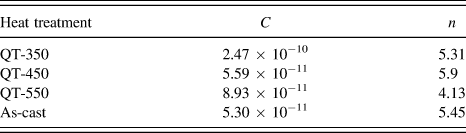
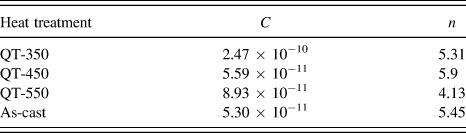
where C and n are the constants related with material variables, environment, frequency, temperature, and stress ratio. ΔK is the stress intensity factor range in MPa m1/2 and dα/dN is the FCGR in mm/cycle. It can be found that the FCGR of as-cast and the QT-550 samples is lower than that of QT-350 and QT-450 samples. At low ΔK-levels, as-cast sample has a higher FCGR than QT-550 sample and opposite result is obtained at high ΔK-levels. The material related constants C and n obtained from the intersections and slopes of log–log plots (Fig. 6) are shown in Table III. C and n values of the Paris modal are significantly different for various heat treatments, indicating that these parameters are closely related to the microstructure of materials.
Fatigue crack propagation curves of NAB with different heat treatments.
Material related constants C and n for NAB with different heat treatment.
D. Crack profile and fractography
Figure 7 shows the crack propagation path of heat treated NAB alloy at lower ΔK region. As seen in Fig. 7(a), the fatigue crack of as-cast NAB alloy prefers to propagate either following the α + κIII interfaces, passing through β′ phase, cutting off the α + κIII lamellar, or going along with the interface of α and κII phases rather than passing through α grains [As indicated by A, B, C, and D respectively in Fig. 7(a)]. The direction of main crack can be changed by κII, κIII, and β′ phases, which lead to the formation of crack deflection and thus slow crack propagation rate. It can be seen from Figs. 7(b)–7(d) that the fatigue crack of QT-350 and QT-450 samples prefer to propagate toward α phase. However, the main crack of QT-350 sample prefers to propagate along α/β′ phases boundaries [Fig. 7(b)] and that of QT-450 sample pass through α phases [Fig. 7(c)]. The main crack of QT-550 sample propagates in a flat way [Fig. 7(d)], which indicates that the crack path is insensitive to the microstructure. It is worth mentioning that secondary cracks can be found in all samples. A few large secondary cracks can be seen in QT-350 sample [Fig. 7(b)], while large number of small secondary cracks can be found in QT-550 sample [See yellow arrows in Fig. 7(d)].
SEM images of fatigue crack propagation paths of NAB alloy with different heat treatment at lower ΔK region. (a) As-cast, (b) QT-350, (c) QT-450, (d) QT-550.
IV. DISCUSSION
A. Effect of microstructure
Based on above the analysis, the microstructure of NAB alloy has a significant influence on fatigue crack growth behavior. The microstructures of as-cast sample are favorable to deflecting the main crack and increasing the crack path tortuosity. While the QT-550 sample exhibits a flat crack path and it can be expected that the sample has higher FCGR. However, the QT-550 sample has a higher FCGR than that of as-cast sample at low ΔK region and opposite result is obtained at high ΔK region.
To understand the significant variation in FCGR at low and high ΔK region, the fracture surfaces of as-cast and heat treated samples at low ΔK region are examined by SEM, as shown in Fig. 8. Large quantities of facets are observed on fracture surfaces of all heat treated samples [seen in Figs. 8(b)–8(d)], which indicate that the fatigue mechanism of heat treated NAB alloy is controlled by cleavage fracture at low ΔK region. This also can explain the lower FCGR of QT-550 sample that material with cleavage failure has a faster FCGR than that of striations failure.Reference Pilchak20 It is worth mentioning that some voids with α phase morphology are observed on the fracture surface of QT-350 sample [see yellow arrows in Fig. 8(b)], which is remained when the main crack propagates through α/β′ grains boundaries. While some α grain planes are found on the fracture surface of QT-450 sample [see Fig. 8(c)]. The observation of large quantities of α grain voids and planes on the fracture surfaces of QT-350 and QT-450 samples respectively indicates that their fracture mechanisms are controlled by intergranular and transgranular fracture, respectively. In other word, the main crack of QT-350 and QT-450 samples propagate toward α phase. This may be due to the higher hardness of β′ phase which can hamper the propagation of the main crack. For QT-350 sample, the crack prefers to propagate along α/β′ boundaries. This is because there is a high diversity between α and β′ phases and the diversity decreases with increase of temper temperature. When the sample is tempered at 450 °C, the main crack can cut the α phase easily. Thus the crack of QT-450 sample prefers to propagate through α phase. This can also explain the lower FCGR of QT-450 sample that the transgranular fracture has a lower FCGR that intergranular fracture. With further increasing the temper temperature to 550 °C, β′ phase transforms to α(Cu) and κ phases and the diversity between α and β′ transformation products diminishes. Thus the main crack propagates in a flat way.
SEM images of the fracture surfaces for the heat treated NAB alloy at low ΔK region. (a) As-cast, (b) QT-350, (c) QT-450, (d) QT-550.
As seen in Figs. 8(a) and 8(d), although some fine striates are observed on the fracture surface, the fracture mechanism is predominantly controlled by cleavage failure. The fracture surface of as-cast sample is rougher than that of QT-550 sample. The κⅡ gains, voids with κⅡ morphologies and α + κIII lamellar are observed on the fracture surface [see yellow arrow and circle in Fig. 8(a)]. It is indicated that the microstructure can deflect crack path and increase the fatigue crack growth resistance. This can explain the reason why lower FCGR of as-cast sample is obtained compared with QT-550 sample at low ΔK region. The crack deflection effect of microstructure at low ΔK region has been reported in other materials.Reference Ghonem21–Reference Wang, Pan, Wei, Li and Wang23 Shi et al.Reference Shi, Zeng, Shi, Wang and Jia24 studied the effects of microstructure on the fatigue crack growth behavior for titanium alloy and claimed that at low ΔK region, the crack tip plastic zone was small and the cleavage fracture dominated the fatigue crack propagation mechanism. Thus the microstructure could deflect the main crack and increased the fatigue crack growth resistance.
Figure 9 shows the fractographies and crack profile for the as-cast and QT-550 samples at high ΔK region. It can be found that as-cast sample exhibits a flat fracture surface, while the as-cast sample shows a rough fracture surface at low ΔK region. This indicates that the deflection effect of as-cast microstructure diminishes at high ΔK region. Moreover, large quantity observations of striations on the fracture surfaces of as-cast and QT-550 samples indicate that the fatigue crack mechanism is controlled by striation crack. Therefore, we believe that crack tip plastic zone size increases with increase of ΔK and the fatigue striation mechanism becomes a main fracture mechanism when the crack tip plastic zone reach a critical value. Thus, the crack deflection effect caused by microstructure can exert little influence on the FCGR resistance, which leads to a higher FCGR of as-cast sample at high ΔK region. In addition, the martensite transformation products of QT-550 sample contain large amount of finer κ phases [Fig. 9(d)]. These finer κ phases can increase the fatigue crack growth resistance because the dislocations can be shared by small-coherent precipitates which are localized in different width planar bands, then make glide more or less reversible during cyclic loading. This planar reversible slip is claimed to decrease the FCGR by increasing tip deflection and reducing damage accumulation.Reference Wang, Pan, Wei, Li and Wang23,Reference Chakrabarti, Sarkar, Saravanan, Nagesha, Sandhya and Jayakumar25,Reference Borrego, Costa, Silva and Ferreira26
SEM images of fractography and crack profile and for NAB alloy. (a) As-cast, (b) Magnified image of the area inside square frame shown in Figs. 9(a), (c) QT-550, (d) The crack profile of QT-550 sample.
B. Effect of secondary crack
Secondary cracks are observed in fatigue fracture surface of all samples, as shown in Fig. 7. A few large secondary cracks can be seen in the QT-350 sample and the secondary cracks diminish with increase of temper temperature [Seen in Figs. 7(b)–7(d)]. The secondary cracks are responsible for the deceleration of crack growth by consuming the energy of crack tip.Reference Li, Kang and Kuang27 However, the FCGR of heat treated samples decrease with increase of temper temperature. This is because of the high dislocation density and deformation potency of heat treated samples with lower temper temperature.Reference Li, Kang and Kuang27 When the NAB alloy are tempered at 350 and 450 °C, the dislocation density and stored energy may be higher than the as-cast and QT-550 samples. As the fatigue cracks propagate, the movement of dislocations and release of stored energy are beneficial to the formation of secondary cracks. The secondary cracks diminish with increase of temper temperature due to the release of stored energy [Figs. 7(a)–7(c)]. Figure 9(d) shows detailed observation of crack propagate path of QT-550 sample. A large number of small secondary cracks can be found, which can consume the energy of crack tip and slow the FCGR.Reference Li, Kang and Kuang27 Moreover, when the sample is tempered at 550 °C, the martensite phase transforms to α (Cu) phase and κ phases totally. The martensite transformation products are tougher, and thereby effectively reduce the crack tip driving force by mechanisms of crack tip blunting and deflection.Reference Li, Kang and Kuang27 Therefore, QT-550 sample has lowest FCGR although the main crack propagates in a flat way.
V. CONCLUSIONS
The main conclusions drawn on the basis of the experimental results are summarized as follows:
(1) The microstructure of NAB alloy heat treated by quenching followed tempering contains α, κⅡ, and β′ phases. The β′ phase transforms to α (Cu) and κ phases with the increase of temper temperature. When temper temperature is increased to 550 °C, the martensite phase disappears.
(2) The FCGR of heat treated NAB alloy decreases with increase of temper temperature. The as-cast sample has a lower FCGR than QT-550 sample at low ΔK region and the opposite results are obtained at high ΔK region. The deflection effect of microstructure makes a main attribution to the lower FCGR of as-cast alloy at low ΔK region, while the deflection effect diminishes at high ΔK region, which leads to the higher FCGR of as-cast alloy.
(3) The main cracks of QT-350 and QT-450 samples propagate toward α phase due to the higher hardness of martensite phase. The crack of QT-350 sample prefers to propagate along the α/β′ boundaries due to the diversity of these phases. As the temper temperature is increased to 450 °C, the crack prefers to pass through α grains. With further increasing the temper temperature to 550 °C, the crack propagates in a flat way.
(4) A few large secondary cracks are obtained at QT-350 sample and the secondary cracks diminish with increase of temper temperature. The QT-550 sample has a large number of small secondary cracks, which is responsible for higher fatigue crack growth resistance.
ACKNOWLEDGMENTS
Financial support of this research provided by 973 Program under Grant No. 2014CB046701, National Science Foundation under Grant No. 51302168, Shanghai Postdoctoral Sustentation Fund under Grant No. 14R21410900, China Postdoctoral Science Foundation (Grant No. 2014M561471, 2014M550235).