Implications
Under resting conditions, Merino and Terminal sired lambs differ significantly in their metabolic response to feed deprivation up to 48 h. Merino sired lambs demonstrated a significantly greater non-esterified fatty acids (NEFA) and β-hydroxybutyrate (BHOB) response, precipitated by a greater decline in plasma glucose. The differences sire type response to feed deprivation were in part driven by differences in genetic potential for growth and leanness. Therefore, in addition to quantifying the metabolic effects of feed deprivation, recommendations for pre-slaughter feed deprivation, particularly for Merino genotypes should be reviewed.
Introduction
Under Australian production systems, lambs may undergo periods of nutritional restriction due to various environmental and management factors. Seasonal fluctuations in feed availability and quality mean that animals must mobilise body reserves in order to meet energy demands. Alternatively, during procedures such as shearing and drenching sheep may undergo a period of complete feed deprivation of several hours. Under routine pre-slaughter protocols, lambs may undergo a period of acute feed deprivation usually less than 24 h, but which may extend up to 48 h (Jacob et al., Reference Jacob, Pethick and Chapman2005; Ferguson and Warner, Reference Ferguson and Warner2008).
During periods of acute feed deprivation metabolic energy from the utilisation of glucose or oxidation of volatile fatty acids (VFAs) produced in the rumen ceases and is replaced by increasing levels of adipose tissue mobilisation (Heitmann et al., Reference Heitmann, Dawes and Sensenig1987). This results in a normal homeostatic response, characterised by an increase in circulating NEFA and a shift towards hepatic ketogenesis through β-oxidation of long chain fatty acids, producing BHOB, in order to maintain euglycaemia and tissue energy balance (Bergman, Reference Bergman1971; Chilliard et al., Reference Chilliard, Ferlay, Faulconnier, Bonnet, Rouel and Bocquier2000; Pethick et al., Reference Pethick, Harper and Dunshea2005). In contrast, muscle glycogen concentrations in sheep appear to be unaffected by feed deprivation, even up to several days and in the absence of adrenergic stress, does not affect plasma lactate concentrations (Daly et al., Reference Daly, Gardner, Ferguson and Thompson2006; Jacob et al., Reference Jacob, Gardner and Pethick2009).
However, recent work has shown that prime lambs have very high levels of plasma NEFA, although similar levels of plasma glucose and lactate when compared to yearling cattle at slaughter following routine pre-slaughter management (Stewart et al., Reference Stewart, McGilchrist, Gardner and Pethick2014). This could be linked to greater metabolic requirements of lambs (Graham et al., Reference Graham, Searle and Griffiths1974) which has been demonstrated to increase rates of lipolysis in response to periods of nutritional restriction (Reid and Hinks, Reference Reid and Hinks1962; Foot and Russel, Reference Foot and Russel1979). Growth potential and body composition influence basal metabolic rate (Graham et al., Reference Graham, Searle and Griffiths1974), which in-turn may influence the metabolic response to feed deprivation. In human studies, skeletal muscle has been shown to have a higher resting metabolic rate than adipose tissue (Usui et al., Reference Usui, Takahashi, Gando, Sanada, Oka, Miyachi, Tabata and Higuchi2009), thus animals with proportionately greater amounts of lean tissue and higher growth rates are likely to have greater maintenance energy requirements (Graham et al., Reference Graham, Searle and Griffiths1974; Webster, Reference Webster1981; Kolstad and Vangen, Reference Kolstad and Vangen1996; Wang et al., Reference Wang, Ying, Bosy-Westphal, Zhang, Schautz, Later, Heymsfield and Müller2010). As such, more muscular and higher growth lambs, as commonly seen among terminal breed types, would be expected to have a greater glucose requirement. During acute feed deprivation this may also lead to increased mobilisation of adipose tissue to provide NEFA and BHOB as an alternative source of fuel for muscle to meet their energy requirements (Hocquette et al., Reference Hocquette, Ortigues-Marty, Pethick, Herpin and Fernandez1998).
Currently, it is not well understood how the metabolic response to feed deprivation is influenced by genetic selection for increased growth, muscling and leanness. However, there is evidence that genetically divergent animals differ metabolically. For example, more muscular genotypes have an increased adipose tissue response to adrenaline, leading to increased NEFA mobilisation in sheep (Martin et al., Reference Martin, McGilchrist, Thompson and Gardner2011) and cattle (McGilchrist et al., Reference McGilchrist, Pethick, Bonny, Greenwood and Gardner2011). During fasting, a similar effect is observed with leaner and more muscular lines of sheep have a greater increase in plasma NEFA concentration in response to feed deprivation (Cameron, Reference Cameron1992). Likewise, rams selected for low back fat thickness had lower glucose concentrations during fasting than those selected for high back fat (Carter et al., Reference Carter, McCutcheon and Purchas1989; Van Maanen et al., Reference Van Maanen, McCutcheon and Purchas1989). This indicates that leaner and more muscular animals may utilise more fat as an energy source during feed deprivation.
This study tested the hypothesis that Terminal sired lambs will have decreased plasma glucose and increased plasma NEFA and BHOB concentrations in response to feed deprivation up to 48 h compared to Merino sired lambs. Selection for growth, leanness and muscling in sheep is achieved through the use of Australian Sheep Breeding Values (ASBVs) for post-weaning weight (PWT), post-weaning fat depth (PFAT) and post-weaning eye muscle depth (PEMD). Therefore, it was hypothesised that the metabolic changes due to feed deprivation would also be greater in progeny of sires with greater growth (PWT), muscling (PEMD) and leanness (PFAT) breeding values.
Material and methods
Animals and procedures
This experiment assessed the impact of feed deprivation in lambs over a 48 h period on plasma metabolite responses, and was repeated for three replicate groups. Data were collected from 89 lambs (330 to 350 days old) produced by the Meat and Livestock Australia Genetic Resource Flock, Katanning, Western Australia. The design of the Meat and Livestock Australia Genetic Resource flock (formally known as the Sheep Co-Operative Research Centre (Sheep CRC) Information Nucleus Flock) has been described previously (Fogarty et al., Reference Fogarty, Banks, van de Werf, Ball and Gibson2007; Van der Werf et al, Reference van de Werf, Kinghorn and Banks2010). Merino sired (22 female, 23 wethers) and Terminal sired (23 ewes, 21 wethers) lambs were the progeny of Merino dams artificially inseminated using 15 Terminal (Poll Dorset, Suffolk, White Suffolk, Texel) and 17 Merino (Merino, Poll Merino) sires. Sires used had a range in ASBVs for PEMD, PFAT and PWT (Table 1).
Mean, standard deviation and range for live animal measures, sire Australian Estimated Breeding Values (ASBV) and carcass composition parameters in Merino and Terminal sired lambs

Lambs were transported to Murdoch University and managed together in a small paddock with minimal dry feed and ad libitum access to a commercial pelleted ration (EasyOne®; Milne Feeds™ (Welshpool, Western Australia), Analysis on dry matter basis: CP (min) 14.5%, Metabolisable Energy 11.0 MJ/kg, Crude Fibre (max) 20.0%, Urea (max) 1.8%, Vitamin E 60 mg/kg, Selenium 300 μg/kg, Lasalocid Acid 37.0 ppm), for 7 days before being randomly assigned to one of three replicates, balanced for sex, sire type and sire identification.
On day 0, lambs from replicate 1 were walked to the animal house facility via a laneway adjacent to the paddock. Lambs were weighed and randomly assigned to individual pens. Lambs were acclimatised to individual pens for 5 days and fed the same commercial pelleted ration once a day at 4% live weight per day. Individual feed intakes were measured daily and lambs had ad libitum access to water. On day 4, the neck area on all lambs was clipped to facilitate jugular cannulisation. On day 5, lambs were weighed and indwelling jugular cannulas were inserted. The site was prepared with 2% chlorhexidine and 70% ethanol and 1 ml lignocaine hydrochloride (Lignocaine 20; Ilium®, Glendenning, New South Wales, Australia) was injected subcutaneously around cannula site. The jugular vein was then punctured with a needle (14 gauge 1.5 inch; Monoject™, Macquarie Park, New South Wales, Australia) and polythene tubing (Microtube extrusions Pty Ltd, Eastwood, New South Wales, Australia; internal diameter = 1.00 mm, outer diameter = 1.50 mm) was passed through the needle and inserted into 20 cm into the vein. The cannula was then flushed using heparinised saline via three-way tap (BD Connecta LuerLok™, North Ryde, New South Wales, Australia) and secured. The neck area was then bandaged (Tensoplast® Vet, BSN medical, Mount Waverley, Victoria, Australia) to maintain the cannula patency.
On day 6, remaining feed was measured and then removed from all animals at time 0 (0800 am). Blood samples were collected at time 0, 2, 6, 12, 18, 24, 30, 36, 42 and 48 h of feed deprivation. Before blood sample collection, 2 ml of blood was withdrawn and discarded. Blood samples were collected into Lithium heparin S-Monovette Vacutainer® (Sarstedt Australia Pty. Ltd, South Australia). Post-sampling, cannulas were flushed with 5 ml of heparinised 0.9% saline. Blood tubes were immediately placed on ice. Within 30 min of sample collection, blood samples were centrifuged at 4°C for 15 min at 3000 rpm. Plasma samples were pipetted into 2 ml micro-tubes and then stored at −20°C. Following final blood collection at 48 h of feed deprivation, lambs were weighed, cannulas were removed from lambs and feed was provided. Lambs were monitored for 24 h before being moved back to the paddock with the other lamb replicate groups. The same procedures were repeated in succession for replicate 2 lambs from day 9 and replicate 3 lambs from day 18.
Approximately 3 weeks following completion of the third replicate, lambs were slaughtered as part of a commercial feed deprivation trial (Stewart et al., Reference Stewart, McGilchrist, Gardner and Pethick2018). Carcass weight and composition traits were measured including; hot carcass weight (HCWT), GR tissue depth, M. longissimus lumborum (loin) weight (LLWT) and M. longissimus lumborum (loin) fat weight (LLFAT) (Table 1).
Plasma sample analysis
Frozen plasma samples were allowed to thaw once to ∼2°C at room temperature and then were gently inverted several times, after which 100 μl was pipetted into sample cups for analysis. Laboratory analyses of plasma were carried out as a batch using the Olympus AU400 automated chemistry analyser (Olympus Optical Co. Ltd, Melville, NY, USA). Plasma NEFA concentration was analysed using a NEFA-C kit (C Kit Wako Pure Chemical Ind., Osaka, Japan; modified for the Olympus AU400 Automated Chemistry Analyser). Plasma BHOB was analysed using a commercial kit (Randox Laboratories kit, County Antrim, UK; Ranbut, Cat. No. RB1007). Glucose analysis was carried out using the glucose reagent kit (Olympus Diagnostics, Tokyo, Japan, Cat. No. OSR6121) and plasma l-Lactate was analysed with a reagent kit (Olympus Diagnostics, Cat. No. OSR6193).
Statistical analysis
Glucose, NEFA, BHOB, and lactate concentrations were analysed using linear mixed effect models (SAS Version 9.1; SAS Institute Cary, NC, USA). In each model, fixed effects for sire type, sex, time off feed as well as relevant interactions were tested. Random terms included lamb identification within sire identification and replicate.
Plasma glucose was included as a covariate in the base statistical model for NEFA to determine their association during feed deprivation. Likewise, NEFA was included as a covariate in the base statistical model for BHOB to determine their association during feed deprivation. Residuals from the response surface were tested for normality. Non-significant terms (P > 0.05) were removed in a stepwise manner.
Hot carcass weight, live weight and percentage live weight change were included separately into each base model as covariates to determine whether animal size or acclimation period had an impact on metabolite response to feed deprivation.
In addition, GR tissue depth, LLWT and LLFAT were included separately into each base model only with HCWT as covariates to represent the impact of relative composition (muscling or fatness) on the metabolic responses to feed deprivation. Non-significant (P > 0.05) terms were removed in a stepwise manner.
In a separate analysis, NEFA, BHOB, glucose and lactate responses to feed deprivation were tested for associations with sire ASBVs for PWT, PEMD and PFAT. Initially all three ASBV’s were included as covariates in the model, as well as their first-order interactions with other terms including sire type and non-significant (P > 0.05) terms were removed in a stepwise manner. Due to the difference in PWT ranges for Merino and Terminal sired lambs (Table 1), the PWT term was analysed within sire type. Due to the correlations that exist between ASBVs in this data set (Merino sired lambs: PWT v. PEMD = 0.75; PWT v. PFAT = 0.62; PEMD v. PFAT = 0.85; Terminal sired lambs: PWT v. PEMD = 0.33, PWT v. PFAT = 0.17, PEMD v. PFAT = 0.71), this process was repeated with the ASBVs one at a time to test the independence of their effects.
Results
Effect of sire type on the plasma glucose concentration response to feed deprivation
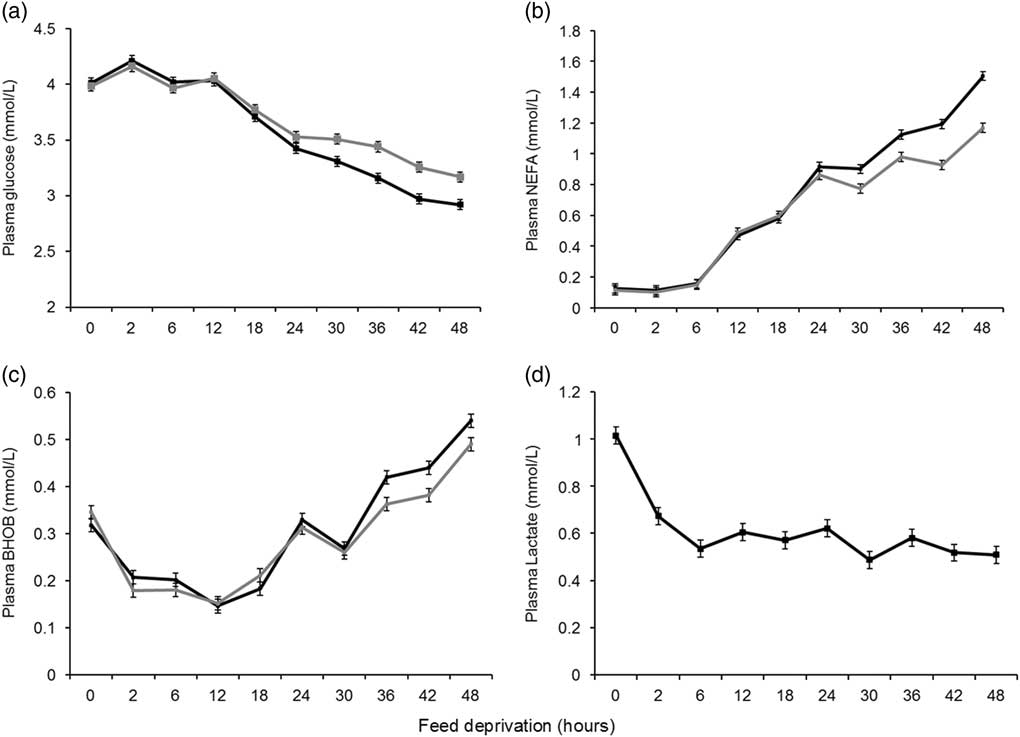
There was a significant association between duration of feed deprivation and plasma glucose concentration (P < 0.01, Table 2). From 0 to 12 h there was minimal change, however, as time off feed increased from 12 to 48 h, plasma glucose concentration decreased by 25% from 4.04 to 3.04 mmol/L, across all lambs. Glucose concentration also differed between sire types (P < 0.01, Table 2) and the effect of feed deprivation on glucose concentration was greater for Merino sired lambs compared to Terminal sired lambs from 30 h of feed deprivation (Figure 1a). In Merino sired lambs, glucose concentration decreased by 27%, from 4.03 to 2.92 mmol/l between 12 to 48 h of feed deprivation. In Terminal sired lambs, this decrease was smaller, with glucose concentration only decreasing by 22% from 4.06 to 3.17 mmol/l between 12 to 48 h of feed deprivation. Merino and Terminal sired ewe and wether lambs differed in glucose concentration (P < 0.05, Table 2). This difference was observed in Merino ewe lambs (3.49 ± 0.06 mmol/l), which had lower (P < 0.05) glucose concentrations than Merino wether lambs (3.66 ± 0.06 mmol/l) and Terminal sired ewe (3.69 ± 0.06 mmol/l) and wether lambs (3.67 ± 0.06 mmol/l).
F-values and numerator and denominator degrees of freedom for the base models for non-esterified fatty acids (NEFA), β-hydroxybutyrate (BHOB), glucose and lactate concentration in lambs during feed deprivation

1 NDF, DDF numerator and denominator degrees of freedom.
* P < 0.05;
** P < 0.01.
Table of figures showing effect of feed deprivation on (a) plasma glucose concentrations ± SE; (b) non-esterified fatty acid (NEFA) concentrations ± SE; (c) β-hydroxybutyrate (BHOB) concentrations ± SE in Merino sired lambs (black lines) and Terminal sired lambs (grey lines); (d) plasma lactate concentrations ± SE in all lambs (black line).

The sire type differences in glucose response to feed deprivation remained unchanged when the model was corrected for phenotypic covariates such as live weight, HCWT, LLFAT, LLWT or GR tissue depth.
There was a curvilinear association between live weight and glucose concentration (P < 0.05) which was evident from 18 h of feed deprivation (P < 0.05). The greatest magnitude of effect was observed at 42 h of feed deprivation. Between a live weight of 40 and 50 kg, plasma glucose decreased from 3.25 ± 0.092 mmol/l to 3.03 ± 0.051 mmol/l and increasing live weight from 50 to 62 kg was associated with an increase in plasma glucose from 3.03 ± 0.051 mmol/l to 3.50 ± 0.135 mmol/l.
Effect of feed deprivation on plasma non-esterified fatty acid and β-hydroxybutyrate concentrations
Feed deprivation had a significant effect on NEFA concentration (P < 0.01, Table 2). From 0 to 6 h of feed deprivation there was no change in NEFA concentration, however, as time off feed increased from 6 to 48 h, NEFA concentration increased by 1.18 mmol/l from 0.15 to 1.33 mmol/l. Non-esterified fatty acids concentration also differed between sire types (P < 0.01, Table 2) and the effect of feed deprivation on NEFA was greater in Merino sired lambs than Terminal sired lambs (P < 0.01, Table 2). Between 6 and 48 h of feed deprivation plasma NEFA concentration in Merino sired lambs increased by 1.35 mmol/l, whereas in Terminal sired lambs NEFA concentration only increased by 1.02 mmol/l (Figure 1b).
Feed deprivation had a significant effect on BHOB concentrations (P < 0.01, Table 2). Initially from 0 to 12 h, BHOB decreased by 0.18 mmol/l from 0.33 to 0.15 mmol/l and from 12 to 48 h it increased by 0.37 mmol/l from 0.15 to 0.52 mmol/l. The effect of feed deprivation on BHOB concentration differed between sire types (P < 0.01, Table 2) and was greatest in Merino sired lambs. From 12 h of feed deprivation BHOB increased by 0.39 mmol/l in Merino sired lambs compared to an increase of 0.34 mmol/l in Terminal sired lambs (Figure 1c). The effects of sire type and feed deprivation on NEFA and BHOB remained unchanged when the model was corrected for phenotypic covariates such as live weight, HCWT, LLFAT, LLWT or GR tissue depth, yet these covariates themselves demonstrated associations with NEFA and BHOB.
Increasing carcass fatness was associated with a decrease in NEFA response during feed deprivation (P < 0.05), however, this was only significant at 24, 30 and 36 h of feed deprivation. The magnitude of effect was greatest at 36 h with an increase in LLFAT from 100 to 500 g, associated with a decrease in NEFA of 0.29 mmol/l from 1.02 ± 0.05 to 0.73 ± 0.07 mmol/l. There was a weak negative association between GR tissue depth and average NEFA concentration (P < 0.05), which decreased by 0.15 mmol/l (from 0.73 to 0.59 mmol/l) across the 8 to 29 mm GR tissue depth range. There was no association (P > 0.05) between NEFA and live weight, live weight change or LLWT.
Live weight had a small although inconsistent effect on the BHOB response (P < 0.05), an effect that was significant at 18, 24 and 48 h of feed deprivation. The association was greatest at 48 h, with an increase in live weight from 40 to 62 kg associated with a 16% decrease in BHOB concentration from 0.56 ± 0.022 to 0.47 ± 0.024 mmol/l. Similarly, increasing HCWT was associated with decreasing BHOB concentration at 24 and 48 h of feed deprivation (P < 0.05). The greatest change was observed at 48 h of feed deprivation where increasing HCWT from 17 to 30 kg, was associated with a decrease in BHOB of 0.10 mmol/l from 0.56 ± 0.028 to 0.47 ± 0.024 mmol/l. There was no association (P > 0.05) between BHOB and live weight change, LLFAT, LLWT or GRFAT.
Association between plasma non-esterified fatty acids and glucose concentration
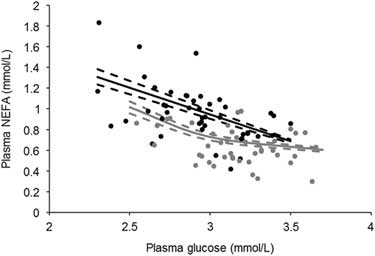
From 24 h of feed deprivation onwards there was a negative association between plasma NEFA and plasma glucose concentration (P < 0.05). This association was strongest at 48 h of feed deprivation. At this time point in Merino sired lambs decreasing plasma glucose from 3.5 to 2.3 mmol/l, was associated with a 0.62 mmol/l increase in plasma NEFA concentration (Figure 2). This effect was less in Terminal sired lambs where a decrease in glucose from 3.7 to 2.5 mmol/l was associated with an increase in NEFA of only 0.41 mmol/l (Figure 2). This pattern was consistent across all time points from 24 to 48 h. Furthermore, when glucose was included as a covariate in the NEFA base model, there was no effect (P > 0.05) on the sire type NEFA response to feed deprivation.
Association between non-esterified fatty acid (NEFA) and glucose concentration at 48 h of feed deprivation ± SE (dashed lines) in Merino sired lambs (black lines) and Terminal sired lambs (grey lines). Icons denote Merino  and Terminal
 sire residuals from the response surface.

Association between plasma β-hydroxybutyrate and non-esterified fatty acid concentration
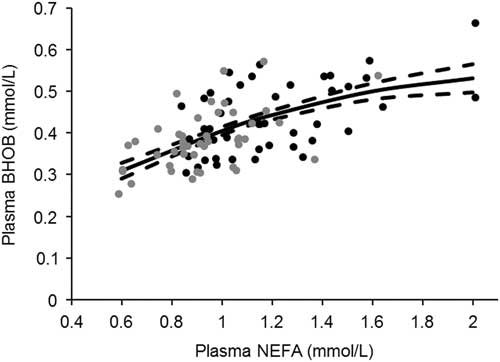
There was an association between plasma BHOB concentration and NEFA concentration which gradually inverted over time (P < 0.05). At 0 h, the association was negative with an increase in NEFA from 0.03 to 0.2 mmol/l associated with a decrease in BHOB from 0.36 ± 0.014 mmol/l to 0.30 ± 0.013 mmol/l. From 12 h onwards the association was positive, increasing in magnitude until 42 h of feed deprivation where an increase in plasma NEFA from 0.6 up to 1.6 mmol/l was associated with an increase in plasma BHOB of 0.19 mmol/l (Figure 3). This effect was the same for both sire types across all time points.
Association between β-hydroxybutyrate (BHOB) and non-esterified fatty acid (NEFA) concentration (mmol/l) at 42 h of feed deprivation ± SE (dashed lines). Icons denote Merino and Terminal sire residuals from the response surface.

Effect of feed deprivation on plasma lactate concentrations
Plasma lactate concentrations were affected by time (P < 0.05, Table 2). From 0 to 6 h of feed deprivation plasma lactate concentration decreased by 0.48 mmol/l (P < 0.01, Figure 1d) after which levels stabilised, with only small and inconsistent differences observed between time points (P < 0.05, Figure 1d). Lactate concentrations were affected by sex (P < 0.05, Table 2) and were 20% higher for female lambs (1.12 ± 0.063 mmol/l) compared to male lambs (0.91 ± 0.063 mmol/l) but only at 0 h of feed deprivation. Plasma lactate response was not affected (P > 0.05) by phenotypic covariates such as live weight, HCWT, LLFAT, LLWT or GR tissue depth.
Effect of sire and sire breeding values on the metabolic response to feed deprivation
When sire ASBVs for PWT, PEMD and PFAT were tested, glucose, NEFA and BHOB levels demonstrated associations with PWT and PFAT. There was no association (P > 0.05) between PEMD and glucose, NEFA or BHOB concentration.
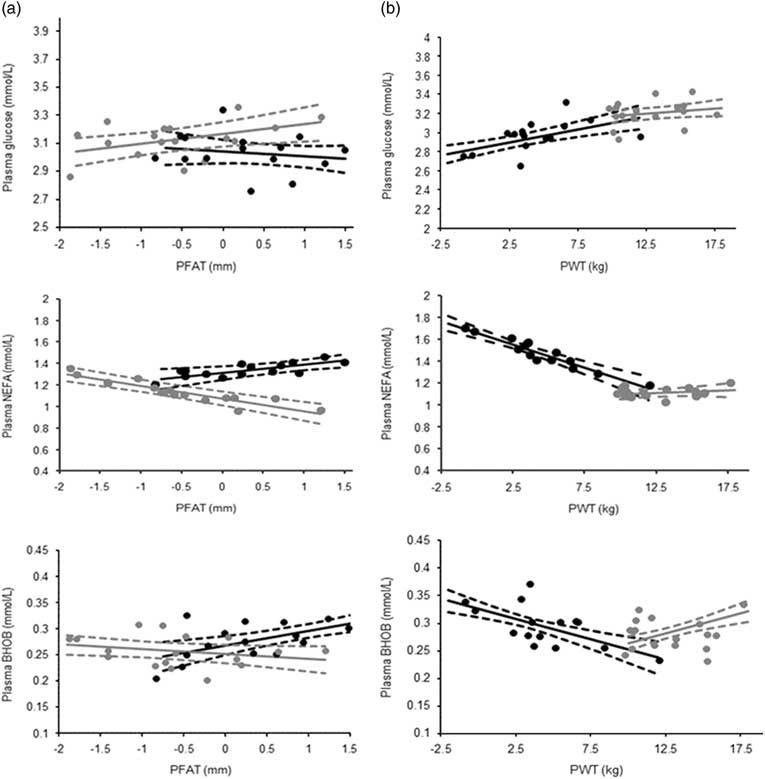
There was a positive association (P < 0.05) between glucose and PFAT in Terminal sired lambs that was consistent across all time points from 0 to 48 h of feed deprivation. Increasing PFAT from −1.8 to 1.2 mm was associated with a 0.21 mmol/l increase in plasma glucose concentration (Figure 4(1a)). The effect of PFAT on glucose was no longer significant (P > 0.05) when it was included alone as a covariate in the base glucose model. The association between glucose levels and PFAT was not evident in Merino sired lambs (P > 0.05). There was a trend (P < 0.1) for an association between glucose and PWT in Merino sired lambs. This pattern was consistent across all time points from 0 to 48 h of feed deprivation. Increasing PWT from −2.0 to 12 mm was associated with a 0.33 mmol/l increase in plasma glucose concentration (Figure 4(1b)). The magnitude of this effect was reduced by ∼35% when PWT was included separately in the base glucose model. There was no association between glucose and PWT in Terminal sired lambs (P > 0.05).
Table of figures showing association between plasma glucose (mmol/l), plasma non-esterified fatty acid (NEFA) (mmol/l) and β-hydroxybutyrate (BHOB); and post-weaning fat depth (PFAT) (mm) and post-weaning weight (PWT) (kg). Australian Sheep Breeding Values in Terminal (grey line and ± SE) and Merino (black line and ± SE) sired lambs. Icons denote Merino and Terminal sire residuals from the response surface.

In Terminal sired lambs, PFAT demonstrated a negative association with plasma NEFA from 36 h of feed deprivation (P < 0.05). As PFAT increased from −1.8 to 1.2 mm, plasma NEFA concentration decreased by ∼0.36 mmol/l at 36, 42 and 48 h of feed deprivation (Figure 4(2a)). The magnitude of this effect was reduced by ∼40% when PFAT was included separately in the base NEFA model. There was no association (P > 0.05) between PFAT and the NEFA response to feed deprivation in Merino sired lambs (Figure 4(2a)). In Merino sired lambs, PWT was negatively associated with NEFA concentration from 30 h of feed deprivation (P < 0.05). The strongest association was at 48 h of feed deprivation, with an increase in PWT from −1 to 12 kg associated with 34% decrease in NEFA concentration from 1.75 to 1.15 mmol/l (Figure 4(2b)). When PWT was included alone in the base NEFA model, the magnitude of this effect was increased by 20% and 10% at 30 and 36 h of feed deprivation and diminished by 23% and 24% at 42 and 48 h. There was no association (P > 0.05) in Terminal sired lambs (Figure 4(2b)).
In Merino lambs, PFAT demonstrated a positive association with BHOB (P < 0.05) which was consistent across all time points. As PFAT increased from −0.75 to 1.5 mm, plasma BHOB concentration increased by ∼0.06 mmol/l (Figure 4(3a)). Post-weaning fat depth was no longer significant (P > 0.05) when included as a single covariate in the base BHOB model. There was no association (P > 0.05) between PFAT and BHOB response to feed deprivation in Terminal sired lambs (Figure 4(3a)).
The association between PWT and BHOB differed for Merino and Terminal sired lambs and was consistent across all time points (P < 0.01). In Merino sired lambs, increasing PWT from −2 to 12.5 kg was associated with a 0.1 mmol/l decrease in plasma BHOB concentration (Figure 4(3b)). The opposite association was observed in Terminal sired lambs and as PWT increased from 10 to 18 kg, plasma BHOB increased by 0.06 mmol/l (Figure 4(3b)). This effect remained significant when PWT was included as a single covariate in the base BHOB model, however, the magnitude of effect was halved in Merino sired lambs.
Discussion
Effect of sire type on metabolic response to feed deprivation
Contrary to the hypothesis, Terminal sired lambs had higher plasma glucose and reduced plasma NEFA and BHOB concentrations in response to feed deprivation compared to Merino sired lambs. For both Merino and Terminal sired lambs there was little change in plasma glucose up to 12 h of feed deprivation. This may reflect supply of rumen-derived VFAs from residual feed in the early stages of feed deprivation (Bass and Duganzich, Reference Bass and Dugnazich1980; Bergman, Reference Bergman1990). The decline in plasma glucose concentrations became evident after this initial period and is likely to have coincided with a decrease in insulin : glucagon concentration ratio (Holness and Sugden, Reference Holness and Sugden1989) eliciting an increase in hepatic glycogenolysis and gluconeogenesis and increased rates of lipolysis.
Coinciding with the decline in plasma glucose, plasma NEFA and BHOB concentration increased from 6 and 12 h of feed deprivation respectively. During feed deprivation, circulating levels of rumen-derived butyrate gradually decline. This is offset by the hepatic production of BHOB via ketogenesis in response to elevated NEFA concentration from starvation induced lipolysis (Pethick et al., Reference Pethick, Harper and Dunshea2005). Merino sired lambs had the greatest increase in NEFA and BHOB concentration, a response that appears to be driven by the greater decline in plasma glucose (Pethick et al., Reference Pethick, Harper and Dunshea2005) in these lambs. The other key metabolite derived from lipolysis is glycerol, which can contribute up to 50% of glucose via gluconeogenesis (Bergman et al., Reference Bergman, Starr and Reulein1968). However, as the lipolytic response (indicated by NEFA response) was lower in Terminal sired lambs, it indicates that glycerol is unlikely to be the substrate driving the higher levels of glucose observed in Terminal sired lambs.
Alternatively, amino acid carbon derived from muscle may also contribute to the synthesis of glucose during fasting (Heitmann and Bergman, Reference Heitmann and Bergman1980; Oddy et al., Reference Oddy, Lindsay, Barker and Northrop1987) and may have contributed to the higher glucose levels in Terminal sired lambs. Increased protein degradation has been associated with reduced feed intake in breeds selected for faster growth (Oddy et al., Reference Oddy, Speck, Warren and Wynn1995; Oddy et al., Reference Oddy, Herd, McDonagh, Woodgate, Quinn and Zirkler1998). Therefore a similar effect may be seen in Terminal sired lambs during feed deprivation where higher protein turnover is contributing greater quantities of gluconeogenic substrates, resulting in the higher and more stable glucose concentrations. It is expected that an increased availability of plasma alanine would be utilised as previous work has shown that in comparison to fed sheep, the liver of sheep deprived of feed for up to 3 days removed greater amounts of alanine from portal circulation (Heitmann and Bergman, Reference Heitmann and Bergman1980). This in-turn would then explain the differences in lipolytic response to feed deprivation in Merino and Terminal sired lambs. Further work is required to understand whether a similar metabolic response to feed deprivation occurs in Merino and Terminal sired lambs under commercial conditions (Stewart et al., Reference Stewart, McGilchrist, Gardner and Pethick2017).
Unlike the effect of feed deprivation on NEFA, BHOB and glucose, time off feed had no impact on plasma lactate, supporting the initial hypothesis. This is in line with previous work that demonstrated that feed deprivation per se up to 48 h under resting conditions is unlikely to be a cause of muscle glycogen turnover and thus elevated plasma lactate concentrations (Jacob et al., Reference Jacob, Pethick and Chapman2005 Daly et al., Reference Daly, Gardner, Ferguson and Thompson2006). The higher plasma lactate observed in female lambs at time 0 may reflect greater excitement, muscle contraction and stress (Pethick et al., Reference Pethick, Miller and Harman1991; Gardner et al., Reference Gardner, Kennedy, Milton and Pethick1999) in female lambs when feed was removed combined with the first blood samples being collected.
Effect of sire breeding values on the metabolic response to feed deprivation
In support of the hypotheses, the decline in glucose and subsequent increases in plasma NEFA were greatest in the progeny of low PFAT Terminal sires. This indicates that the progeny of lean sires maintain lower plasma glucose concentrations during feed deprivation. This would result in a higher glucagon insulin ratio, stimulating lipolysis and contribute to the higher NEFA and BHOB observed in these animals (Carter et al., Reference Carter, McCutcheon and Purchas1989; Van Maanen et al., Reference Van Maanen, McCutcheon and Purchas1989). Genetically leaner lambs may also be more sensitive to the effects of glucagon, as Carter et al. (Reference Carter, McCutcheon and Purchas1989) showed that progeny from the low back fat line were also more sensitive to the lipolytic effects of glucagon, demonstrated by a greater elevation of plasma NEFA concentrations in response to intravenous administration of this hormone. Alternatively, the progeny of low PFAT sires may have a more glycolytic fibre type (Greenwood et al., Reference Greenwood, Gardner and Hegarty2006), which is likely to lead to increased glucose consumption by muscle (Hocquette et al., Reference Hocquette, Ortigues-Marty, Pethick, Herpin and Fernandez1998) and in turn may lead to the depressed levels of glucose in plasma evident in this study. This would also have resulted in a higher glucagon to insulin ratio, explaining the elevated NEFA concentrations. This parallels previous work in sheep and cattle that were selected to be more muscular and leaner and were found to have increased response to adrenaline (Martin et al., Reference Martin, McGilchrist, Thompson and Gardner2011; McGilchrist et al., Reference McGilchrist, Pethick, Bonny, Greenwood and Gardner2011). Although feed deprivation is not acting through the adrenergic axis, the associated glucagon release makes use of the same post-receptor reaction cascade leading to the mobilisation of triglyceride and the release of NEFA (Pethick et al., Reference Pethick, Harper and Dunshea2005). Therefore, this may implicate a post-receptor difference between these genetically divergent animals, with the genetically leaner lambs having up-regulated lipolytic pathways and rates of fat turnover in times of feed deprivation (Carter et al., Reference Carter, McCutcheon and Purchas1989). The negative association between NEFA and LLFAT and GR tissue depth found in the current study tends to support this assertion. While it would have been preferable to utilise composition traits measured prior to feed deprivation rather than carcass data (Stewart et al., Reference Stewart, McGilchrist, Gardner and Pethick2017). Furthermore, it does align well with the phenotypic leanness of these animals (Anderson et al., Reference Anderson, Williams, Pannier, Pethick and Gardner2015) and with previous work which demonstrated that increased selection for fatness reduced live weight losses during periods of sub-optimal nutrition (Blumer et al., Reference Blumer, Gardner, Ferguson and Thompson2013). As live weight change is correlated to fat weight change (Adams et al., Reference Adams, Blache and Briegel2002), high PFAT may be beneficial under periods of extended feed deprivation and have less impact on live weight, fat depths and other labile fat stores such as intramuscular fat. Moreover, under commercial conditions, leaner lambs may lose more weight during pre-slaughter feed deprivation, which may impact on carcass weights (Thompson et al., Reference Thompson, O’Halloran, McNeill, Jackson-Hope and May1987).
Contrary to the hypothesis, plasma BHOB was higher in high PFAT Merino sired lambs, an effect that was consistent across all time points. It is unclear why this effect was only observed in Merinos, given that a similar association between NEFA and PFAT was not found in the same animals. Furthermore, the association between PFAT and glucose and NEFA in terminal sired lambs suggests that fat mobilisation is lower in higher PFAT animals. However, the association may differ in Merinos. Genetically fatter lambs may have increased rates of ketogenesis and may be better able to maintain euglycaemia, thus reducing rates of lipolysis. A practical outcome of this may be that the progeny of high PFAT Merinos sires may be more adapted to periods of underfeeding (Blumer et al., Reference Blumer, Gardner, Ferguson and Thompson2016).
Contrary to the hypothesis, in Merino sired lambs, increased PWT was associated with higher levels of plasma glucose and a reduction in NEFA and BHOB response to extended feed deprivation (>30 h), likely due to the greater decline in insulin glucagon ratio (Holness and Sugden, Reference Holness and Sugden1989). Furthermore, correcting the model for PWT accounted for a portion of the difference in NEFA response between sire types, highlighting that this difference was partly driven by a difference in genetic growth potential. It is unclear what physiological mechanism underpins this difference between low and high growth lambs, however, increased rates of protein degradation have been observed in high growth animals during underfeeding (Bremmers et al., Reference Bremmers, Morgan, McCutcheon and Purchas1988; Oddy et al., Reference Oddy, Speck, Warren and Wynn1995). During starvation, this may result in an elevated supply of gluconeogenic amino acids being available to maintain euglycaemia (Heitmann and Bergman, Reference Heitmann and Bergman1980), thus reducing the reliance on fat mobilisation and ketogenesis in high growth animals.
In Terminal sired lambs, there was no association between plasma glucose or NEFA and PWT, but increasing PWT was associated with an increase in plasma BHOB concentrations. It is unclear why this effect was observed, given that there was not a similar association observed between NEFA and PWT. However, this effect was small and driven by a high PWT sire, which when its progeny were removed from the data set it resulted in the association being no longer significant. Therefore greater numbers of progeny of high growth sires with a larger range in ASBVs for PWT would be required to more thoroughly explain this association.
Contrary to the hypothesis, there was no association between greater muscling (high PEMD) and the metabolic response to feed deprivation. This may indicate that there is no impact of muscling on the metabolic response to feed deprivation. Alternatively, in the current study, correlations between PFAT, PWT and PEMD may have prevented associations to be observed, by co-explaining the associated metabolic effects, particularly in a small data set. The results from this study indicate the PFAT is a driver of the metabolic response to feed deprivation in Terminal sired lambs. Alternatively, in Merino sired lambs, PWT appears to be a stronger driver of glucose and fat metabolism.
Conclusion
Significant differences in fat and energy metabolism exist between Merino and Terminal sired lambs during 48 h of feed deprivation at rest. These differences appear to be partly underpinned by physiological differences due to sire type and genetic selection for growth and leanness. Merino sired lambs had a significantly greater glucose, NEFA and BHOB response to feed deprivation and further work is required to understand the mechanisms that underpin this sire type response. Moreover, work under commercial pre-slaughter conditions is required to determine the impact of extended time off feed on carcass yield and meat quality attributes, particularly in Merino genotypes.
Acknowledgements
The authors wish to thank Meat and Livestock Australia, the Australian Cooperative Research Centre for Sheep Industry Innovation and the Australian Meat Processors Corporation for funding this project. Technical staff at Murdoch University, the University of New England and the Katanning research stations are thanked for their invaluable assistance in carcass sampling, plasma analysis and on farm management.
Declaration of interest
The authors declare no conflicts of interest.
Ethics statement
This experiment was approved by the Murdoch University Animal Ethics Committee, Perth, Australia (Approval number: R2724/15).
Software and data repository resources
Carcass phenotypic data and sire ASBV data utilised in this experiment are stored in the Sheep CRC database.