Implications
This is the first study investigating Perilipin 5 gene in pigs. The results obtained from the association study suggest that variations in its sequence may be related to still poorly known regulative function of Perilipin 5 on Hormone-sensitive lipase gene activity. This study provides new input to the knowledge of one of the regulative pathways linking Perilipin 5 and lipases activities.
Introduction
Pig selection breeding programs focused mainly on the increase of carcass muscle deposition, causing a consistent reduction in intramuscular fat and backfat deposition and a worsening of porcine meat quality (Wood et al., Reference Wood, Enser, Fisher, Nute, Sheard, Richardson, Hughes and Whittington2008). During the last decade, the improvement of meat quality has become a main objective for the pork industry. Different studies proved that selecting simultaneously for growth rate and meat quality without reducing excessively intramuscular fat is a possible objective in pig breeding programs (extensively reviewed in Pena et al., Reference Pollak, Jaeger, Kolleritsch, Zimmermann, Zechner, Lass and Haemmerle2016). Meat quality traits have been found correlated with intramuscular and backfat fatty acid composition (Wood et al., Reference Wood, Enser, Fisher, Nute, Sheard, Richardson, Hughes and Whittington2008), suggesting that the selection for meat and carcass traits may also determine changes in pork fatty acid composition. This issue, along with the increasing interest toward healthier pig products, raised the need of a better knowledge on the key molecular regulators of body lipid storage and metabolism (Pena et al., Reference Pollak, Jaeger, Kolleritsch, Zimmermann, Zechner, Lass and Haemmerle2016).
Perilipin family (including Perilipin 1 to 5) can be considered as interesting candidate involved in the control of intracellular lipid deposition. Perilipin 5 (PLIN5) gene, and generally, the whole Perilipin family, has been investigated mainly in human and mouse, and recent studies have found that PLIN5 protein may regulate intracellular fatty acid fluxes and oxidation (Laurens et al., Reference Laurens, Bourlier, Mairal, Louche, Badin, Mouisel, Montagner, Marette, Tremblay, Weisnagel, Guillou, Langin, Joanisse and Moro2016). Different authors (Brasaemle, Reference Brasaemle2007; Laurens et al., Reference Laurens, Bourlier, Mairal, Louche, Badin, Mouisel, Montagner, Marette, Tremblay, Weisnagel, Guillou, Langin, Joanisse and Moro2016) reported that this regulatory function may be mediated by coordinating the access of lipases to lipid droplets surface. In particular, PLIN5 protein was indicated as an essential player in the interaction with the Hormone-sensitive lipase (LIPE). The LIPE gene maps on a QTL region linked to sensory quality of porcine meat (Pena et al., Reference Pena, Ros-Freixedes, Tor and Estany2013), and its protein expression was found associated with intramuscular fat content, in porcine Semimembranosus muscle (SM) (Zappaterra et al., Reference Zappaterra, Deserti, Mazza, Braglia, Zambonelli and Davoli2016). The results reported by Pena et al. (Reference Pena, Ros-Freixedes, Tor and Estany2013) and Zappaterra et al. (Reference Zappaterra, Deserti, Mazza, Braglia, Zambonelli and Davoli2016) suggest that LIPE might play an important role in pig meat and carcass traits, and the investigation of physiological and molecular patterns regulating LIPE activity can provide new knowledge to develop more suitable selection tools. However, the interaction between PLIN5 and lipases proteins is still unclear and, to our knowledge, PLIN5 gene has never been analysed yet in pigs. The research aimed at investigating PLIN5 gene in samples belonging to different pig breeds and at studying PLIN5 protein localisation in muscle tissue of Italian Large White (ILW) and Italian Duroc (IDU) pigs. In particular, the study of the gene was addressed to analyse the sequence variability and to investigate the association between single nucleotide polymorphism (SNP) of PLIN5 and carcass traits, fat deposition and backfat fatty acid composition. For this first investigation on porcine PLIN5 gene we decided to focus on the identification of sequence variability in the 3’untranslated (UTR) and downstream gene regions, which are known to be highly variable when compared with coding sequences (Tatarinova et al., Reference Tatarinova, Chekalin, Nikolsky, Bruskin, Chebotarov, McNally and Alexandrov2016). In addition, the PLIN5 protein localisation and the differences in PLIN5 gene expression levels in SM were also compared between ILW and IDU pigs, the two main pig breeds reared in Italy for heavy pig production. Furthermore, associations between PLIN5 sequence variation and LIPE transcription levels were analysed with the aim of investigating possible interactions between PLIN5 variants and LIPE gene expression.
Material and methods
Sampling
For the present study, we used samples of different pig breeds. For the main breeds, ILW and IDU, we collected 512 and 300 samples, respectively. These two breeds have been taken into account because of their importance in selection schemes addressed to obtain high quality seasoned products. Sampled animals were pure breed gilts and barrows included in the Italian sib test genetic evaluation scheme performed by the Italian national pig breeders association (Associazione Nazionale Allevatori Suini, ANAS; www.anas.it), reared in the same environmental conditions at the genetic test station, fed the same diet quasi ad libitum (60% of the pigs was able to ingest the entire supplied ration). At about 150 kg of live weight, the animals were transported to a commercial abattoir located at about 25 km from the test station in accordance with Council Rule (EC) No. 1/2005 regarding the protection of animals during transport and related operations. At the slaughterhouse, the pigs were electrically stunned and bled in a supine position in agreement with Council Regulation (EC) No. 1 099/2009 regarding the protection of animals at the time of slaughter. All slaughter procedures were monitored by the veterinary team appointed by the Italian Ministry of Health. After slaughtering, for each individual two samples of backfat and skeletal muscle tissue (obtained from SM) were collected: one aliquot of each tissue was stored at −20 °C and the leftover aliquots were frozen in liquid nitrogen and stored at −80 °C. For the immunohistochemical analysis, 10 samples of SM, five taken from ILW and five from IDU were included in Tissue-Tek® O.C.T. Compound (Sakura Finetek Europe, Zoeterwoude, The Netherlands). We furthermore investigated on PLIN5 SNP allele frequencies in samples of different pig breeds available in our lab and that we collected in previous studies. Thereby, besides analysing the ILW and IDU samples, we have also considered 260 additional samples belonging to five pig breeds: 100 Italian Landrace pigs, 100 Pietrain and 60 samples of three local pig breeds (Cinta Senese, Casertana and Calabrese, 20 samples/breed).
Phenotyping
Carcass traits
Carcass trait measures were partly provided by ANAS and partly determined by slaughterhouse operators. Carcass weight was expressed in kg (carcass weight), percentage of lean mass over the total carcass weight was measured with the Fat-O-Meat’er (FOM; Carometec, A/S, Herlev, Denmark) (lean %) and backfat thickness was measured with FOM at 8 cm off the midline of the carcass and between the third and fourth last ribs. Furthermore, on the SM, the pH was measured 1 h after slaughter (pH1) and at 24 h postmortem (pH24), and the objective colour measurements were performed using a Konica Minolta Chroma Meter CR-300 (Konica Minolta Sensing Inc., Osaka, Japan) applying the L*a*b* colour system, according to the International Commission on Illumination (CIE, 1976).
Analysis of backfat fatty acid composition in Italian Large White pigs
Italian Large White backfat tissue samples (stored at −20°C) were processed by direct transesterification, following the protocol reported by Murrieta et al. (Reference Murrieta, Hess and Rule2003) to obtain the fatty acid composition of backfat. From each sample, 50 mg of frozen backfat was used for total lipid extraction then, 0.5 mg of C19:0 methyl ester in hexane was added in each tube, as internal standard. Gas chromatography was performed on GC-2010 Plus High-end Gas Chromatograph (Shimadzu Corporation, Tokyo, Japan), using SPTM-2560 Capillary GC Column (Sigma-Aldrich, Merck, Darmstadt, Germany). Backfat fatty acid composition was expressed as the ratio between each individual fatty acid or fatty acid family and the total backfat fatty acids.
Immunohistochemical analysis to detect Perilipin 5 protein in muscle tissue
Immunofluorescence reaction
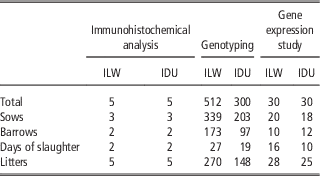
Semimembranosus muscle samples of five ILW and five IDU carcasses were randomly chosen among the 512 ILW and 300 IDU pigs and then analysed (Table 1). Immediately after collection, muscle samples were cut into 1×1 cm pieces, parallel to the muscle fibre direction, rapidly frozen in liquid nitrogen-cooled isopentane and embedded in Tissue-Tek®. Serial cross-sections (10 μm thick) were cut on a cryostat microtome at −20°C and mounted on poly-L-lysine coated glass slides (Sigma-Aldrich, St. Louis, MO, USA). Immunofluorescence was performed using the procedure described previously by Gandolfi et al. (Reference Gandolfi, Mazzoni, Zambonelli, Lalatta-Costerbosa, Tronca, Russo and Davoli2011). The sections were fixed for 10 min in 4% paraformaldehyde in phosphate buffer saline (PBS, 0.1 M, pH 7.2), rinsed in PBS and incubated in 5% normal donkey serum (NDS) for 30 min at room temperature (RT) to reduce the non-specific binding of the secondary antibodies. The sections were then incubated at 4°C in a humid chamber for 24 h in a mixture of 3% NDS and the primary antibodies rabbit anti-PLIN5 (Cat. NB110-60509; Novus Biologicals, Littleton, CO, USA) diluted 1/2 000. The next day, after washing in PBS, the sections were incubated for 1 h at RT in a PBS mixture containing 3% of NDS and the secondary antibody donkey anti-rabbit immunoglobulin G (IgG) Alexa Fluor 488-conjugated antibody (Invitrogen, Thermo Fisher Scientific Inc., Waltham, MA, USA) diluted 1/1 300. After washing in PBS, the sections were mounted with buffered glycerol, pH 8.6. The specificity of the secondary antibodies was tested by performing the staining in the absence of primary antibodies as a control. The specificity of primary antibodies was tested by Western blot.
The considered Italian Large White (ILW) and Italian Duroc (ID) samples used for the detection of Perilipin 5 (PLIN5) antigens through immunohistochemical analysis, for the genotyping of rs327694326 single nucleotide polymorphism and for the comparison between breeds of PLIN5 gene expressions

Morphometrical analysis
The sections were examined using a Zeiss Axioplan microscope (Carl Zeiss Meditec AG, Oberkochen, Germany) equipped with the appropriate filter cubes to discriminate different fluorochromes. The images were recorded with a Polaroid DMC digital camera (Polaroid, Cambridge, MA, USA) and the DMCV 2 software images were further processed using Corel Photo Paint and Corel Draw software programs (Corel, Milan, Italy). Morphometrical analyses were carried out considering for each sample the cross-sectional area (CSA, measured in μm2) of 100 myofibers with a 20× objective lens using KS 300 image analysis software (Kontron Elektronic, Munich, Germany). For each sample, the total CSA defined by PLIN5 negative myofibers was measured by outlining the profiles on the monitor screen using a computer mouse. The relative percentage of PLIN5 immunoreactive (PLIN5-IR) myofibers was calculated considering the total area of the 100 myofibers measured for each pig from which the total area of the PLIN5 negative myofibers was deducted.
Statistical analysis
Data are reported as mean and SD. Differences were tested by Wilcoxon test, using stats package on R environment version 3.3.2 (R Core Team, 2016). P⩽0.05 was considered as the threshold for significance.
Immunostaining validation
Western blot was performed to assure the specificity of the primary antibodies used for PLIN5 immunostaining. About 300 mg of SM sample stored at −80°C was homogenised on ice in 900 μl of Tissue Protein Extraction (Thermo Fisher Scientific Inc.) following the protocol reported in Zappaterra et al. (Reference Zappaterra, Deserti, Mazza, Braglia, Zambonelli and Davoli2016). About 20 to 60 μg of the total protein was separated in a 12% SDS-polyacrylamide gel and blotted into a nitrocellulose membrane (GE Healthcare/Amersham, Uppsala, Sweden). β-Actin molecular weight was used as standard to assess PLIN5 molecular weight. After blocking in 5% non-fat milk-Tris-buffered saline, membranes were incubated overnight with 1/4 000 dilutions of rabbit anti-PLIN5 and with 1/1 000 dilutions of rabbit anti-β-Actin antibody (ab8227; Abcam, Cambridge, UK). After washing, membranes were incubated for 1 h with 1/1000 dilutions of horseradish peroxidase-conjugated anti-rabbit IgG (Santa Cruz Biotechnology, Dallas, Texas, USA). The membrane blots were developed with 3,3'-diaminobenzidine (Santa Cruz Biotechnology), captured using Canon SX500 IS (Canon Inc., Tokyo, Japan), and the images were adapted and contrast-enhanced using Adobe Photoshop CS4 (Adobe Systems Incorporated, San Jose, CA, USA). PLIN5 molecular weight was assessed comparing the location on membranes of PLIN5 bands respect to β-Actin bands. The observed molecular weight was then compared using UniProt database (The UniProt Consortium, 2017) with PLIN5 weights in other species.
Perilipin 5 single nucleotide polymorphism detection and association study
Single nucleotide polymorphism detection
Porcine PLIN5 gene sequence obtained from Ensembl database (last accessed on 20 September 2017; http://www.ensembl.org/index.html) was compared with sequences in GenBank database (https://www.ncbi.nlm.nih.gov/genbank/). The PLIN5 3'UTR region and downstream gene regions of 15 ILW samples randomly chosen were sequenced using ABI PRISM 3100 Genetic Analyzer (Applied Biosystems, Thermo Fisher Scientific, Waltham, MA, USA). A primer pair was designed for the sequencing using Primer3web software version 4.0.0 (http://primer3.ut.ee/; Supplementary Table S1). PCRs were performed in a total volume of 20 μl containing 4 μl of 5× standard buffer, 1.5 mM of magnesium chloride solution (MgCl2), 0.5 μM of each primer, 160 μM of deoxynucleotide solution, 1 U of GoTaq® G2 DNA Polymerase (Promega Corporation, Madison, WI, USA) and 20 to 50 ng of template DNA. The PCR products of 15 ILW samples were then sequenced with the Big Dye Terminator kit (Applied Biosystems, Thermo Fisher Scientific Inc.) and the automatic sequencer ABI PRISM 3100 Genetic Analyzer. The obtained nucleotide sequences and those retrieved from databases were compared by multiple alignments performed with MEGA software version 6.06 (Tamura et al., Reference Tamura, Stecher, Peterson, Filipski and Kumar2013). Furthermore, the MEME suite (Bailey et al., Reference Bailey, Boden, Buske, Frith, Grant, Clementi, Ren, Li and Noble2009) was used to test if the SNP was located inside a motif represented in PLIN5 sequence as well as to predict potential effects of the SNP changing the structure of a DNA motif.
Single nucleotide polymorphism genotyping
The 512 ILW samples and 300 IDU pigs were genotyped for the SNP identified through sequencing. Furthermore, the allele frequencies were also investigated in 100 Italian Landrace, 100 Pietrain and 60 pigs belonging to the Italian autochthonous breeds of Calabrese, Cinta Senese and Casertana (20 samples per breed). Samples were genotyped using High-Resolution Melt analysis on Rotor-Gene™ 6 000 (Corbett Life Science, Concorde, NSW, Australia). Primers were designed using Primer3web software version 4.0.0 (Supplementary Table S1), and the amplification procedure was performed in 35 cycles with a denaturation step at 95°C for 20 s, the annealing step at 63°C for 15 s and the extension at 72°C for 10 s.
Statistical analysis
Allelic frequencies of the identified SNP were calculated and deviations from Hardy–Weinberg equilibrium were evaluated by a χ 2 test. The association study between the SNP and the phenotypes was performed in ILW samples using two approaches. First, Threshold Model (TM), a Bayesian statistics-based software (Legarra et al., Reference Legarra, Varona and Lόpez de Maturana2011), was applied. The used statistical models were: for backfat fatty acid composition the model included backfat thickness, animal’s age (days of life) and carcass weight as covariates, slaughter batch as random effect (27 slaughter batches), and the effects of sex (castrated males or females) and animal (using a pedigree with 1724 individuals) were taken into account. For the other phenotypic measures, the same statistical model was used including among the covariates the interaction between carcass weight and animal’s age instead of backfat thickness. For each trait, the estimated means and differences between genotypes were assessed on Rabbit program (Blasco, Reference Blasco2012) using the same models performed in TM. Then, a second statistical approach was considered to test the associations found with the Bayesian method. For each trait we chose a group of divergent ILW samples belonging to the two extreme tails and deviating from the population mean value by at least 1.5 SD units. In cases where the considered trait was not normally distributed (Shapiro–Wilk test of normality: P-value<0.05), data were transformed to achieve normal distribution using Box–Cox transformation and then the two extreme groups were identified. Genotype and allele frequencies were compared between the two extreme groups using two-tailed Fisher’s exact test and Cochran–Armitage trend test. P⩽0.05 was considered as the threshold for significance. These statistical analyses were carried out in R environment version 3.3.2 (R Core Team, 2016) using stats and car packages. The associations found with both the Bayesian approach and Cochran–Armitage trend test were analysed and further discussed.
Gene expression study
Sampling
For the comparison of PLIN5 gene expression between breeds, 30 ILW and 30 IDU were chosen avoiding as much as possible full and half sibs and to balance the two groups for sex (Table 1). Then, both PLIN5 and LIPE gene expressions were tested on 69 ILW pigs (composed of 30 TT, 20 CT and 19 CC samples for the studied SNP) and on 34 IDU (comprising 13 TT, 18 CT and 3 CC). The sample sizes were established taking into account the higher frequency of PLIN5 T allele in the studied populations.
Total RNA extraction from muscle tissue
Semimembranosus muscle samples were collected at the slaughterhouse and immediately frozen at −80°C. Total RNA was then extracted using TRIZOL reagent (Invitrogen Corporation, Carlsbad, CA, USA), the quality and integrity of the RNA were both checked and RNA was retrotranscribed to complementary DNA as described in Davoli et al. (Reference Davoli, Braglia, Russo, Varona and te Pas2011). Primers were designed using Primer3web software version 4.0.0 (Supplementary Table S1). Gene expression was analysed by quantitative Real-Time PCR using the standard curve method. Quantitative Real-Time PCR was performed on Rotor-Gene™ 6 000 as described in Zappaterra et al. (Reference Zappaterra, Deserti, Mazza, Braglia, Zambonelli and Davoli2016), and β-2-microglobulin (B2M), tyrosine 3-monooxygenase/tryptophan 5-monooxygenase activation protein, zeta (YWHAZ) and hypoxanthine phosphoribosyltransferase1 (HPRT1) have been chosen as normalising genes. The protocols used for the amplification reactions and for the standard curves are the same described in Zappaterra et al. (Reference Zappaterra, Deserti, Mazza, Braglia, Zambonelli and Davoli2016).
Statistical analysis of gene expression data
Differences in gene expression levels were tested by two-tailed Student’s t test. Gene expressions were compared: (i) between breeds, to test PLIN5 gene expression variations; (ii) between different genotypes within each breed, in order to consider possible associations of the PLIN5 SNP with PLIN5 and LIPE expression levels. Moreover, Pearson’s correlation analysis was performed between the messenger RNA (mRNA) levels of these two genes using cor.test of stats package in R environment version 3.3.2 (R Core Team, 2016). P⩽0.05 was considered as the threshold for significance.
Results
Perilipin 5 protein localisation in Semimembranosus muscle
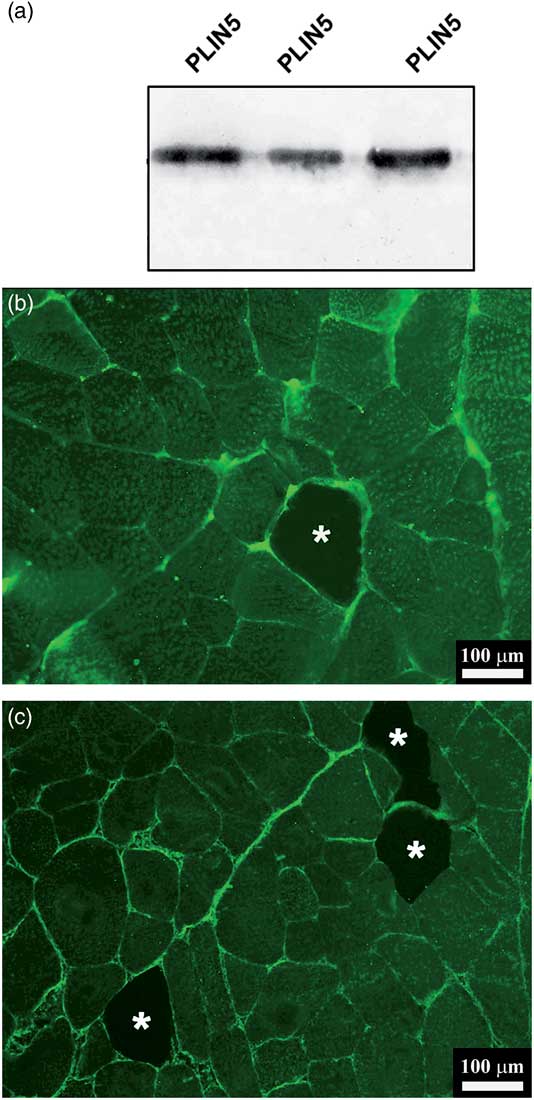
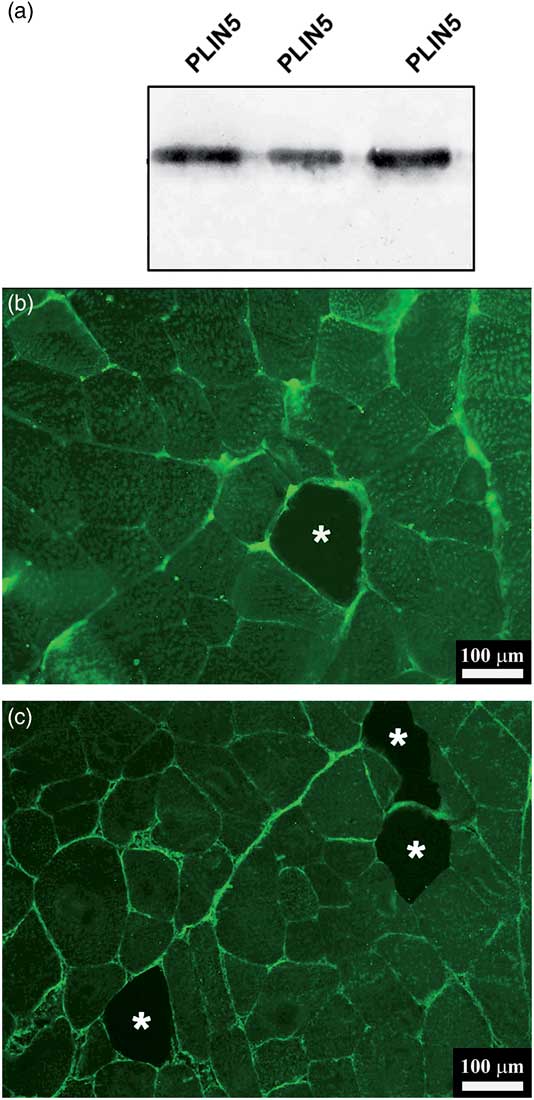
This is the first study investigating PLIN5 protein localisation in porcine SM. The specificity of the antibody was confirmed by Western blot, as a unique band was identified (Figure 1a). In the Supplementary Figure S1 is reported the full membrane with β-Actin band taken as standard to assess the molecular weight of PLIN5. In Western blot membrane, PLIN5 lied above β-Actin bands, suggesting for PLIN5 an approximate molecular weight of 50 kDa, similar to what observed in mouse (Q8BVZ1 in UniProt database) and human (Q00G26 in UniProt database). Furthermore, all porcine SM samples were positive for PLIN5 antigens. Myofibers were PLIN5-IR for the most part, presenting only isolated (Figure 1b) or grouped in pairs (Figure 1c) PLIN5 negative myofibers. PLIN5 immunoreactive myofibers showed a broad fluorescence pattern in the whole sarcoplasm, and a strong intensity staining was found localised mainly at sarcolemma and perimysial collagen levels (Figure 1b and c). The Supplementary Table S2 reports the results of the morphometrical analysis for both ILW and IDU samples. No significant difference for the morphometrical measures between the two breeds was detected: all the samples showed PLIN5 staining CSA percentages above 87%, with peaks of the 100% of immunoreactivity in some sections.
Western blot results confirming the specificity of primary antibody rabbit anti-Perilipin 5 (PLIN5) (a). Cross-sections from Semimembranosus muscle in Italian Duroc (b) and Italian Large White (c) pigs stained by PLIN5. The images show that the majority of muscle fibres are PLIN5 immunoreactive, whereas some isolated or coupled fibres appear unlabeled (*).
Single nucleotide polymorphism genotyping and allele frequencies
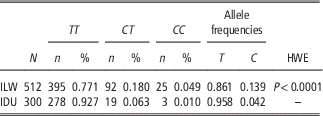
The results of the sequencing performed on ILW DNA samples for PLIN5 3'UTR and downstream region showed a unique SNP lying in PLIN5 gene downstream region. Comparing this polymorphism with those present in Ensembl database we noticed that the same SNP was already reported among the nucleotide variants associated with PLIN5 and PLIN4 genes (variant ID: rs327694326, HGVS name NC_010444.4:g.74314701 T>C). The polymorphism was not located in a genomic sequence with binding sites for microRNAs nor in a repeated motif. The SNP rs327694326 deviated from Hardy–Weinberg equilibrium in ILW samples (P<0.0001) with the C allele showing a lower frequency than the T allele in ILW samples (0.14 for the C allele against 0.86 observed for the T allele; Table 2). In IDU samples the C allele was rare, displaying an allele frequency of 0.04 (Table 2) and an expected number of CC animals that was too low and it was not possible to test the Hardy–Weinberg equilibrium in this population (expected number of CC animals<5). Due to the very low frequency of the C allele in IDU samples, the association study between SNP and phenotypes was performed only in ILW samples. The C allele was very rare in Pietrain pigs with the frequency of 0.03 (three CC individuals out of the 100 tested Pietrain), whereas Italian Landrace pigs and the three Italian native breeds showed only the T allele. Considering the limited size of the sample available for the Italian local breeds and the excessively low frequency of the C allele in Pietrain (found to be absent in the samples of the native breeds), the association study between the SNP and the phenotypic traits was carried out in ILW pigs.
Genotyping results and rs327694326 allele frequencies in Italian Large White (ILW) and Italian Duroc (ID) samples

HWE=Hardy–Weinberg equilibrium.
For Italian Duroc pigs the C allele frequency was too low to calculate the deviance from HWE.
Associations between single nucleotide polymorphism and backfat fatty acid composition and carcass traits
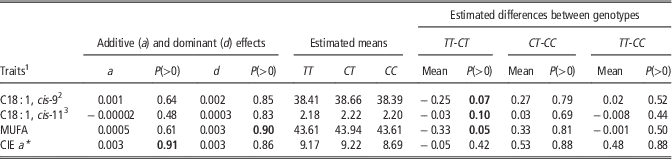
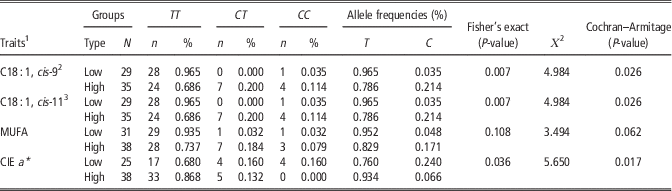
In ILW individuals, both the statistical approaches suggested that rs327694326 SNP could be associated with backfat contents of oleic, cis-vaccenic and monounsaturated fatty acids and with CIE a* colour parameter in SM. The Bayesian statistics analysis identified a dominant effect of the C allele for backfat monounsaturated fatty acids, and an overdominant effect of the heterozygote TC for both oleic and cis-vaccenic fatty acids (Table 3). The Cochran–Armitage trend test produced quite concordant and convergent results because the comparison of the SNP allele frequencies in the two divergent groups showed that the C allele was significantly more frequent in the samples with higher contents of oleic and cis-vaccenic fatty acids (P=0.026; Table 4). Moreover, rs327694326 T allele seemed to be linked to higher CIE a* colour values, passing from the frequency of 0.760 in pigs with low values for CIE a* colour parameter to 0.934 in high CIE a* individuals (Table 4). The overall results of the Bayesian analysis and the statistic trend test used to study associations between the SNP and traits are reported in the Supplementary Tables S3 to S5.
Additive and dominant effects of rs327694326 single nucleotide polymorphism on backfat contents of oleic, cis-vaccenic, monounsaturated fatty acids and CIE a* parameter measured on Semimembranosus muscle, with the means and differences of the estimated marginal posterior distribution for the genotypes in Italian Large White pigs

CIE=International Commission on Illumination; MUFA=monounsaturated fatty acids.
P(>0): posterior probability of a value being positive. In bold, probabilities above (or equal to) 0.90 or below 0.10. Oleic and cis-vaccenic levels were reported in Table 3 as the observed P(>0) were close to the considered thresholds of 0.90 and 0.10.
1 All the fatty acids or fatty acid categories are expressed as percentage on the total fatty acids amount.
2 Oleic acid.
3 Cis-vaccenic acid.
Number of samples per each extreme group, genotypic and allelic frequencies inside the two tails of extreme and divergent samples, and the results of the two-tailed Fisher’s exact test and Cochran–Armitage trend tests performed on the genotypic frequencies of rs327694326 single nucleotide polymorphism in Italian Large White pigs

CIE=International Commission on Illumination; MUFA=monounsaturated fatty acids.
1 All the fatty acids or fatty acid categories are expressed as percentage on the total fatty acids amount.
2 Oleic acid.
3 Cis-vaccenic acid.
Gene expression study
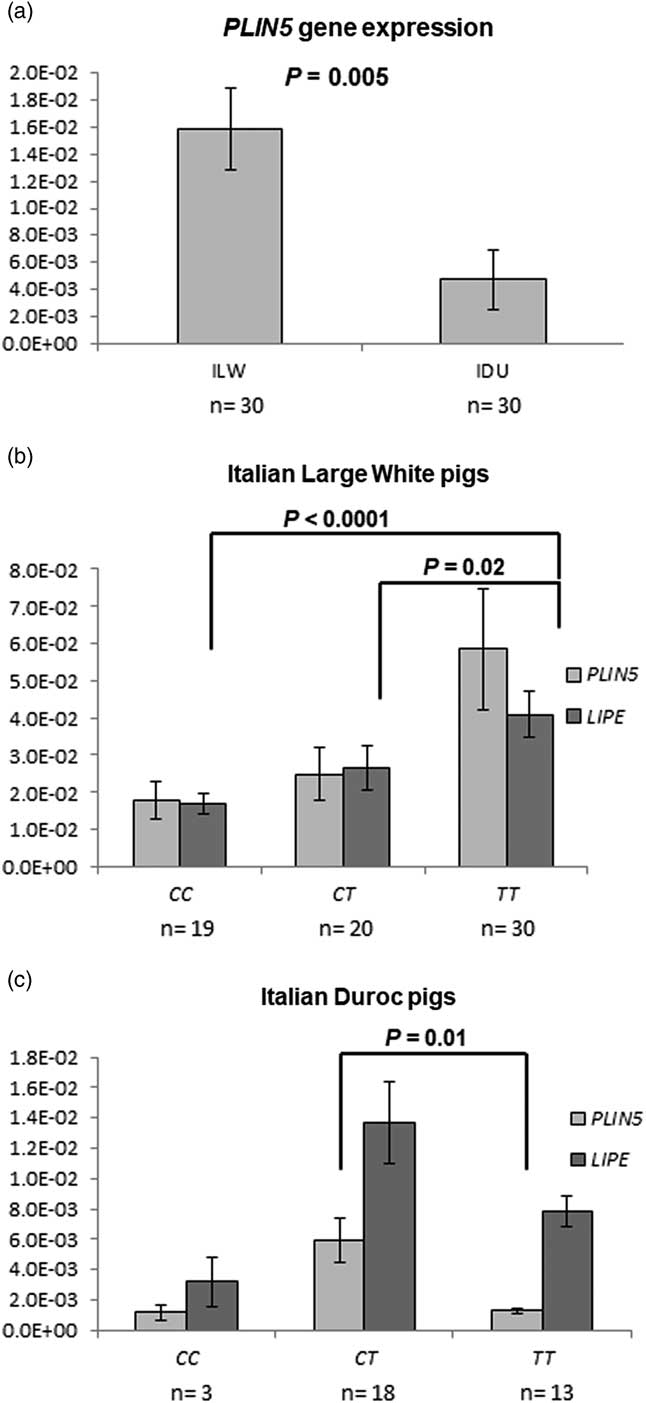
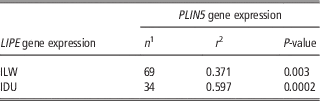
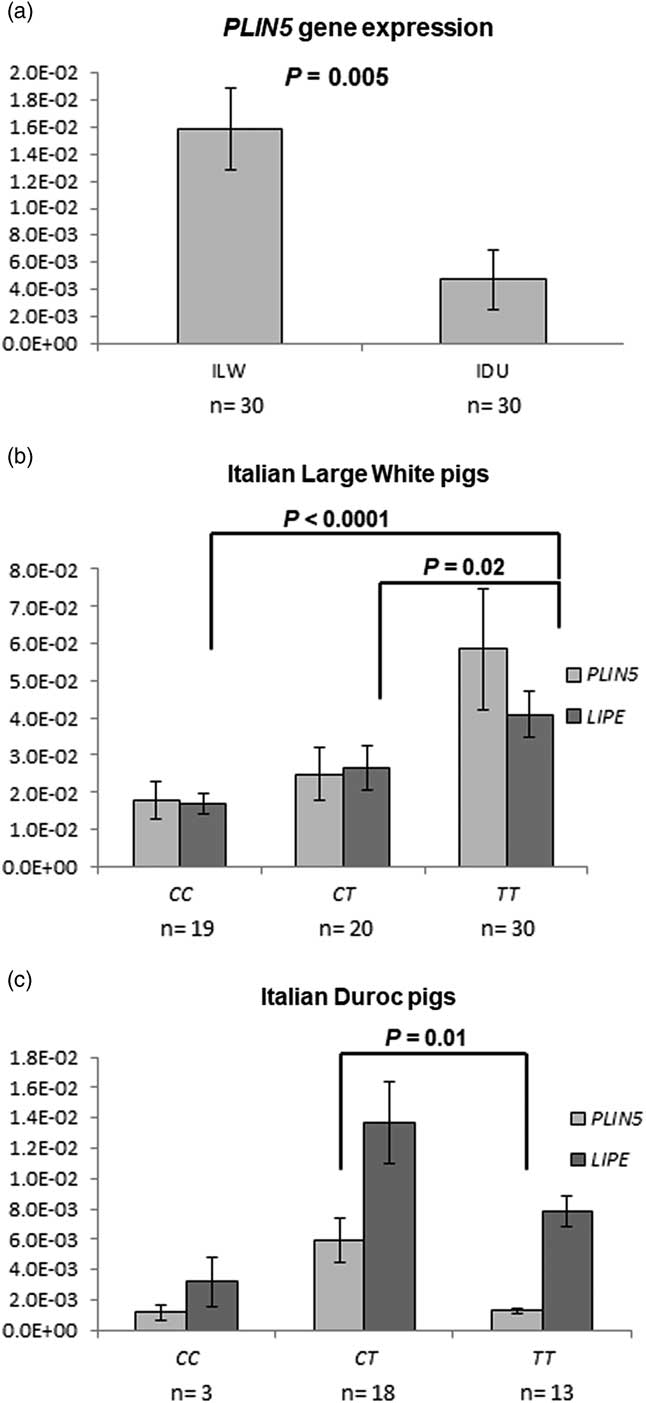
The results highlighted a higher transcription level of PLIN5 gene in ILW samples than in IDU (P=0.005; Figure 2a). Furthermore, rs327694326 was also tested to evaluate the association with PLIN5 and LIPE gene expression levels. The transcription of both genes was quantified and compared between samples with different PLIN5 genotypes. Italian Large White individuals showing TT genotype presented higher LIPE mRNA levels than CT (P=0.02) and CC pigs (P<0.0001) (Figure 2b). Italian Duroc samples presented the highest PLIN5 transcriptional levels in CT pigs (P=0.01 for CT v. TT; Figure 2c). The low frequency of C allele in IDU did not permit comparisons of the mRNA levels between the CC samples and CT or TT individuals. The results of the correlation analysis between PLIN5 and LIPE expression levels can be seen in Table 5. The two breeds presented significant correlations between PLIN5 and LIPE expressions, and in particular IDU samples showed a higher correlation compared with ILW (r=0.597 in IDU and r=0.371 in ILW pigs).
Gene expression results and Student’s t test P values of the comparisons between Perilipin 5 (PLIN5) levels in the two breeds (a) and between PLIN5 and Hormone-sensitive lipase (LIPE) expressions for the different genotypes of rs327694326 SNP in Italian Large White (ILW) (b) and Italian Duroc (IDU) pigs (c). mRNA=messenger RNA.
The Pearson’s correlation results between Perilipin 5 (PLIN5) and Hormone-sensitive lipase (LIPE) expressions in Italian Large White (ILW) and Italian Duroc (ID) samples

1 The number of the considered samples
2 Pearson’s correlation coefficient.
Discussion
The widespread expression of PLIN5 protein detected in SM myofibers of both ILW and IDU pigs is consistent with the literature, which reports a higher presence of PLIN5 in oxidative tissues, such as type I skeletal muscle fibres, cardiac muscle and liver (Dalen et al., Reference Dalen, Dahl, Holter, Arntsen, Londos, Sztalryd and Nebb2007; MacPherson et al., Reference MacPherson, Herbst, Reynolds, Vandenboom, Roy and Peters2012). Ruusunen and Puolanne (Reference Ruusunen and Puolanne2004) and Lefaucheur et al. (Reference Lefaucheur, Lebret, Ecolan, Louveau, Damon, Prunier, Billon, Sellier and Gilbert2011) observed that, unless it is classified as white skeletal muscle, porcine SM is also composed of type IIA myofibers, characterised by a higher oxidative capacity and a red appearance if compared with glycolytic (type IIB) muscle fibres. Hence, the prevalence of PLIN5-IR myofibers detected in the present research is in accordance with the SM oxidative capacity reported by Ruusunen and Puolanne (Reference Ruusunen and Puolanne2004) and Lefaucheur et al. (Reference Lefaucheur, Lebret, Ecolan, Louveau, Damon, Prunier, Billon, Sellier and Gilbert2011). Furthermore, the broad fluorescence pattern in sarcoplasm confirms the evidences observed in other species, where PLIN5 protein localised to intracellular lipid droplets surface (Yamaguchi et al., Reference Yamaguchi, Matsushita, Motojima, Hirose and Osumi2006), to mitochondria (Bosma et al., Reference Bosma, Minnaard, Sparks, Schaart, Losen, de Baets, Duimel, Kersten, Bickel, Schrauwen and Hesselink2012), as well as a free form in cytosol (Wolins et al., Reference Wolins, Brasaemle and Bickel2006). No difference was observed between the two considered breeds in the number and area of PLIN5-IR myofibers, whereas distinct PLIN5 gene expression levels, with a higher transcription level in ILW samples, were displayed. These data need to be validated in other pig populations before any conclusive assumption can occur. Anyway, it is worth noting that the observed differences in PLIN5 expression levels between ILW and IDU and the molecular processes influencing gene expression could be related to the different genetic background and adipogenic potential of these breeds. In particular Large White pigs, compared with Duroc, show a lower capacity to store fat in muscle tissue (Jung et al., Reference Jung, Shim, Na and Choe2015).
The relation between PLIN5 and lipases was evidenced by the positive correlation value linking PLIN5 and LIPE transcription levels, identified in both breeds, particularly strong in IDU pigs. Current literature lacks studies describing the link between PLIN5 and LIPE transcription patterns in livestock species. However, the PLIN5 and LIPE co-expression found in the present research may be consistent with the observations of Wang et al. (Reference Wang, Hu, Dalen, Dorward, Marcinkiewicz, Russell, Gong, Londos, Yamaguchi, Holm, Rizzo, Brasaemle and Sztalryd2009), who noticed that PLIN5 and LIPE proteins co-expressed on lipid droplets surface in cultured cells. Furthermore, it is worth noting that both PLIN5 and LIPE genes have been reported to be up-regulated by peroxisome proliferator-activated receptor α (Deng et al., Reference Deng, Shan, Li, Shen, Lu, Cheng and Ning2006; Bindesbøll et al., Reference Bindesbøll, Berg, Arntsen, Nebb and Dalen2013), thus implying that the identified co-expression may represent the effect of a common transcriptional regulative process linking the two investigated genes. In addition, another possible explanation could be that PLIN5 expression directly affects LIPE gene activity. This last hypothesis seems to be supported by the associations found between the SNP located in the PLIN5 gene downstream region and both PLIN5 and LIPE gene expression levels. Anyway, as the SNP is not located in a binding site for microRNAs nor in a repeated motif, we believe that the polymorphism could be in linkage disequilibrium with other causal mutations affecting PLIN5 gene expression, and consequently also LIPE gene expression. Although the positive co-expression between PLIN5 and LIPE identified in the present work seems to contradict the generally-accepted view that PLIN5 limits lipolysis (MacPherson and Peters, Reference MacPherson and Peters2015; Wang et al., Reference Wang, Zhao, Gao, Li, Yuan, Liu, Zhang, Wu, Hu, Zhang, Gu, Xu, Wang, Li, Zhang and Ye2015), it is worth noting that the information about the specific function of PLIN5 on fat metabolism is still contradictory. In fact, whereas some studies identified this protein as a player limiting lipid droplets hydrolysis (Laurens et al., Reference Laurens, Bourlier, Mairal, Louche, Badin, Mouisel, Montagner, Marette, Tremblay, Weisnagel, Guillou, Langin, Joanisse and Moro2016), others reported that its overexpression increases fat oxidation (Bosma et al., Reference Bosma, Minnaard, Sparks, Schaart, Losen, de Baets, Duimel, Kersten, Bickel, Schrauwen and Hesselink2012). The controversy around the role played by PLIN5 in skeletal muscle could be explained considering the complexity of biological actions and the number of factors involved in lipases activities. Bosma et al. (Reference Bosma, Minnaard, Sparks, Schaart, Losen, de Baets, Duimel, Kersten, Bickel, Schrauwen and Hesselink2012) and Pollak et al. (Reference Pena, Gallardo, Guardia, Reixach, Arnau, Amills and Quintanilla2015) reported that both the phosphorylation of PLIN5 protein in particular sites (i.e. the PAT-1 domain) and the phosphorylation of LIPE, are among the regulative mechanisms hypothesised in lipase activity control. The results observed for the SNP rs327694326 seemed to suggest that the interaction of PLIN5 with lipases could also be regulated at the gene level. Anyway, due to the location of this variant in the downstream region of PLIN5, we suppose that the SNP, rather than a direct causative variant, could be an indirect marker in linkage disequilibrium with the functional mutation involved in changes in LIPE expression. Furthermore, the SNP rs327694326 seemed also to be associated in ILW samples with oleic and cis-vaccenic backfat contents and with CIE a * value in SM. Oleic acid is the most abundant monounsaturated fatty acid in pork and its amounts have been linked to consumers’ acceptability of high quality cured products (Pena et al., Reference Pollak, Jaeger, Kolleritsch, Zimmermann, Zechner, Lass and Haemmerle2016). Thus, the identification of genetic markers associated with this trait may represent a valuable contribution in improving meat and seasoned product quality. In the tested ILW samples, the CT heterozygotes for rs327694326 showed an overdominant effect, with higher estimated means for the traits compared with both the homozygotes. Underdominant and overdominant effects were also observed by Gol et al. (Reference Gol, Ros-Freixedes, Zambonelli, Tor, Pena, Braglia, Zappaterra, Estany and Davoli2016) for SNPs in the sequence of two other Perilipin family members, suggesting that there may be epistatic effects linking this gene family.
The complete understanding of the effects associated to rs327694326 remains to be elucidated and further studies are needed to deepen the role of PLIN5 on fat traits in pig. On the whole, the results suggest that this gene could have a potential role in pig fat traits mainly concerning the backfat content of oleic fatty acid. Further investigations may offer new opportunities to understand the underlying genetic factors affecting porcine fat deposition and composition.
Acknowledgements
The authors thank Dr Maurizio Gallo from Associazione Nazionale Allevatori Suini (ANAS) and Dr Luca Buttazzoni from Consiglio per la Ricerca in agricoltura e l’analisi dell’economia agraria, Centro di ricerca per la produzione della carni e il miglioramento genetico (CREA-PCM) for providing the samples and the information about the studied individuals. This work was supported by AGER – Hepiget project (grant no. 2011-0279) and by PRIN 2015 funds.
Supplementary material
To view supplementary material/s referred to in this article, please visit https://doi.org/10.1017/10.1017/S1751731117002804