Montmorillonite-based minerals are widely used in various applications, ranging from hydrogeology, civil engineering, petroleum engineering, chemistry, environmental sciences and health (Velde, Reference Velde1992; Bergaya & Lagaly, Reference Bergaya and Lagaly2013), and hence they have been the subject of numerous studies. Montmorillonite’s layered structure consists of an octahedral sheet sandwiched between two tetrahedral sheets, known as the ‘TOT’ layer. The tetrahedral sites predominantly contain Si(IV) with some Al(III) substitutions, while the octahedral sites are primarily occupied by Al(III) with partial substitutions of Fe(III) and Mg(II). These isomorphous substitutions result in a negative charge on the TOT layers, which is balanced by exchangeable cations located in the interlayer space, such as K, Na, Ca and Mg in geological deposits (Wu et al., Reference Wu, Liao, Lv, Qin and Li2014). The presence of these interlayer cations (IC) makes montmorillonites effective adsorbents of water and various polar organic molecules (Tomic et al., Reference Tomic, Asanin, Antic-Mladenovic, Poharc-Logar and Makreski2012; Lepoitevin et al., Reference Lepoitevin, Jaber, Guégan, Janot, Dejardin, Henn and Balme2014; Wu et al., Reference Wu, Liao and Lv2015). Similarly, due to its ability to retain cations and to reduce radionuclide migration (Higgo, Reference Higgo1987; Bors et al., Reference Bors, Dultz and Riebe2000; Abdel-Karim et al., Reference Abdel-Karim, Zaki, Elwan, El-Naggar and Gouda2016), montmorillonite is considered to be a usable material for radioactive and industrial waste containment. Understanding its mechanisms of hydration is therefore crucial. As a result, montmorillonite has been the subject of numerous theoretical and experimental research studies over the last decades (Mooney et al., Reference Mooney, Keenan and Wood1952; Norrish, Reference Norrish1954; Berend et al., Reference Berend, Cases, François, Uriot, Michot, Masion and Thomas1995; Chang et al., Reference Chang, Skipper and Sposito1995; Cancela et al., Reference Cancela, Huertas, Taboada, Rasero and Laguna1997; Ferrage et al., Reference Ferrage, Lanson, Sakharov and Drits2005; Rotenberg et al., Reference Rotenberg, Cadéne, Dufrêche, Durand-Vidal, Badot and Turq2005; Vieillard et al., Reference Vieillard, Blanc, Fialips, Gailhanou and Gaboreau2011; Kharroubi et al., Reference Kharroubi, Balme, Haouzi, Belarbi, Sekou and Henn2012; Sun et al., Reference Sun, Tanskanen, Hirvi, Kasa, Schatz and Pakkanen2015; Tajeddine et al., Reference Tajeddine, Gailhanou, Blanc, Lassin, Gaboreau and Vieillard2015; Michot et al., Reference Michot, Ferrage, Delville and Jiménez-Ruiz2016; Peng et al., Reference Peng, Min, Liu and Chen2016; Zhang et al., Reference Zhang, Yi, Zhao, Min and Song2016; Shen et al., Reference Shen, Li, Zhou, Zhou, Chen and Zhu2018). Several experimental as well as theoretical works, including using adsorption isotherms, thermogravimetric analysis, thermoporometry and X-ray diffraction (XRD), have been carried out to investigate the hydration mechanism of alkali, alkaline-earth or transition metal-exchanged montmorillonites (Cases et al., Reference Cases, Bérend, Francois, Uriot, Michot and Thomas1997; Cancela et al., Reference Cancela, Huertas, Taboada, Rasero and Laguna1997; Salles et al., Reference Salles, Douillard, Denoyel, Bildstein, Jullien, Beurroies and Van2009, Reference Salles, Bildstein, Douillard, Jullien, Raynal and Van Damme2010, Reference Salles, Douillard, Bildstein, El Ghazi, Prelot, Zajac and Van Damme2015). These studies generally agree that the hydration properties of montmorillonite, both structural and thermodynamic, are highly dependent on the nature and concentration of the IC.
The initial stage of hydration is often attributed to water molecule adsorption on the external grain surface (Ng & Mintova, Reference Ng and Mintova2008). Subsequently, IC solvation occurs, leading to an increased interlayer distance (structural swelling) and greater diffusion of the adsorbed water and IC (Salles et al., Reference Salles, Douillard, Denoyel, Bildstein, Jullien, Beurroies and Van2009, Reference Salles, Douillard, Bildstein, El Ghazi, Prelot, Zajac and Van Damme2015). Swelling is significant in most montmorillonites, except in K+-, Rb+- and Cs+-exchanged samples. Thermodynamic analyses have quantified these hydration parameters, highlighting the role of IC properties such as charge and size, solvation energy and ion mobility (Cancela et al., Reference Cancela, Huertas, Taboada, Rasero and Laguna1997; Vieillard et al., Reference Vieillard, Blanc, Fialips, Gailhanou and Gaboreau2011). The results of such studies demonstrated that the hydration thermodynamic parameters such as  $\Delta H{^\circ _{hyd}}$ and
 $\Delta S{^\circ _{hyd}}$ are greater for alkaline-earth than for alkaline cations, and that the water loading
 $n\left( {{H_2}O} \right)$ follows the order Ca2+ > Mg2+ > Sr2+ > Ba2+ > Na+ > Cs+ > Rb+ > K+ (Vieillard et al., Reference Vieillard, Blanc, Fialips, Gailhanou and Gaboreau2011). In addition, the results usually reveal that the total water loading and adsorption heat increase with the increasing ionic potential
 ${\raise0.7ex\hbox{${{q_{IC}}}$} \!\mathord{\left/
{\vphantom {{{q_{IC}}} {{R_{IC}}}}}\right.}
\!\lower0.7ex\hbox{${{R_{IC}}}$}}$ of the IC (where
 ${q_{IC}}$ is the IC elementary charge and
 ${R_{IC}}$ is its radius), thus confirming that water molecule–cation coulombic interaction is probably an important parameter that governs the montmorillonite hydration. This is well illustrated in Cancela et al.’s (Reference Cancela, Huertas, Taboada, Rasero and Laguna1997) work on Li+, Na+, Mg2+, Ca2+, Cu2+ and Fe3+ montmorillonites, in which adsorption heat was shown to follow the order: Na+ < Li+ < Ca2+ < Cu2+ < Mg2+ < Fe3+, notwithstanding the fact that these cations all possess a high ionic potential. In addition to these experimental investigations, the hydration and swelling mechanisms of montmorillonite have been studied using numerical atomic simulations such as Monte Carlo, molecular dynamics (Chang et al., Reference Chang, Skipper and Sposito1995; Hensen et al., Reference Hensen, Tambach, Bliek and Smit2001; Zhang et al., Reference Zhang, Yi, Zhao, Min and Song2016; Peng et al., Reference Peng, Yi, Song, Zhan and Zhao2019) or density functional theory (Peng et al., Reference Peng, Min, Liu and Chen2016; Li et al., Reference Li, Chai, Yang, Xin, Sun and Yan2023) and analytical modelling (Rotenberg et al., Reference Rotenberg, Cadéne, Dufrêche, Durand-Vidal, Badot and Turq2005; Salles et al., Reference Salles, Douillard, Denoyel, Bildstein, Jullien, Beurroies and Van2009; Vieillard et al., Reference Vieillard, Blanc, Fialips, Gailhanou and Gaboreau2011). The adsorption energies of the water within the interlayer space, encompassing both IC solvation and silicate surface hydration, have been described. Except for the Cs+ sample (Salles et al., Reference Salles, Douillard, Denoyel, Bildstein, Jullien, Beurroies and Van2009), the data show that the hydration of ICs is significantly higher than that of the silicate surface. This highlights the dominant role of ICs in driving montmorillonite hydration and swelling. Nevertheless, certain specific aspects still require clarification. Notably, further research is required to clarify the potential links between IC solvation, the swelling behaviour of the montmorillonite and the molecular mechanisms governing adsorption, desorption and their reversibility. This is particularly relevant when comparing samples exchanged with alkali and alkaline-earth ICs, as certain cations, such as K+, Rb+, Cs+, and Ba2+, may not fully align with the characteristics typically associated with high-ionic-potential cations.
Within this framework, we have already investigated and reported on the impacts of three alkaline-earth ICs on the water sorption properties of a reference montmorillonite (SWy-2) using structural analysis, water uptake isotherms and mid-infrared (Mid-IR) spectroscopy (Belhocine et al., Reference Belhocine, Haouzi, Bassou, Phou, Maurin, Bantignies and Henn2018). The sorption isotherms showed that, for a given partial pressure, the total amount of adsorbed water molecules per IC as well as the isosteric heat at low loading follow the order Ca2+ > Mg2+ > Ba2+. The Mid-IR spectra revealed that the amount of adsorbed water molecules follows the same sequence and showed the coexistence of ‘liquid-like’ and ‘solid-like’ water confined within the interlayer space. In addition, it was concluded that the sorption isosteric heat as a function of the water loading does not simply follow the structural evolution observed from XRD and the ionic potential of the alkaline-earth IC. To extend further this initial work, the present article investigates the same montmorillonite exchanged with the entire series of alkali cations (i.e. Li+, Na+, K+, Rb+ and Cs+), thereby enabling a more comprehensive understanding of the impact of ICs on water adsorption, notably the interplay between the two key driving forces that are the IC solvation and the TOT attraction. Adsorption and desorption isotherms were measured at three different temperatures (25°C, 40°C and 60°C) in the [0–0.6] partial water pressure range, and they were analysed to determine the net isosteric heat of adsorption/desorption using the Clausius–Clapeyron equation. Mid-IR spectra were recorded at room temperature and under a primary vacuum, and they were analysed with a focus on the water O–H bond signature. The data are discussed in relation to the evolution of basal spacing (i.e. d(001)) obtained from XRD at various relative humidity levels, as reported previously by others (Berend et al., Reference Berend, Cases, François, Uriot, Michot, Masion and Thomas1995, Ferrage et al., Reference Ferrage, Lanson, Sakharov and Drits2005). Structural, thermodynamic and IR findings are thus compared in the light of the various IC features. To the best of our knowledge, this study uniquely compares comprehensive experimental data obtained on a given montmorillonite sample exchanged with such a wide range of ICs. Notably, it also provides the first report on the step-by-step sorption of water at three temperatures, thus enabling analysis of the progressive evolution of the sorption isosteric heat. These findings may therefore offer further experimental insights into the complex process of water sorption in this SWy-2 montmorillonite.
Materials and methods
Homoionic montmorillonite preparation and characterization
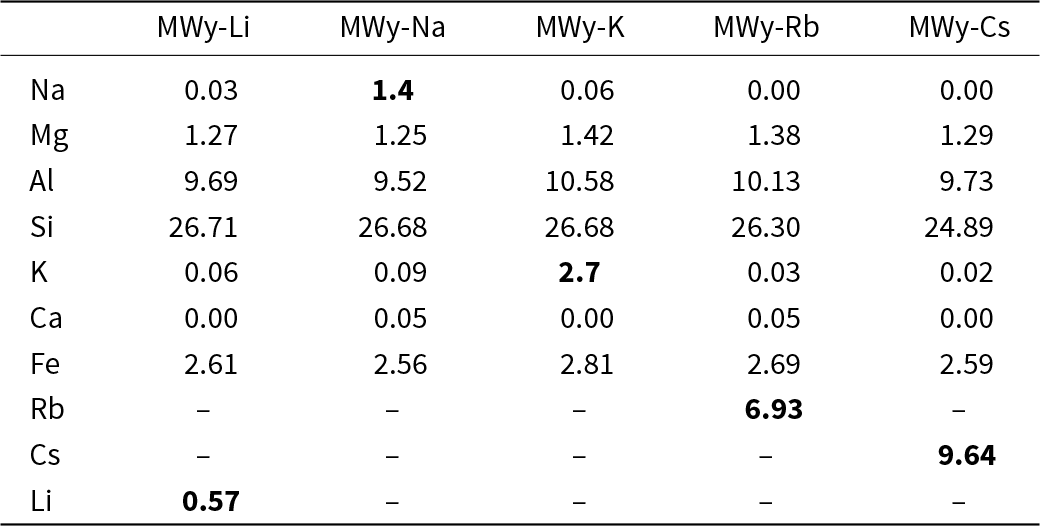
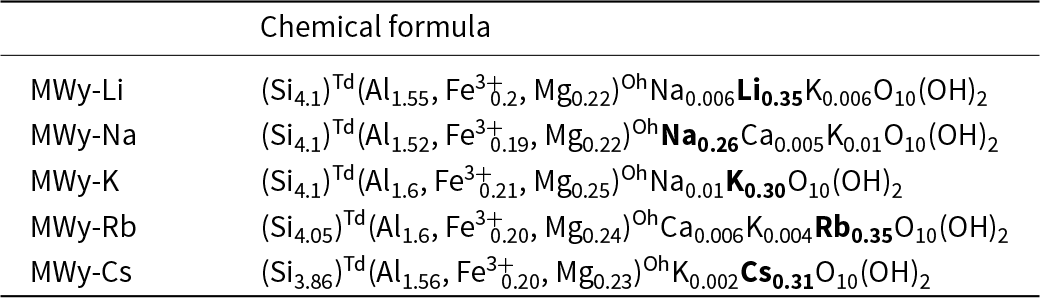
The homoionic alkali montmorillonites used in this study were prepared following the same procedure as described previously for the alkaline-earth samples (Belhocine et al., Reference Belhocine, Haouzi, Bassou, Phou, Maurin, Bantignies and Henn2018). Briefly, the SWy-2 montmorillonite obtained from the Clay Minerals Society was dispersed in pure water, sedimented and centrifuged to isolate the ≤2 μm fraction. Then, 10 g of this fraction was repeatedly dispersed and stirred in 1 L of 1 M MCl (M = Li+, Na+, K+, Rb+ or Cs+) aqueous solution to exchange the native IC with the desired alkali cation. This procedure was repeated three times. Then, the fraction was separated from its solution by centrifugation and washed with pure water until no trace of chloride ions was detected by testing with AgNO3. Finally, the homoionic montmorillonite was dried at 80°C in air for 24 h. The elemental chemical analysis validates the successful cation-exchange process and confirms the homoionic nature of all exchanged samples (Table 1). Then, using the Mauguin method (Mauguin, Reference Mauguin1928), these results allowed us to determine the chemical formula (half crystallographic cell; Table 2).
Elemental chemical composition in wt.% of the homoionic alkali metal-exchanged montmorillonites studied in this work. The data in bold are the wt.% values of the X element of the MWy-X-exchanged sample.

Chemical formulae of the half-unit cell of the homoionic alkali metal-exchanged montmorillonites studied in this work calculated from the elemental chemical compositions reported in Table 1 and from Mauguin’s method. The X element in bold corresponds to the MWy-X-exchanged sample.

X-ray diffraction
XRD traces of the dehydrated samples were obtained using an INEL CPS120 wide-angle X-ray diffractometer equipped with a conventional X-ray source (Cu-Kα) and a 120° curved detector. The samples were prepared and dehydrated according to a previously reported method (Belhocine et al., Reference Belhocine, Haouzi, Bassou, Phou, Maurin, Bantignies and Henn2018). Specifically, the capillary tube containing the sample was heated at 200°C for 2 h in a Mettler FP52 furnace and then sealed to prevent atmospheric water contamination. The interlayer space d(001) for each sample was calculated from the position of the diffraction peak.
Isothermal water uptake
Water sorption isotherms were measured using an IGAsorp instrument from Hiden Isochema, Ltd. This instrument directly measures the sample mass using a quartz balance at a given relative water pressure  ${\raise0.7ex\hbox{$P$} \!\mathord{\left/
{\vphantom {P {{P^{sat}}}}}\right.}
\!\lower0.7ex\hbox{${{P^{sat}}}$}}$where P is the applied water pressure and
 ${P^{sat}}$ is the saturated water pressure at the measurement temperature. The measurements procedure is as follows:
(1) Approximately 15 mg of the sample was placed in the IGAsorp instrument and dehydrated at a temperature of 200°C for 3 h under dry nitrogen gas flow. This dehydration step was necessary to remove any pre-adsorbed water from the sample before measuring the mass variation at different relative water pressures. The total weight change observed during the experiment were in the order of 1 mg.
(2)
 ${\raise0.7ex\hbox{$P$} \!\mathord{\left/
{\vphantom {P {{P^{sat}}}}}\right.}
\!\lower0.7ex\hbox{${{P^{sat}}}$}}$ was adjusted by mixing a dry nitrogen gas flow with a nitrogen gas flow saturated with water vapour. The total gas flow rate was maintained at 250 mL min–1. The sample mass was continuously monitored throughout the experiment.
(3) Adsorption and desorption isotherms were recorded at three different temperatures: 25°C, 40°C and 60°C. For each
${\raise0.7ex\hbox{$P$} \!\mathord{\left/
{\vphantom {P {{P^{sat}}}}}\right.}
\!\lower0.7ex\hbox{${{P^{sat}}}$}}$, the mass change of the sample was measured after 6 h of adsorption or desorption. If equilibrium was not reached within this time (i.e. the sample mass continued to increase or decrease), the equilibrium water uptake or loss was estimated by extrapolating the mass change curve to infinite time. Using the initial dry mass of the montmorillonite and its elemental chemical composition, the mass change was converted into the number of water molecules per IC, denoted as
${\text{ }}n\left( {{H_2}O} \right)$.


Isosteric heat
The isosteric heat of adsorption and desorption can be calculated from the isotherms obtained at the different temperatures according to the Clausius–Clapeyron equation (see Equation 1):
 \begin{equation}\frac{{{\text{d}}\left[ {\ln ({\raise0.7ex\hbox{$P$} \!\mathord{\left/
{\vphantom {P {{P^{sat}}}}}\right.}
\!\lower0.7ex\hbox{${{P^{sat}}}$}})} \right]}}{{{\text{d}}T}} = \frac{{{q_{{\text{st}}}}{\text{ }} - {\text{ }}{{{\Delta }}_{{\text{vap}}}}h{^\circ _{{{\text{H}}_2}{\text{O}}}}}}{{{\text{R}}{T^2}}} = \frac{{q_{{\text{st}}}^*}}{{{\text{R}}{T^2}}}\end{equation}
where  $T$ is the temperature,
 ${\text{R}}$ the perfect gas constant and
 $q_{st}^*$ is the net isosteric heat that must be provided in addition to the molar heat of vaporization of pure water
 ${{{\Delta }}_{{\text{vap}}}}h{^\circ _{{{\text{H}}_2}{\text{O}}}}$ taken to be equal to 40.5 kJ mol–1. The values of
 ${\text{ }}q_{{\text{st}}}^*$ upon adsorption and desorption, respectively
 ${\text{ }}q_{{\text{st}},{\text{ads}}}^{\text{*}}{\text{ }}$and
 ${\text{ }}q_{{\text{st}},{\text{ des}}}^{\text{*}}$, are thus determined from the slope of the
 $\frac{{{\text{d}}\left[ {\ln ({\raise0.7ex\hbox{$P$} \!\mathord{\left/
{\vphantom {P {{P^{sat}}}}}\right.}
\!\lower0.7ex\hbox{${{P^{sat}}}$}})} \right]}}{{{\text{d}}T}}$ as a function of
 $\frac{1}{T}$ for various given values of
 ${\text{ }}n\left( {{H_2}O} \right)$.
Fourier-transform infrared spectroscopy
Mid-IR experiments (400–4000 cm–1) were conducted using a Fourier-transform infrared spectrometer (Bruker IFS66V) equipped with a black body source, a KBr beam splitter and a pyroelectric deuterated l-alanine-doped triglycine sulfate (DLaTGS) detector. The spectral resolution was 2 cm–1, and 128 scans were averaged for each spectrum. Measurements were performed using an attenuated total reflectance (ATR) accessory with a mono-reflexion diamond crystal. The samples were deposited on the ATR crystal and subjected to moderate pressure to ensure optimal optical contact. Spectra were recorded at room temperature under a primary vacuum (2.0 × 10⁻² atm). Under these conditions, it is assumed that only the water molecules weakly adsorbed at the grain surface and not those confined within the interlayer space or strongly attached to cations located at the TOT edges were removed. The spectra were normalized based on the maximum intensity of the ν(SiOSi) band at 1048 cm–1 (see Table S1), as it is assumed to be independent of the quantity of adsorbed water.
Results and discussion
XRD traces of the dehydrated samples: the case of the alkali-exchanged montmorillonites
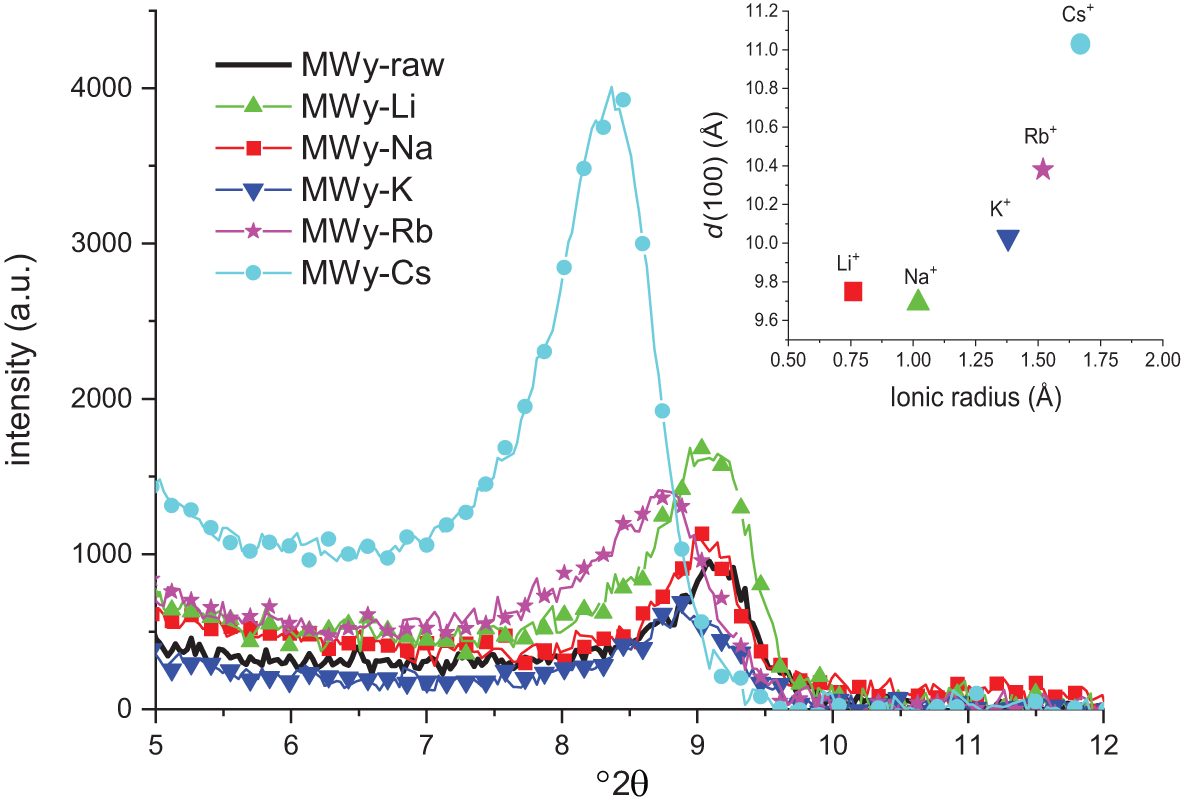
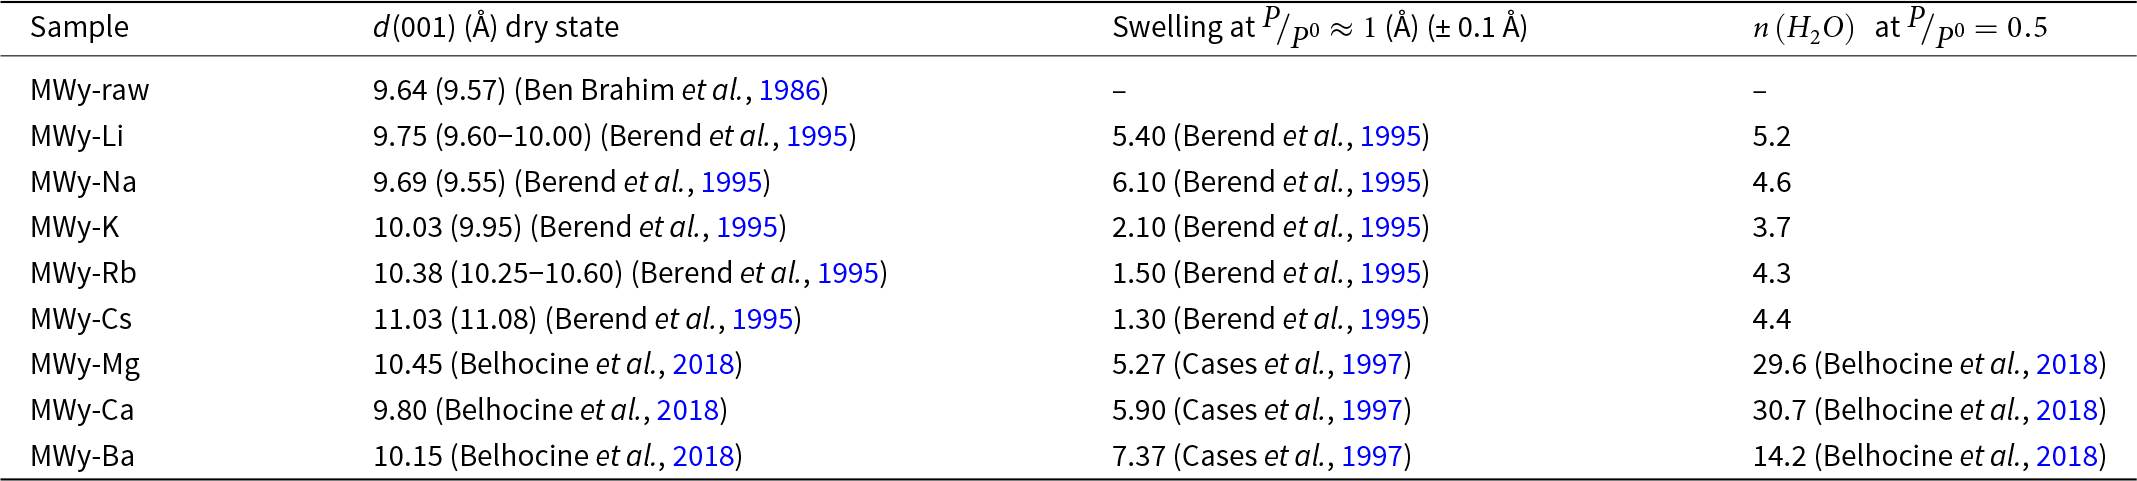
Examination of the XRD traces across the entire q-range for raw and alkali-exchanged montmorillonites confirms that cationic exchange preserves the crystallographic structure. Impurities are identified as silica in the form of quartz (Q; Fig. S1). Figure 1 focuses on the [0,0,1] peak region. The interlayer spacing d(001) calculated from peak positions using Bragg’s law (Table 3) aligns well with literature values (Ben Brahim et al., Reference Ben Brahim, Armagan, Besson and Tchoubar1986; Berend et al., Reference Berend, Cases, François, Uriot, Michot, Masion and Thomas1995; Sun et al., Reference Sun, Tanskanen, Hirvi, Kasa, Schatz and Pakkanen2015). The inset of Fig. 1 illustrates a clear dependence of d(001) on the IC radius. While d(001) increases with the IC radius, MWy-Li slightly deviates from this trend. This anomaly could be attributed to the 200°C pre-treatment, potentially enabling Li+ ions to intercalate into the TOT sheet (Bodart et al., Reference Bodart, Delmotte, Rigolet, Brendle and Gougeon2018).
XRD d 100 peak of the dehydrated montmorillonite SWy-2: raw and after exchange with alkali cations. The inset graph reports the evolution of the d(001) value calculated from the Bragg equation for each alkali-exchanged montmorillonite as a function of the alkali cation radius. The entire XRD trace is reported in Fig. S1.

Values of the reticular distance d(001) of the homoionic alkali metal-exchanged montmorillonite studied in this work dehydrated at 200°C for 2 h in air and as reported for the dehydrated state in other studies (see Berend et al., Reference Berend, Cases, François, Uriot, Michot, Masion and Thomas1995; Belhocine et al., Reference Belhocine, Haouzi, Bassou, Phou, Maurin, Bantignies and Henn2018) and of the swelling calculated from the d(001) difference between the dehydrated and hydrated at  ${\raise0.7ex\hbox{$P$} \!\mathord{\left/
{\vphantom {P {P^\circ }}}\right.}
\!\lower0.7ex\hbox{${P^{0} }$}} \approx 1$ states.

Structural evolution with the hydrated state from XRD: the case of the alkali-exchanged montmorillonites
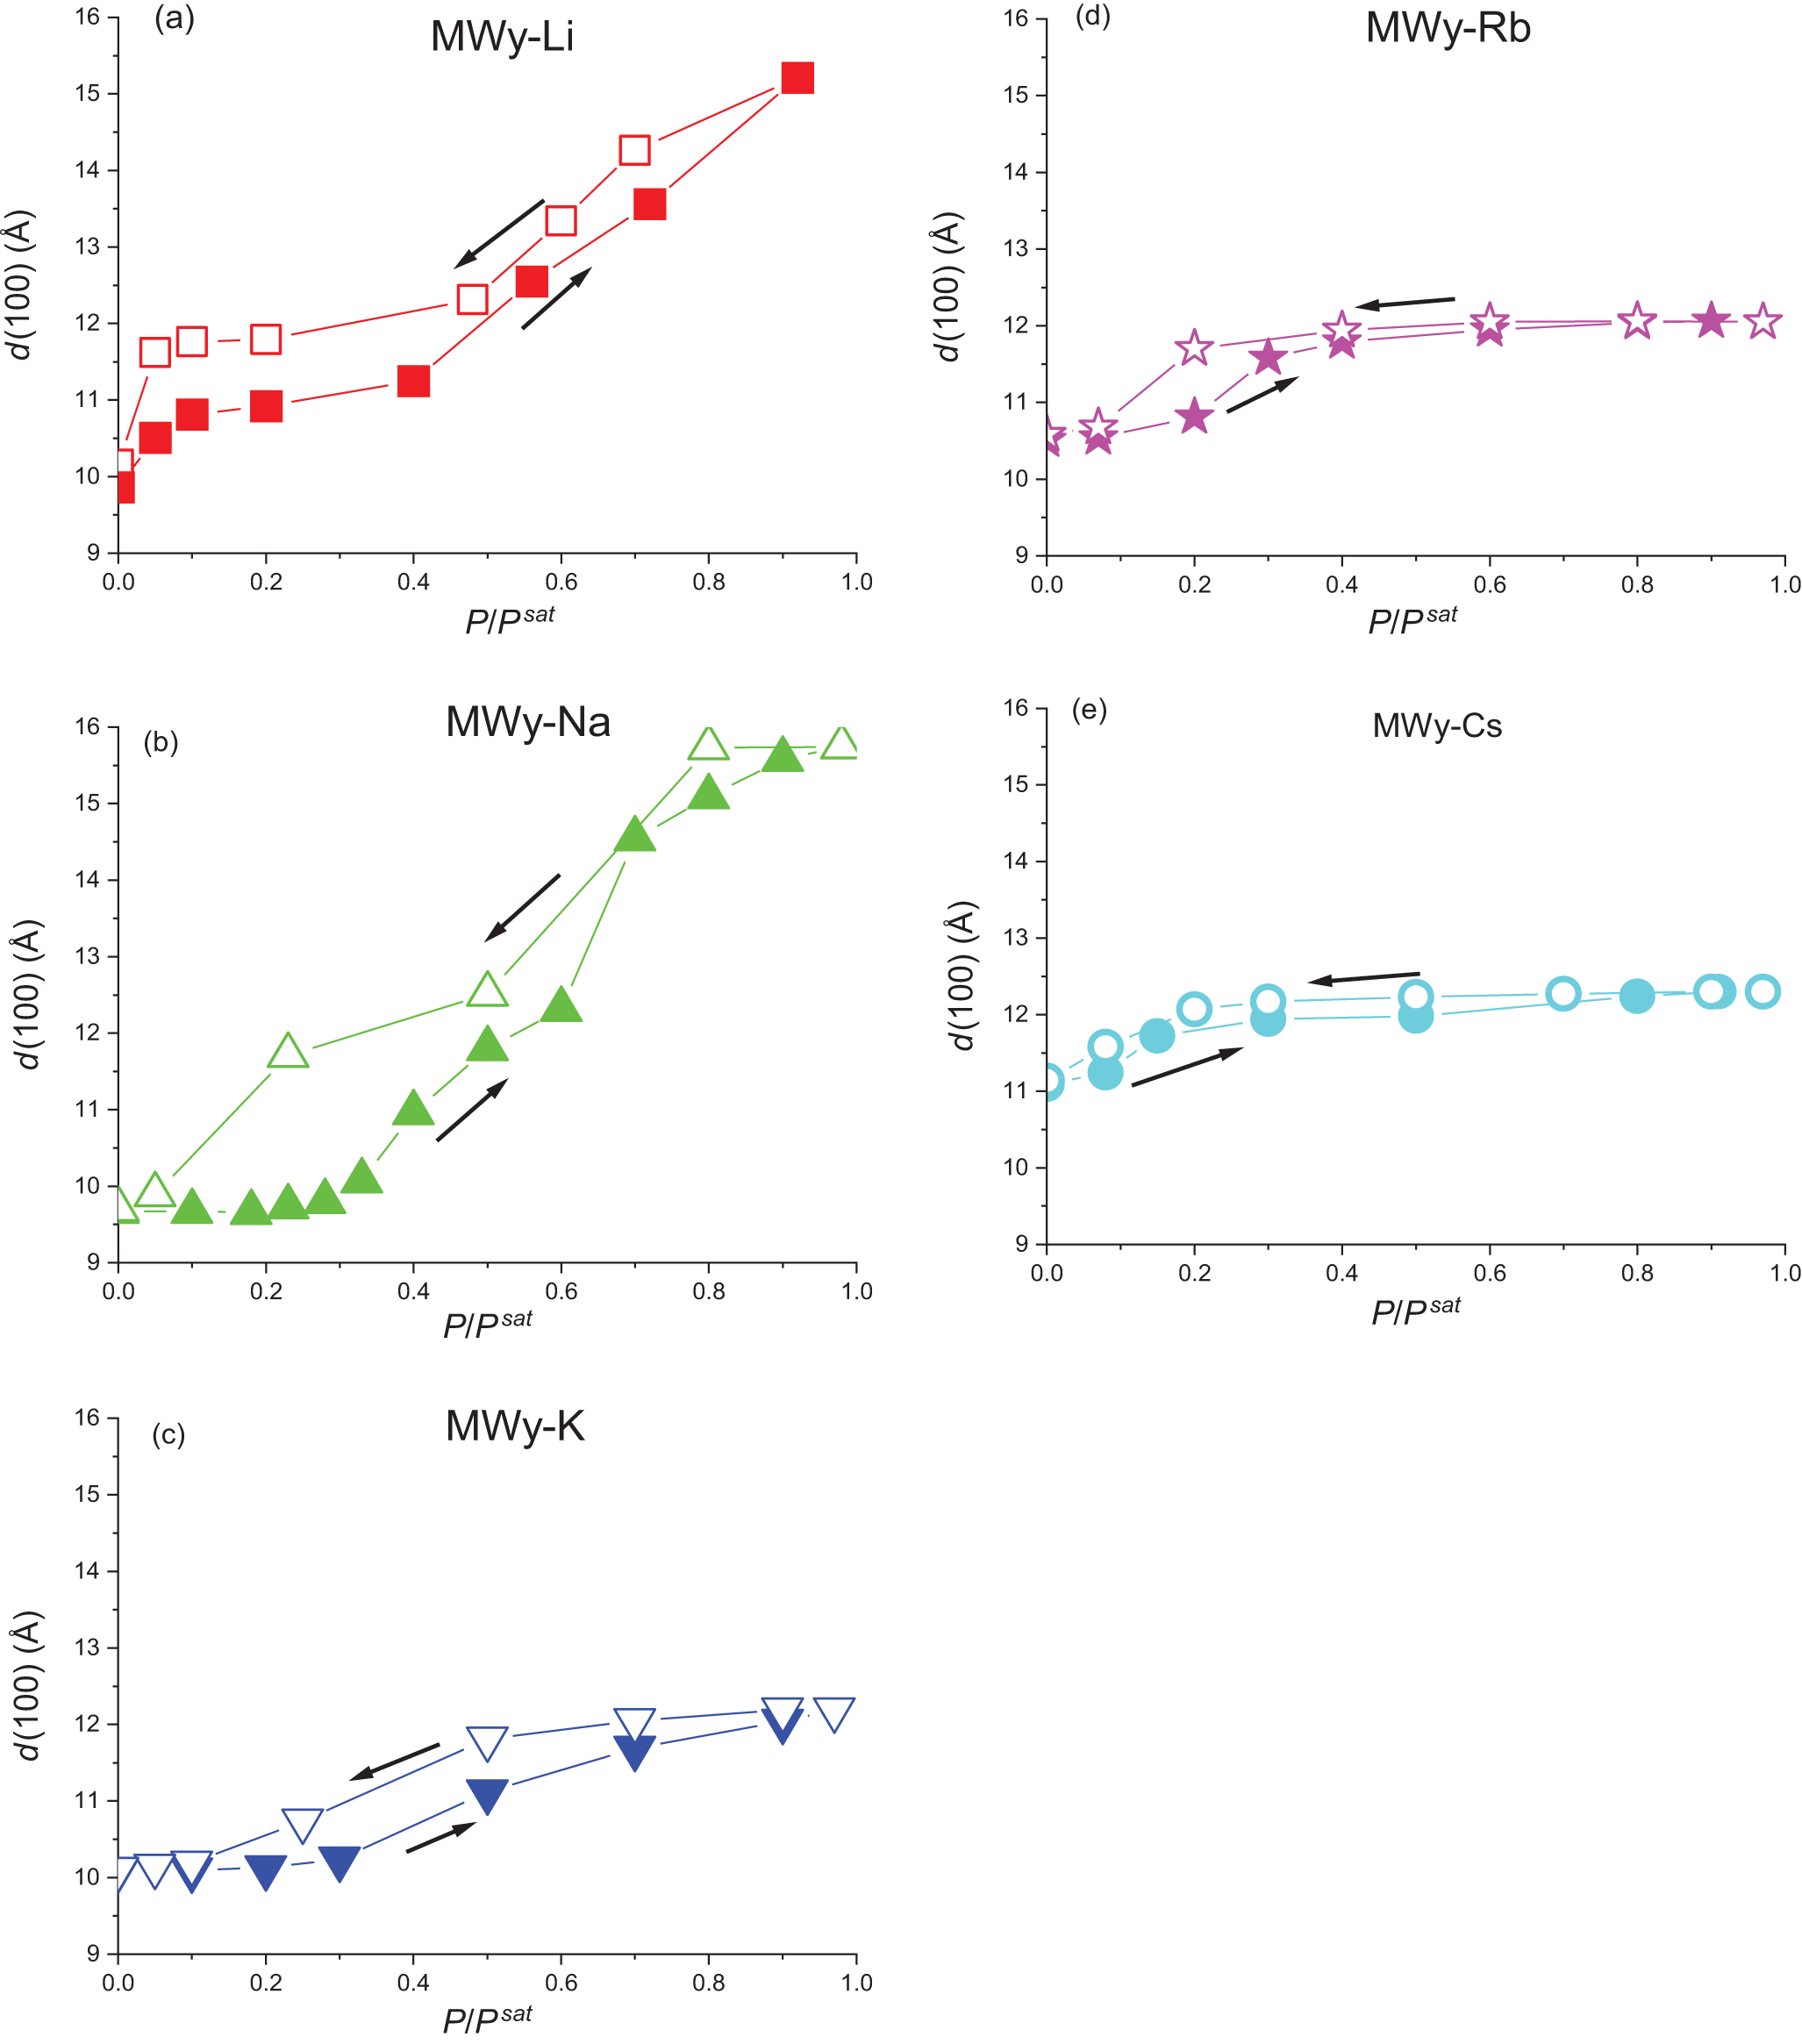
Due to the absence of in-house XRD equipment capable of operating under varying relative water pressures, this study relied on published data pertaining to the same reference montmorillonite, SWy-2, saturated with the complete series of alkali cations (Berend et al., Reference Berend, Cases, François, Uriot, Michot, Masion and Thomas1995; Ferrage et al., Reference Ferrage, Lanson, Sakharov and Drits2005). Figure 2 illustrate the variation in d(001) spacing as a function of relative humidity. The swelling values, defined here as the difference in d(001) spacing between the dehydrated and fully hydrated states, are reported in Table 3. The d(001) spacing of MWy-Li exhibits a rapid increase at very low relative water pressures and then relative stability up to a relative humidity of 0.4. Swelling then proceeds rapidly until full hydration is achieved at  ${\raise0.7ex\hbox{$P$} \!\mathord{\left/
{\vphantom {P {{P^{sat}}}}}\right.}
\!\lower0.7ex\hbox{${{P^{sat}}}$}} \approx 1$. During the desorption process, the d(001) spacing follows a similar trend, albeit plateauing at a slightly higher value compared to the initial adsorption state, before undergoing a rapid decrease as relative humidity falls below 0.1. This observation suggests that the sample does not fully revert to its original dehydrated state, probably for the reason given earlier regarding the intercalation of Li+ in the TOT layer due to the dehydration treatment at 200°C. For MWy-Na (Fig. 2b), no significant change in d(001) spacing is observed from the dry state up to a relative humidity of 0.2. Subsequently, swelling increases gradually until full hydration. Desorption follows a distinct path, demonstrating a more monotonic return to the dry state. The MWy-Na sample exhibits the most pronounced irreversible structural evolution between adsorption and desorption, which is consistent with previous findings (Ben Brahim et al., Reference Ben Brahim, Armagan, Besson and Tchoubar1986) and, as will be shown later, is related to water uptake isotherm and isosteric heat. In contrast to the preceding two cases and in agreement with the existing literature (Berend et al., Reference Berend, Cases, François, Uriot, Michot, Masion and Thomas1995), the isotherm for MWy-K (Fig. 2c) reveals a significantly attenuated swelling phenomenon. The d(001) spacing increases only from 10 to 12 Å between the dehydrated and fully hydrated states at . The hysteresis observed for MWy-K is relatively limited in comparison to the MWy-Li and MWy-Na samples. While not strictly identical, the isotherms of MWy-Rb (Fig. 2d) and MWy-Cs (Fig. 2e) display a similar trend to that observed for MWy-K (Fig. 2c). As the ionic radius of the alkali cation increases from K to Cs, swelling becomes progressively more restricted and the hysteresis less pronounced.
Variation of d(001), the interlayer distance, as a function of partial water pressure for the alkali-exchanged montmorillonites: (a) MWy-Li, (b) MWy-Na, (c) MWy-K, (d) MWy-Rb and (e) MWy-Cs. These plots are based on the data reported in Berend et al. (Reference Berend, Cases, François, Uriot, Michot, Masion and Thomas1995). Full symbols are data obtained upon adsorption and open symbols are data obtained upon desorption. Solid coloured lines are present to guide the reader.

A comparative analysis of the data with previously reported data on alkaline-earth-exchanged montmorillonites (Belhocine et al., Reference Belhocine, Haouzi, Bassou, Phou, Maurin, Bantignies and Henn2018) reveals the following key observations (Fig. 2):
(1) The shape and the irreversibility of the isothermal evolution of d(001) spacing with water loading is significantly influenced by the IC (Berend et al., Reference Berend, Cases, François, Uriot, Michot, Masion and Thomas1995). Two groups of exchanged montmorillonites can be distinguished: MWy-Li, -Cs, -Mg, -Ca and -Ba, in which swelling of the structure occurs from the initial water molecules adsorbed; and MWy -Na, -K and -Rb, in which swelling occurs only after
${\raise0.7ex\hbox{$P$} \!\mathord{\left/
{\vphantom {P {{P^{sat}}}}}\right.}
\!\lower0.7ex\hbox{${{P^{sat}}}$}} \gt 0.2$.(2) Two hydration layers are observed for all samples with the exception of MWy-K, -Rb and -Cs, for which only a monolayer is formed (Berend et al., Reference Berend, Cases, François, Uriot, Michot, Masion and Thomas1995; Salles et al., Reference Salles, Douillard, Denoyel, Bildstein, Jullien, Beurroies and Van2009).
(3) The bilayer hydration state forms at low relative water pressures exclusively for MWy-Mg and -Ca (Cases et al., Reference Cases, Bérend, Francois, Uriot, Michot and Thomas1997).

Water adsorption–desorption isotherms: the case of the alkali-exchanged montmorillonites
Due to the extremely long time required to conduct these experiments, and considering that the most interesting phenomenon related to d(001) evolution (Fig. 2) occurs at low partial water pressures, our investigation was limited to the [0–0.6]  ${\raise0.7ex\hbox{$P$} \!\mathord{\left/
{\vphantom {P {{P^{sat}}}}}\right.}
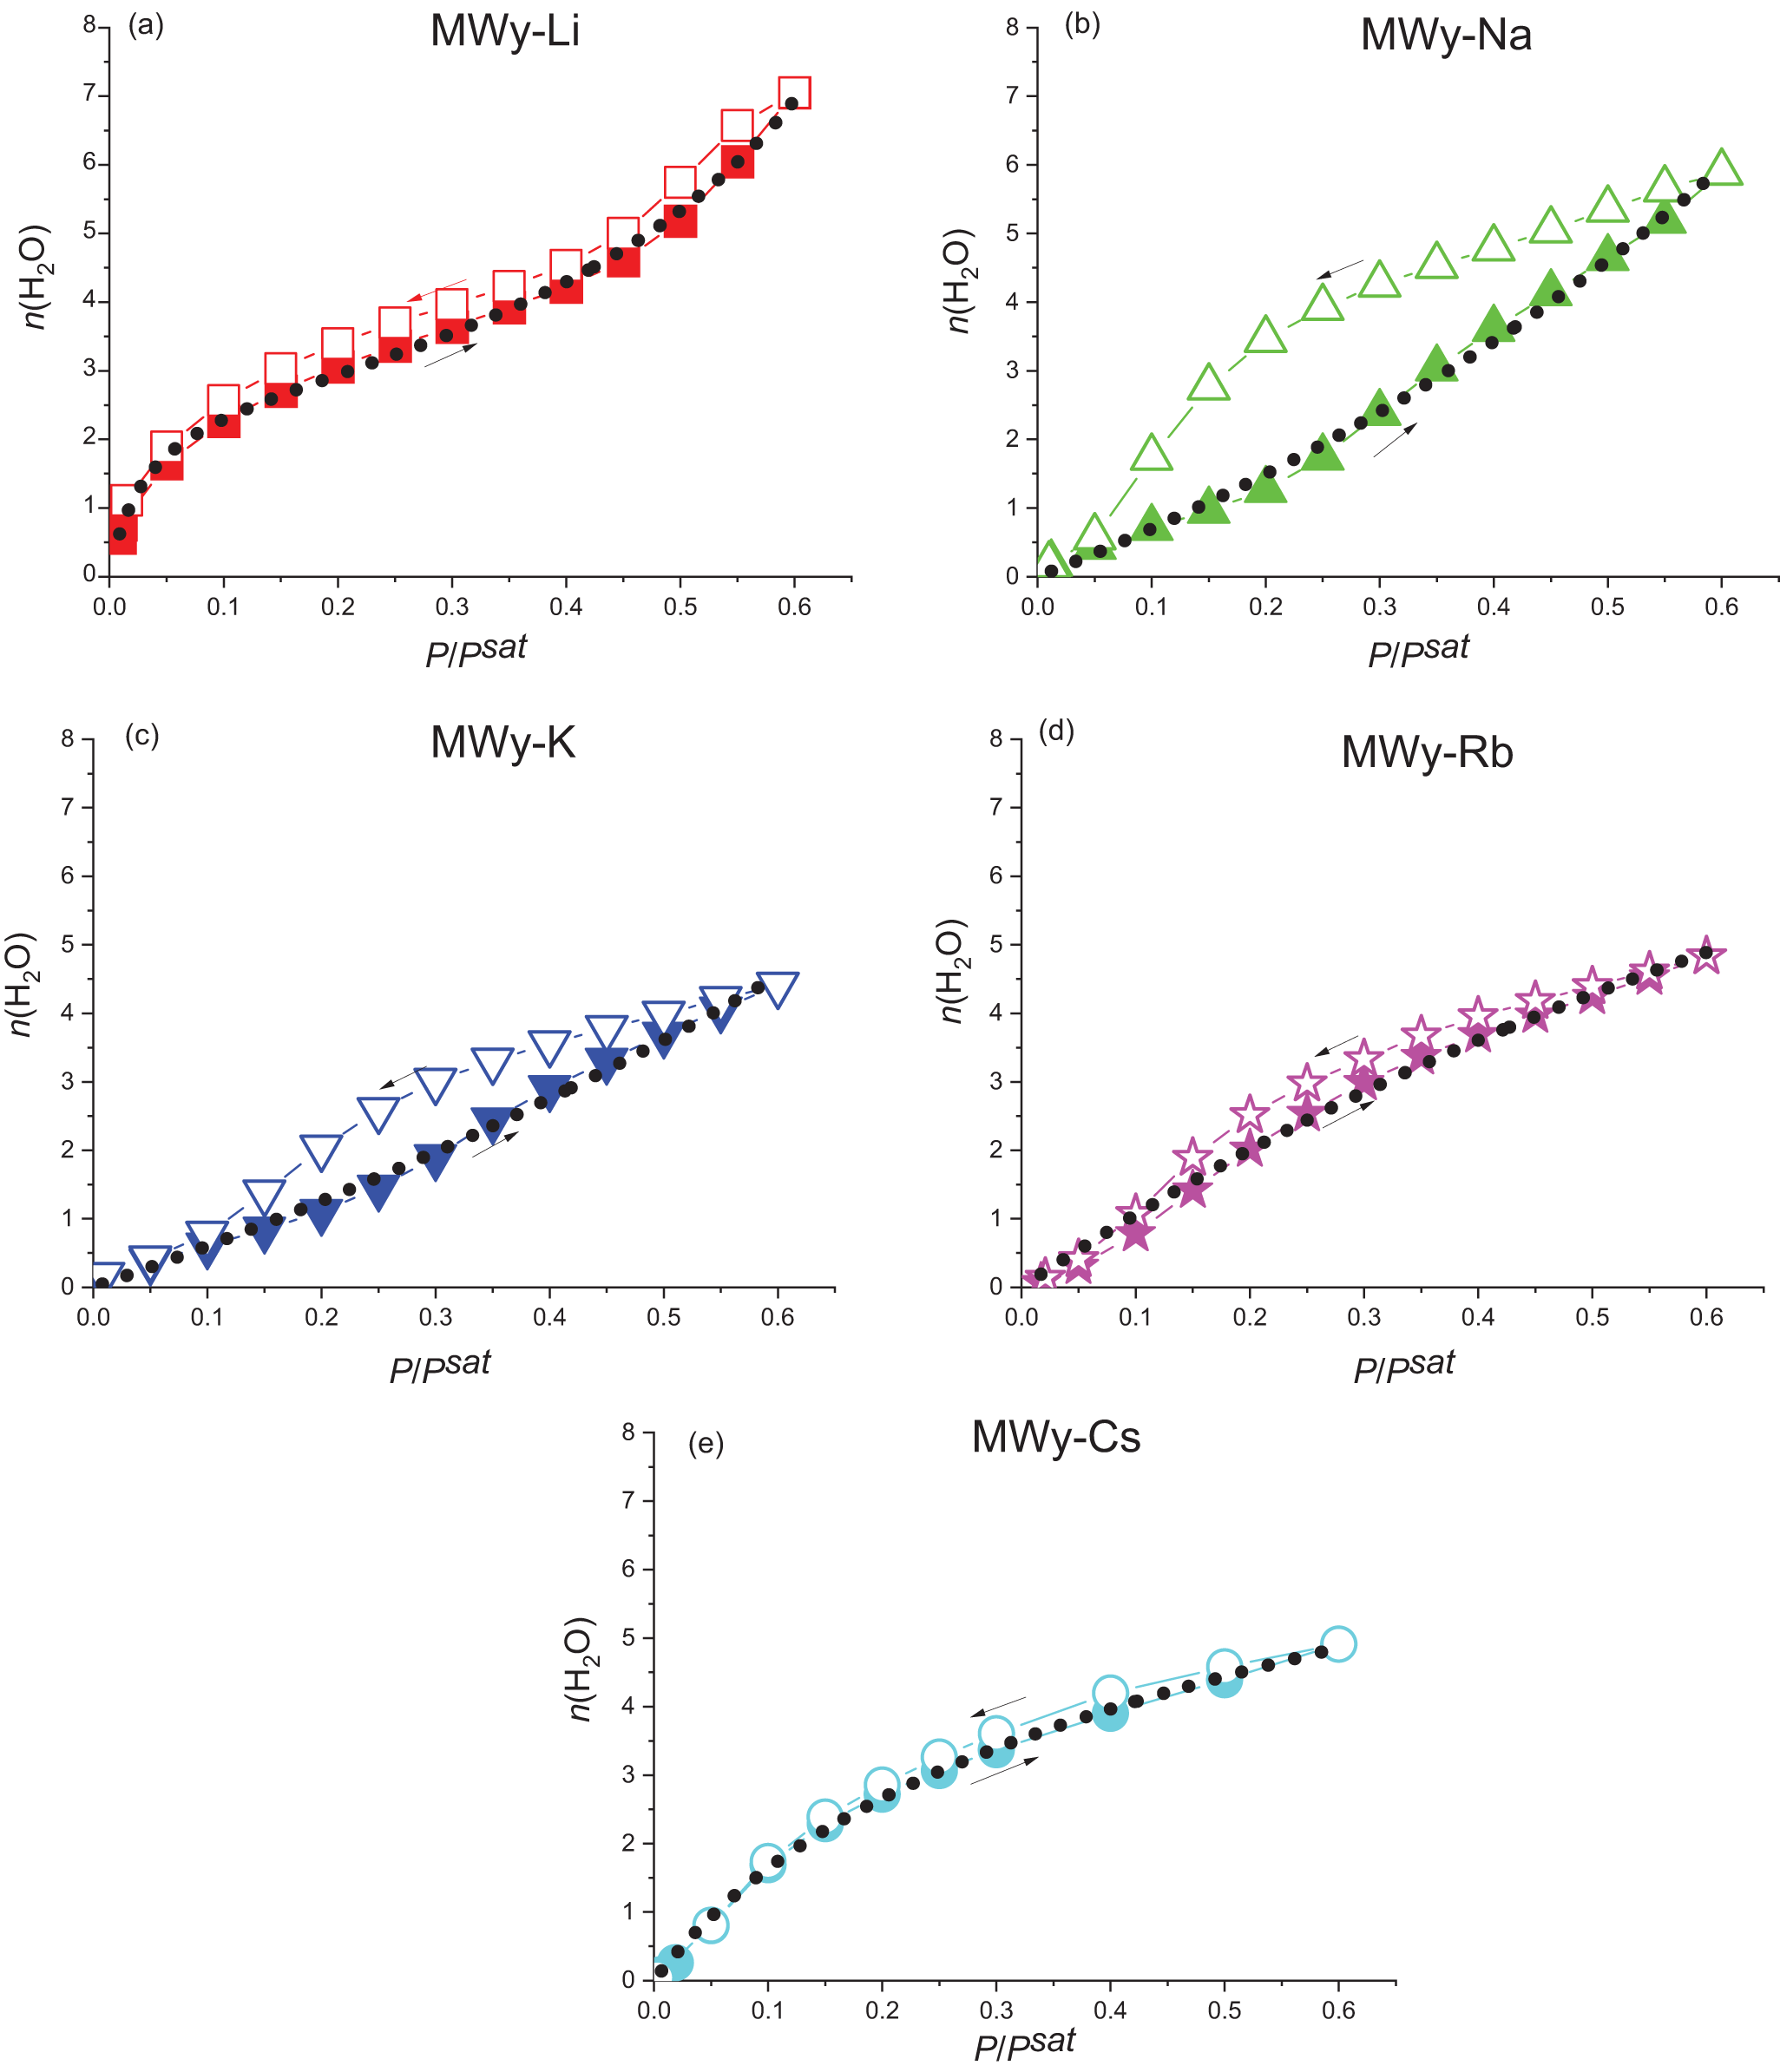
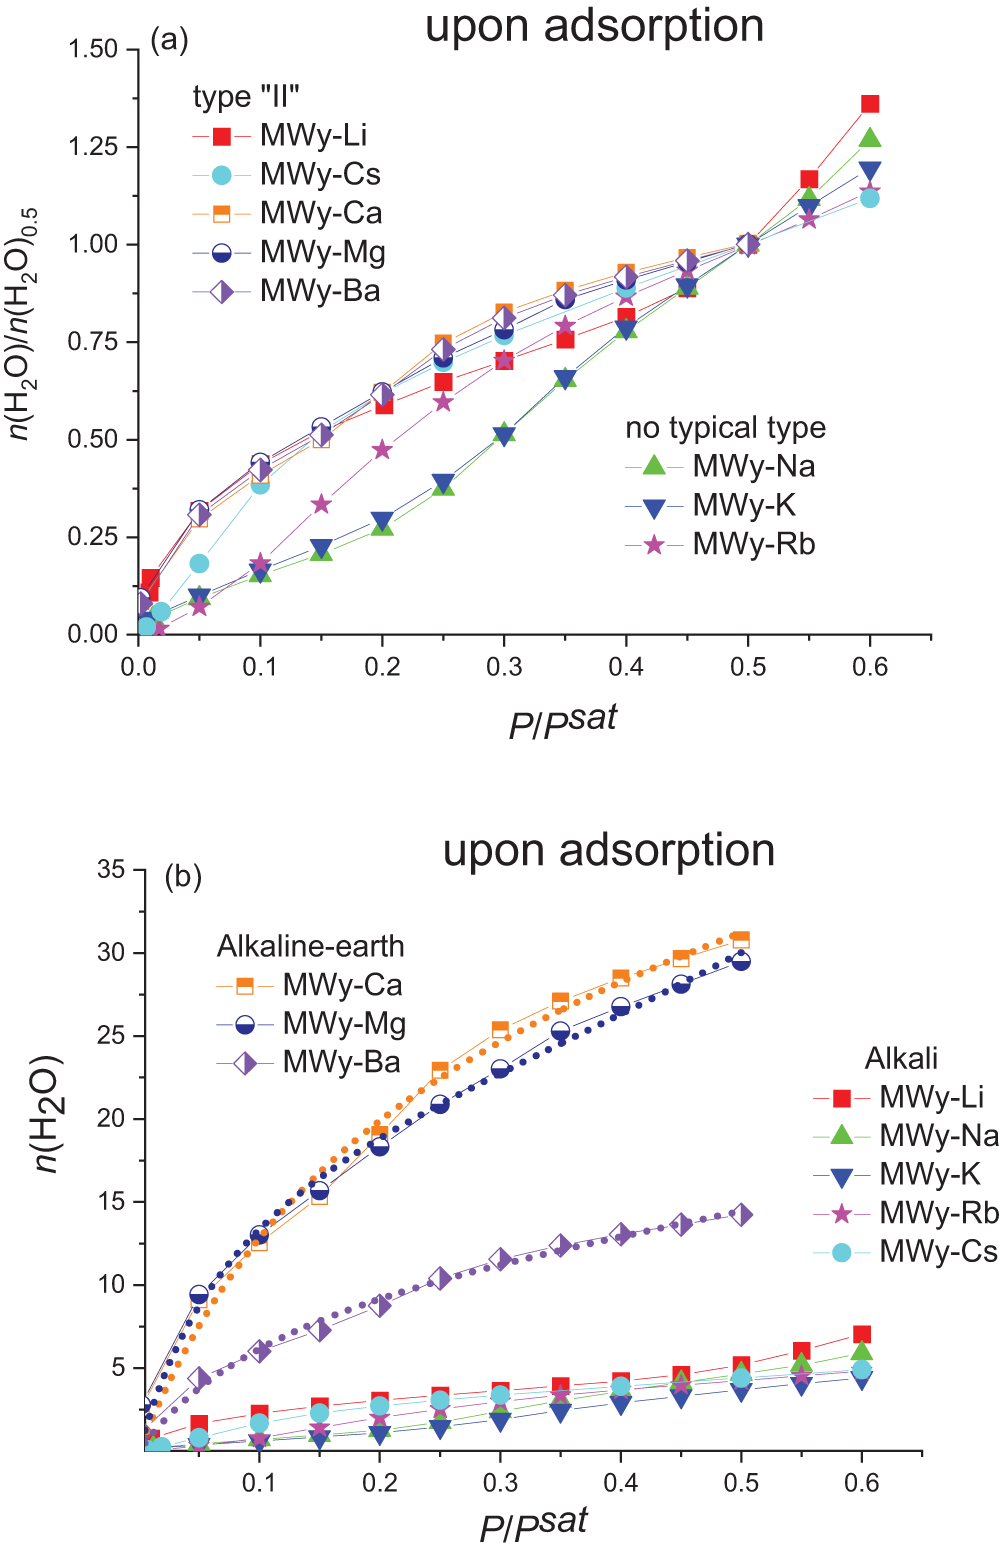
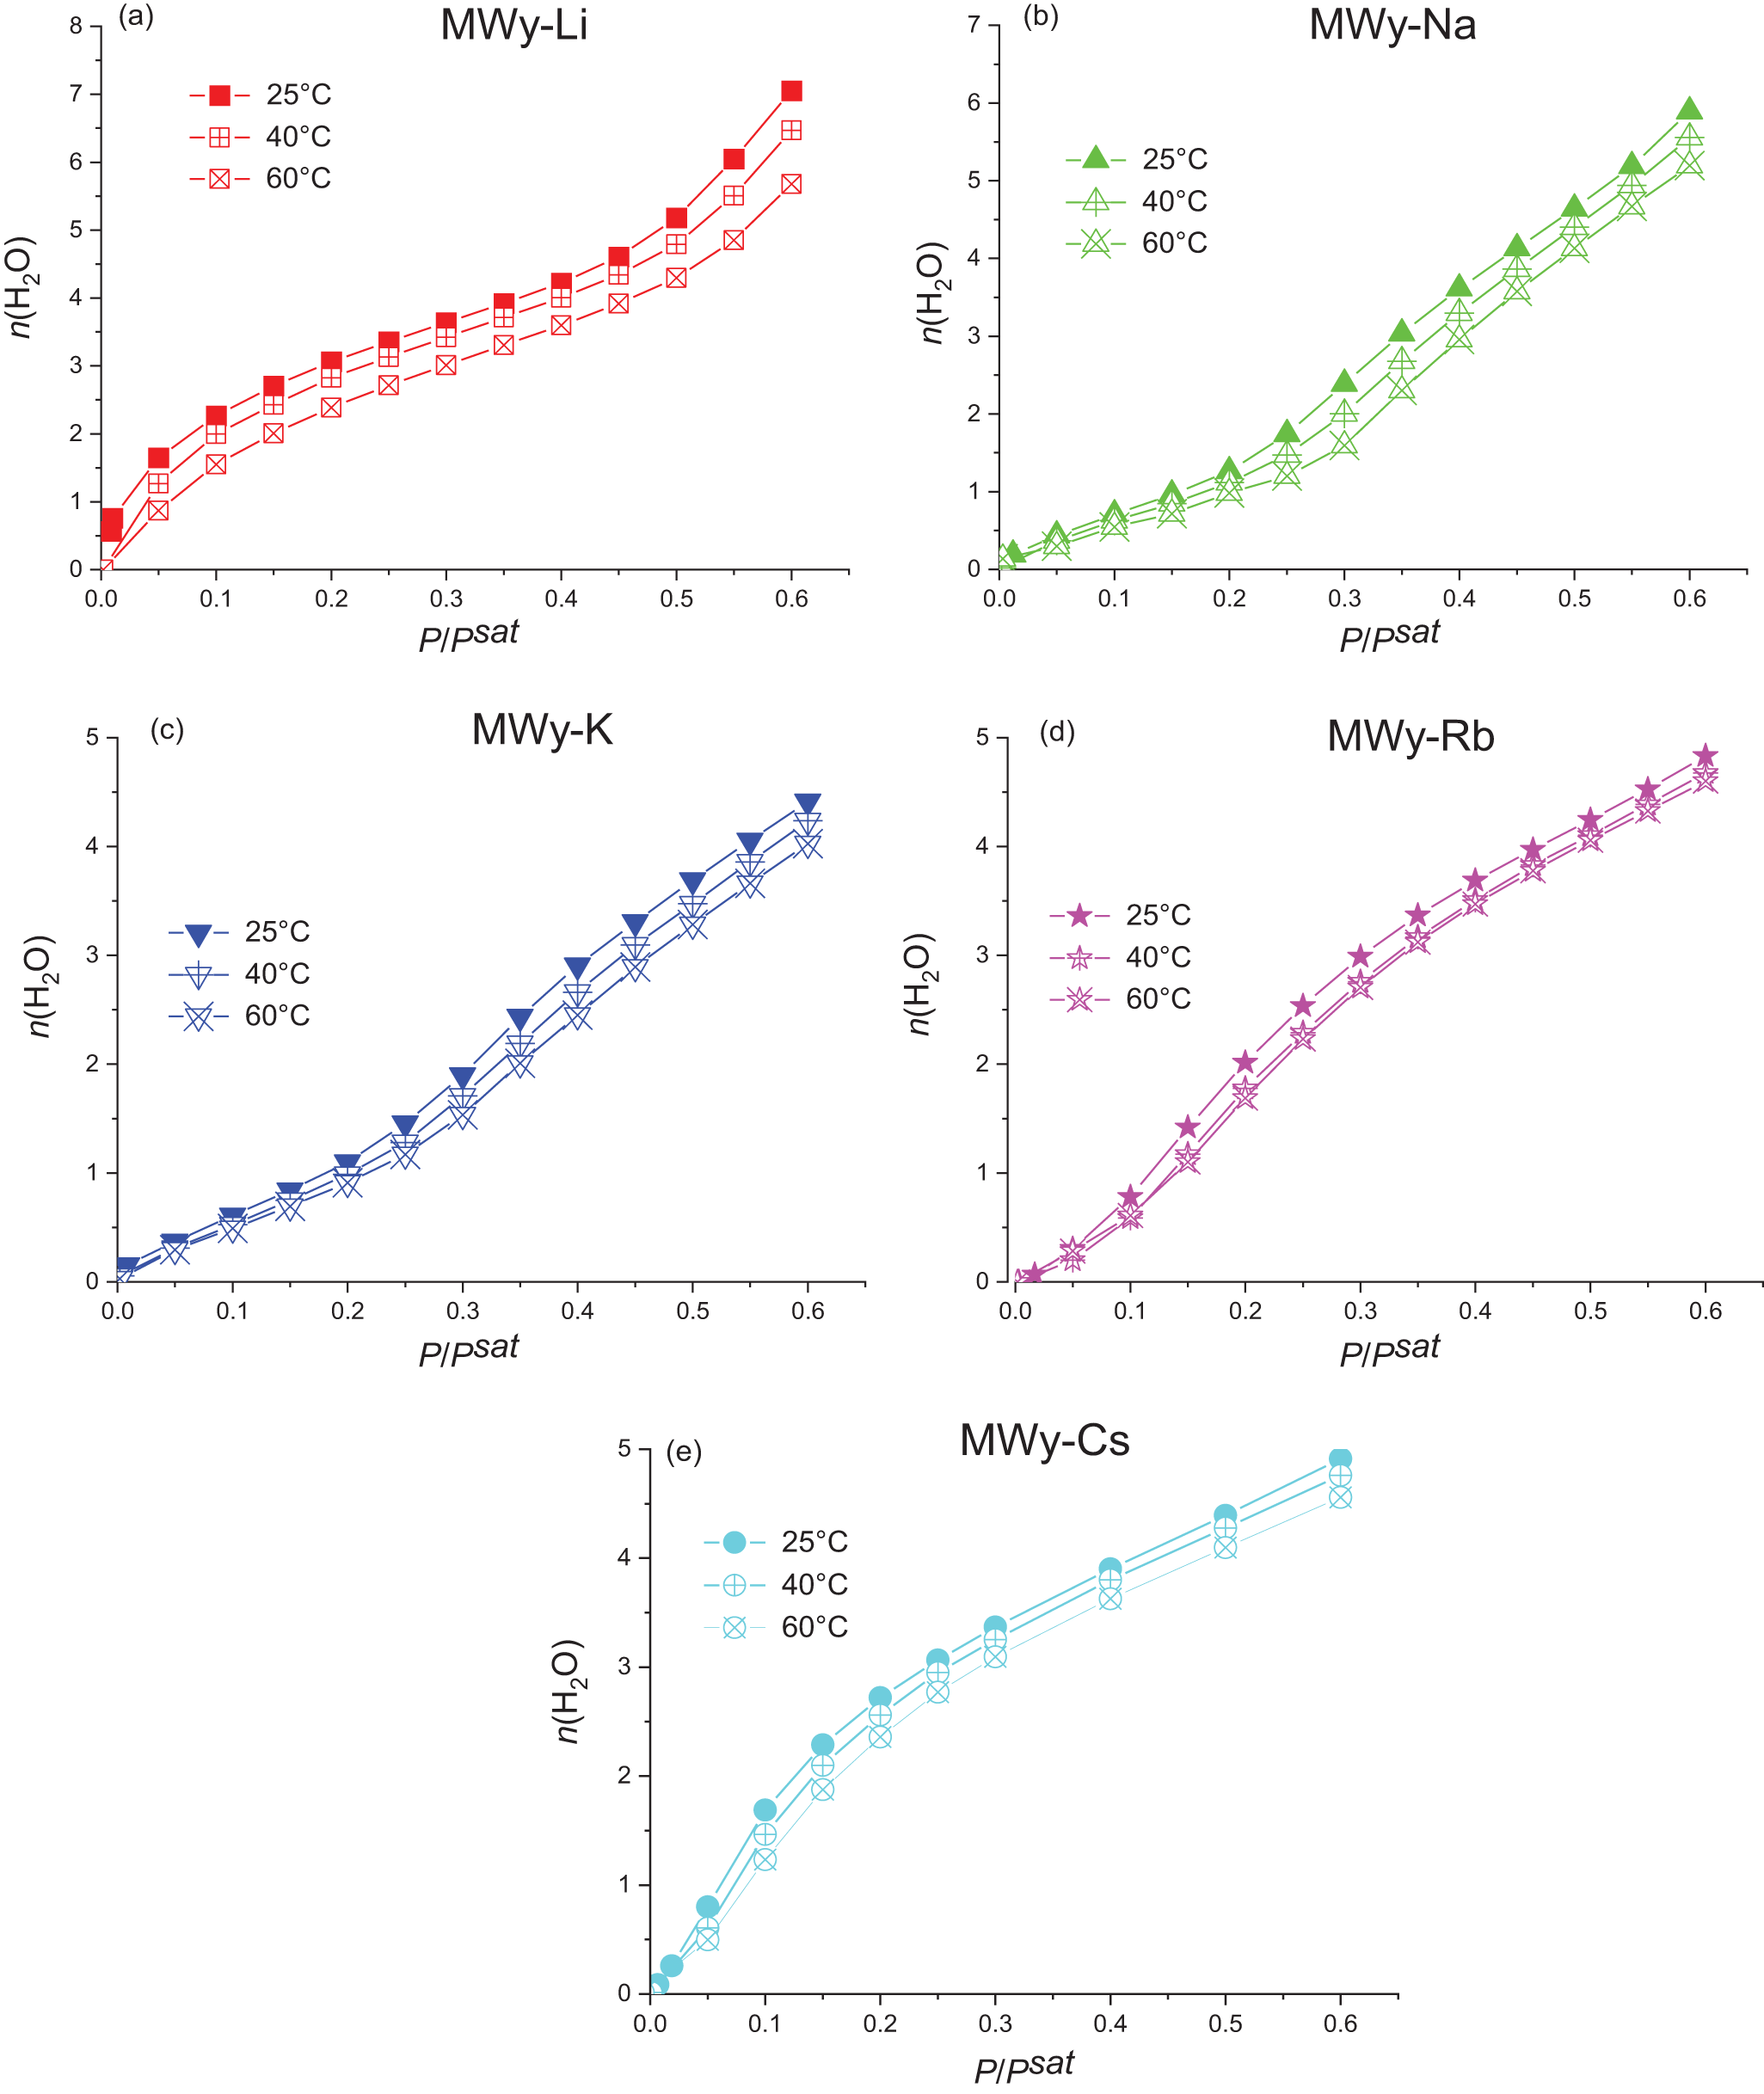
\!\lower0.7ex\hbox{${{P^{sat}}}$}}$ range. The adsorption and desorption isotherms recorded at 25°C are reported in Fig. 3. Then, Fig. 4 compares the adsorption isotherms measured at 25°C, 40°C and 60 °C (see Figs S2 & S3 for desorption data). A preliminary analysis reveals that the shape of the water uptake isotherms can be categorized into two groups, following the standard Langmuir classification.
Evolution of  ${n_{{H_2}O}}$, the number of adsorbed water molecules per alkali cation, as a function of partial water pressure at 25°C for the five alkali-exchanged montmorillonites: (a) MWy-Li, (b) MWy-Na, (c) MWy-K, (d) MWy-Rb and (e) MWy-Cs. Full symbols are data recorded upon adsorption and open symbols are data obtained upon desorption. Solid coloured lines are present to guide the reader. The black dotted lines are the fits obtained from Equation 2.

Evolution of  $n\left( {{H_2}O} \right)$, the number of water molecules per IC adsorbed upon adsorption, as a function of partial water pressure obtained at 25°C on the alkali-exchanged montmorillonites studied in this work and the three alkaline-earth montmorillonites studied in Belhocine et al. (Reference Belhocine, Haouzi, Bassou, Phou, Maurin, Bantignies and Henn2018): (a) normalized to the value
 $n{\left( {{H_2}O} \right)_{0.5}}$, obtained at a partial water pressure of 0.5, and (b) raw data. The coloured dotted lines for the MWy-Mg, -Ca and -Ba samples represent the fits obtained using Equation 2. Data obtained upon desorption are reported on Fig. S3.

The first group includes MWy-Li (Fig. 3a) and MWy-Cs (Fig. 3e), where it can be seen that both samples exhibit a rapid water uptake at very low relative water pressures, followed by slower growth until  ${\raise0.7ex\hbox{$P$} \!\mathord{\left/
{\vphantom {P {{P^{sat}}}}}\right.}
\!\lower0.7ex\hbox{${{P^{sat}}}$}} \approx 0.3 - 0.4{\text{ }}$. This shape corresponds to type ‘II’ in the standard Langmuir classification. For MWy-Li, a second faster increase is observed until
 ${\raise0.7ex\hbox{$P$} \!\mathord{\left/
{\vphantom {P {{P^{sat}}}}}\right.}
\!\lower0.7ex\hbox{${{P^{sat}}}$}} = 0.6$, similar to what was reported by Mooney et al. (Reference Mooney, Keenan and Wood1952), and
 $n\left( {{H_2}O} \right)$ reaches ∼7. For MWy-Cs, the initial fast uptake is followed by a slower increase, and
 $n\left( {{H_2}O} \right)$ reaches 5. The similar shapes exhibited by both samples at the beginning of the isotherms, even though Li+ and Cs+ are at the opposite ends of the alkali series, can possibly be attributed to the interplay between ion solvation energy and the interlayer attracting force. When the solvation energy of the IC is significantly stronger than the TOT attraction force, this energy governs montmorillonite hydration, regardless of the number of adsorbed water molecules. Thus, for MWy-Li, we can assume that the strong solvation enthalpy of Li+ leads to the adsorption of the first water molecules in the interlayer space, thereby causing the rapid increase observed in both water adsorption (Fig. 3a) and in the d(001) parameter (Fig. 2a). In contrast, in the case of MWy-Cs, the larger interlayer space allows the adsorption of the first water molecules despite the lower solvation enthalpy of the IC. This leads to a sharp rise in the adsorption isotherm (Fig. 3e) without a corresponding increase in the d(001) value (Fig. 2e), highlighting that, in MWy-Cs, water uptake and structural changes do not follow the same pattern. Although the adsorption mechanisms in these two cases are not governed by the same dominant forces, the predominance of one over the other leads, on the one hand, to similarly shaped adsorption isotherms, at least at low water pressures, and, on the other hand, to relatively overlapping adsorption and desorption curves. This is the same as that which has been observed previously regarding the three alkaline-earth ICs studied by Belhocine et al. (Reference Belhocine, Haouzi, Bassou, Phou, Maurin, Bantignies and Henn2018), for which the high hydration enthalpy drives water sorption.
The three samples of the second group (i.e. MWy-Na, -K and -Rb) exhibit isotherms that do not readily fit into a standard Langmuir classification (Fig. 3b–d). The closest type could be type ‘V’, characterized by low adsorption at low water pressure followed by a more pronounced uptake. It should be noted that this is not in agreement with previous work, which assigned type ‘III’ to MWy-Na and type ‘II’ to MWy-K (Cancela et al., Reference Cancela, Huertas, Taboada, Rasero and Laguna1997; Ng & Mintova, Reference Ng and Mintova2008). At low  ${\raise0.7ex\hbox{$P$} \!\mathord{\left/
{\vphantom {P {{P^{sat}}}}}\right.}
\!\lower0.7ex\hbox{${{P^{sat}}}$}}$ values, up to ∼[0.1–0.2], the water uptake is slow, before accelerating at higher pressures. The length of the initial slow uptake phase decreases from MWy-Na to -Rb. In addition, it must be emphasized that the adsorption/desorption hysteresis becomes less pronounced as the size of the cation increases. A plausible interpretation of this is that, owing to the relatively low solvation enthalpy of these ICs and the insufficient expansion of the interlayer spacing, the initially adsorbed water molecules preferentially adsorb on the external surfaces of the crystallites. Compared to MWy-Li and -Cs as well as to -Mg, -Ca and -Ba, the competition between the ion hydration and interlayer expansion energies is more balanced. Neither IC solvation nor the TOT attraction force dominates the sorption processes, leading to a more complex interplay. These differences in behaviour are clearly highlighted when the isotherms are superimposed after being normalized to the value of
 $n{\left( {{H_2}O} \right)_{0.5}}$ at
 ${\raise0.7ex\hbox{$P$} \!\mathord{\left/
{\vphantom {P {{P^{sat}}}}}\right.}
\!\lower0.7ex\hbox{${{P^{sat}}}$}} = 0.5$ (Fig. 4a). It can also be observed that the MWy-Rb sample exhibits an intermediate behaviour.
Having considered the isotherm shapes, our attention now turns to the quantity of adsorbed water molecules. At  ${\raise0.7ex\hbox{$P$} \!\mathord{\left/
{\vphantom {P {{P^{sat}}}}}\right.}
\!\lower0.7ex\hbox{${{P^{sat}}}$}} = 0.5$ and T = 25°C,
 $n{\left( {{H_2}O} \right)_{0.5}}$ follows the order: Li(∼5.2) > Na(∼4.6) ≈ Cs(∼4.4) ≈ Rb(∼4.3) > K(∼3.7) (Table 3). Interestingly, this sequence does not strictly correlate with cation size, so our results are in alignment with previous findings (Berend et al., Reference Berend, Cases, François, Uriot, Michot, Masion and Thomas1995; Le Forestier et al., Reference Le Forestier, Muller, Villieras and Pelletier2010). Vieillard et al. (Reference Vieillard, Blanc, Fialips, Gailhanou and Gaboreau2011) obtained the same order of Na > Cs ≈ Rb > K for exchanged montmorillonites from a numerical simulation. In addition, Kharroubi et al. (Reference Kharroubi, Balme, Haouzi, Belarbi, Sekou and Henn2012) and Berend et al. (Reference Berend, Cases, François, Uriot, Michot, Masion and Thomas1995) found the same Li > Na > Cs ≈ Rb > K order using thermogravimetric analysis and adsorption isotherms.
Upon adsorption at  ${\raise0.7ex\hbox{$P$} \!\mathord{\left/
{\vphantom {P {{P^{sat}}}}}\right.}
\!\lower0.7ex\hbox{${{P^{sat}}}$}} = 0.1$, the order changes to: Li(∼2.3) > Cs(∼1.7) > Rb(∼0.78) > Na(∼0.71) > K(∼0.61). This low-pressure order results from the existence of two distinct types of behaviour, manifested as two different isotherm shapes (Fig. 5).
Evolution of  $n\left( {{H_2}O} \right)$, the number of adsorbed water molecules per alkali cation, as a function of partial water pressure obtained at 25°C, 40°C and 60°C for the five alkali-exchanged montmorillonites: (a) MWy-Li, (b) MWy-Na, (c) MWy-K, (d) MWy-Rb and (e) MWy-Cs. Data obtained upon adsorption. Solid coloured lines are present to guide the reader. Data obtained upon desorption are reported in Fig. S2.

No direct correlation between water uptake and isotherm shape occurs. It is notable that MWy-K, regardless of its position in the series, is the least adsorbent sample. This property has been thoroughly established and has been utilized for decades to achieve a swelling inhibitor phase, as reported in many previous reports (Berend et al., Reference Berend, Cases, François, Uriot, Michot, Masion and Thomas1995; Cancela et al., Reference Cancela, Huertas, Taboada, Rasero and Laguna1997; Liu & Lu, Reference Liu and Lu2006; Vieillard et al., Reference Vieillard, Blanc, Fialips, Gailhanou and Gaboreau2011; Kawakita et al., Reference Kawakita, Saito, Sakuma, Anraku, Kikuchi, Otake and Sato2023). While MWy-Rb and -Cs adsorb more water than MWy-K at  ${\raise0.7ex\hbox{$P$} \!\mathord{\left/
{\vphantom {P {{P^{sat}}}}}\right.}
\!\lower0.7ex\hbox{${{P^{sat}}}$}} = 0.5$, their d(001) isotherms (Fig. 2d,e) show that they must also be considered to be swelling inhibitors.
From the adsorption isotherms obtained at 25°C, 40°C and 60°C (Fig. 5), the following observations can be made:
(1) Water uptake decreases with increasing temperature, as would be expected for most exothermic processes.
(2) The shape of the isotherms remains relatively unchanged with temperature, suggesting that the adsorption mechanism remains similar within this temperature range. This is not surprising if we consider that the forces involved in the adsorption process (i.e. IC solvation and TOT attraction) are temperature independent, at least between 25°C and 60°C.
Similar trends are observed in the evolution of the desorption isotherms with temperature (Figs S2 & S3).
Isosteric heat of the adsorption–desorption of water: the case of the alkali-exchanged montmorillonites
The measurable temperature shift in  ${\raise0.7ex\hbox{$P$} \!\mathord{\left/
{\vphantom {P {{P^{sat}}}}}\right.}
\!\lower0.7ex\hbox{${{P^{sat}}}$}}$ for a given water uptake allows for the determination of the isosteric heat of sorption
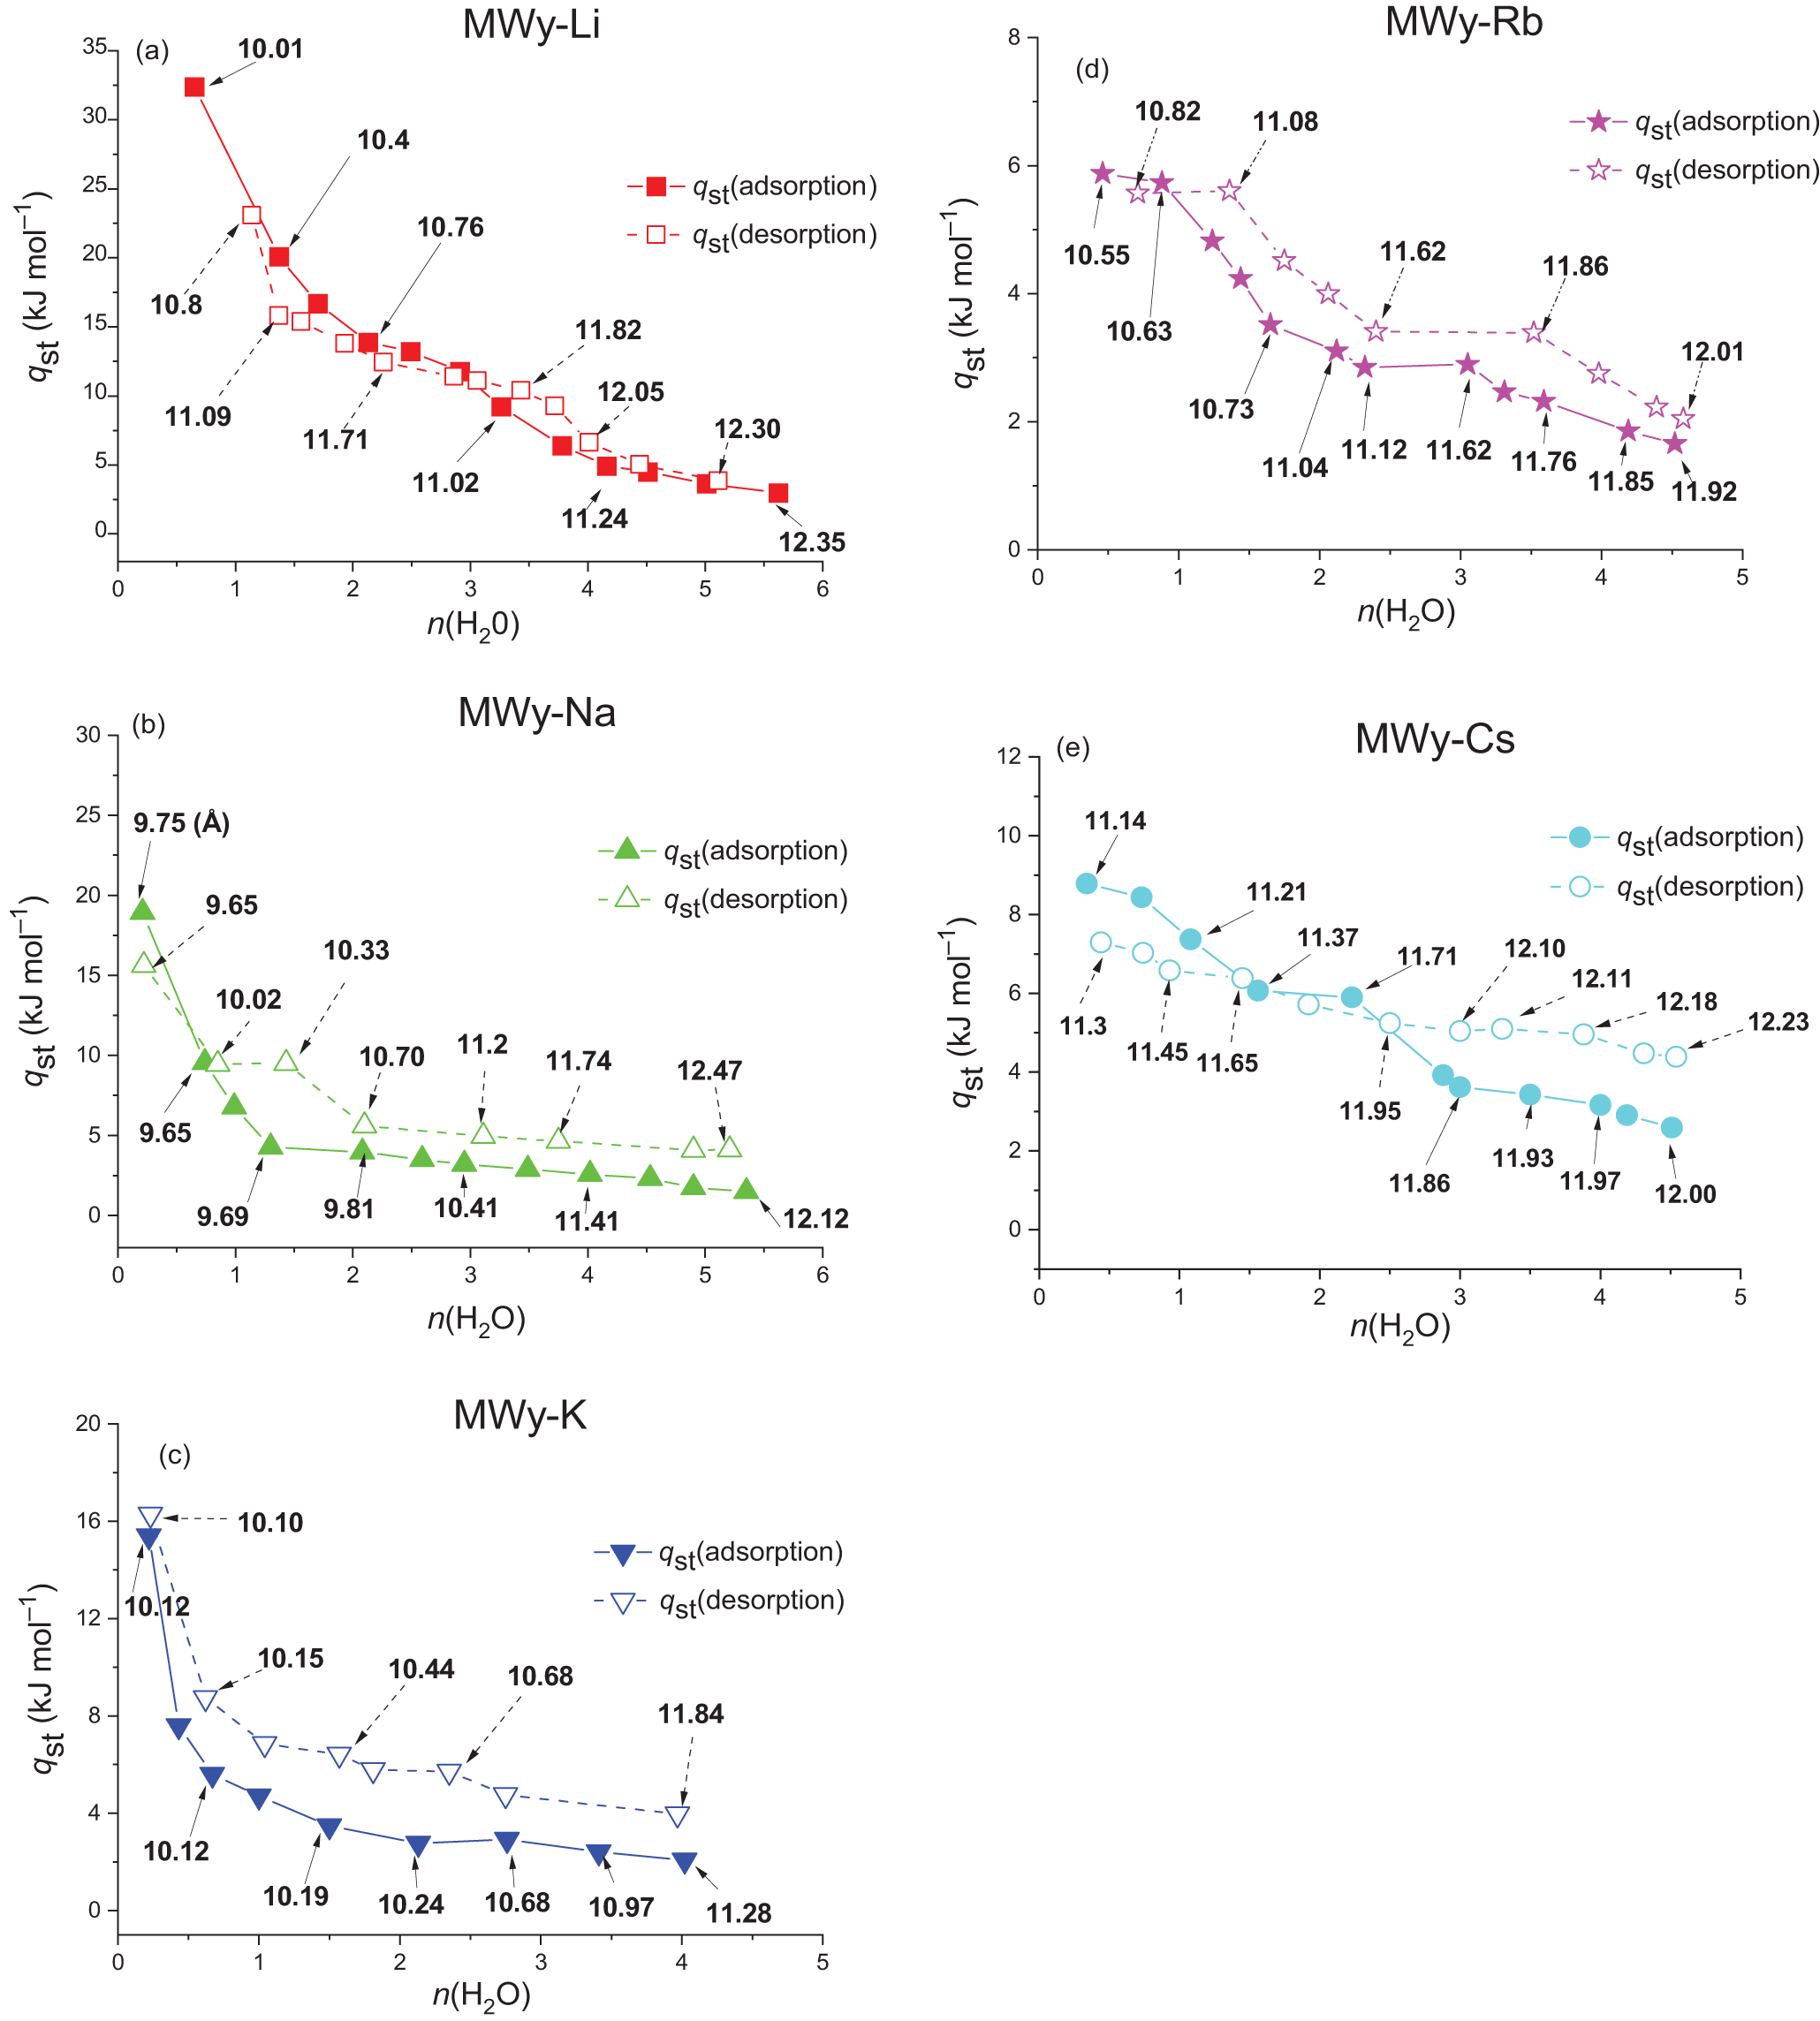
 $q_{{\text{st}}}^*$ using Equation 1 for all samples (Fig. 6). The following trends can be identified:
(1) Both
$q_{{\text{st}},{\text{ads}}}^{\text{*}}$ and
$q_{{\text{st}},{\text{ des}}}^{\text{*}}$ decrease as water loading increases.(2) As was observed in the sorption isotherms, the MWy-Li and -Cs samples on the one hand and the MWy-Na and -K samples on the other display distinct but internally consistent behaviours. For MWy-Li and -Cs, the isosteric heat decreases continuously. In contrast, the MWy-Na and -K samples exhibit a more complex pattern, characterized by an initial sharp decline, followed by a plateau and then a slower decrease. The MWy-Rb sample shows an intermediate profile with a flat first domain.
(3) In addition to the previously noted distinct yet internally consistent patterns, it is also worth noting that the adsorption and desorption curves of the MWy-Li and -Cs samples intersect at
${\text{ }}n\left( {{H_2}O} \right)$ values between ∼2 and 3, a feature that is not observed for the other samples.(4) The hysteresis is more pronounced for MWy-K and -Na compared to the other samples, as was also observed for the sorption isotherms (Fig. 3b,c).
(5) At
$n\left( {{H_2}O} \right) \lt 1$, adsorption isosteric heat follows the order (in kJ mol–1 ± 0.5): Li(32) > Na(19) > K(15) > Cs(9) > Rb(6), which is close to the periodic table order.(6) However, at
$n\left( {{H_2}O} \right) \approx 1$, adsorption isosteric heat follows another order (in kJ mol–1 ± 0.5): Li(20) > Cs(7.5) > Rb(5) ≈ Na(4.5) ≈ K(4.5). Again, this outcome aligns with the grouping of MWy-Li/Cs and MWy-Na/K/Rb observed in the adsorption isotherms (Fig. 4a).(7) Water desorption, at
$n\left( {{H_2}O} \right) \approx 1$, the value of
${\text{q}}_{{\text{st}},{\text{ des}}}^{\text{*}}$ follows again the periodic table order (in kJ mol–1 ± 0.5): Li(16) > Na(9.5) > K(7) > Cs(6) ≈ Rb(5.5), thus suggesting that at this loading desorption is primarily driven by the IC (de)solvation energy.(8) At the highest water loadings, the isosteric heats of adsorption and desorption are relatively insensitive to the IC, typically ranging between 2 and 5 kJ mol–1.
(9) Overall, the values obtained for
${\text{q}}_{{\text{st}},{\text{ads}}}^{\text{*}}$ and
$q_{{\text{st}},{\text{ des}}}^{\text{*}}$ fall within the expected range for ionic polar surfaces and are in line with many previous studies (Cancela et al., Reference Cancela, Huertas, Taboada, Rasero and Laguna1997; Khalfi & Blanchart, Reference Khalfi and Blanchart1999; Ng & Mintova, Reference Ng and Mintova2008; Zhang et al., Reference Zhang, Singh and Webley2008; Kharroubi et al., Reference Kharroubi, Balme, Henn, Giuntini, Belarbi and Haouzi2009; Vieillard et al., Reference Vieillard, Blanc, Fialips, Gailhanou and Gaboreau2011).


Variation of isosteric heat of adsorption as a function of the number of adsorbed water molecules per alkali cation  $n\left( {{H_2}O} \right)$ for alkali-exchanged montmorillonites: (a) MWy-Li, (b) MWy-Na, (c) MWy-K, (d) MWy-Rb and (e) MWy-Cs. Solid symbols represent data obtained during adsorption while open symbols correspond to desorption data. The colored solid and dashed lines are provided as visual guides. The numbers indicated on each curve represent the corresponding d(001) interlayer spacing in angstroms, as extracted from the data presented in Fig. 2.

Water sorption in alkali-exchanged montmorillonites: comparison of structural and water sorption isotherms with isosteric heat
MWy-Li
The sorption of water in the MWy-Li sample exhibits a characteristic behaviour typical of hydrophilic solids with lamellar structures (Figs 2a, 3a & 6a). The high solvation energy of Li+ enables a rapid and pronounced opening of the interlayer space at low water pressures, leading to a sharp adsorption of water and increase in d(001) spacing. Once the interlayer is sufficiently opened by the initial adsorbed water molecules, swelling and water uptake decelerate until a monolayer is formed at  ${\raise0.7ex\hbox{$P$} \!\mathord{\left/
{\vphantom {P {{P^{sat}}}}}\right.}
\!\lower0.7ex\hbox{${{P^{sat}}}$}} \approx 0.4$. Further water adsorption results in the progressive filling of additional water layers and a gradual swelling effect. The reversibility of the sorption process is evident from the similarity between the isosteric heats of adsorption and desorption, suggesting that the phenomenon is primarily governed by the interaction energies between water molecules and Li+ cations, with minimal entropic effects.
It can be observed (Fig. 6a) that ${\text{ }}q_{{\text{st}},{\text{ads}}}^{\text{*}}$ decreases sharply from ∼33 to ∼14 kJ mol–1 during the adsorption of the two first water molecules per IC resulting from the Li+ solvation and swelling, which occurs below
 ${\raise0.7ex\hbox{{{P}}} \!\mathord{\left/
{\vphantom {{\text{P}} {{P^{sat}}}}}\right.}
\!\lower0.7ex\hbox{${{P^{sat}}}$}} = 0.1$ (Fig. 2a). Then, when
 $n\left( {{H_2}O} \right){\text{ }}$is between ∼2 and ∼3 (i.e. when
 $~0.1 \lt \!\!{\raise0.7ex\hbox{{{P}}} \!\mathord{\left/
{\vphantom {{\text{P}} {{P^{sat}}}}}\right.}
\!\lower0.7ex\hbox{${{P^{sat}}}$}} \lt \!\!0.2$), the initial swelling step is complete (Fig. 2a) and q st,ads decreases more gradually. Finally, when
 $n\left( {{H_2}O} \right)$ increases beyond 3, a second swelling step occurs and q st,ads decreases more rapidly. This behaviour agrees well with a previous study on the evolution of ionic direct current (DC) conductivity with water uptake, in which it was shown that the initial adsorbed water molecules significantly enhance conductivity and reduce activation energy, indicating strong interactions with Li+ ions and subsequent cation extraction from their crystallographic sites (Kharroubi et al., Reference Kharroubi, Balme, Haouzi, Belarbi, Sekou and Henn2012).
MWy-Na
Structural evolution (Fig. 2b) and water sorption (Fig. 3b) both exhibit similar trends and high irreversibility. The initial slow evolution of d(001) and of  $n\left( {{H_2}O} \right)$ suggests that the initial water molecules do not intercalate the interlayer space but preferentially solvate Na+ cations located on the external surface of the montmorillonite crystallites, probably at the TOT edges. The rapid decrease in
 $q_{{\text{st}},{\text{ads}}}^{\text{*}}$ from ∼19 to ∼4 kJ mol–1 at low water pressures further supports this interpretation, as it primarily reflects the solvation energy of Na+ ions (Fig. 6b) with no compensation from the TOT expansion. As water uptake increases (i.e. when
 ${\raise0.7ex\hbox{{{P}}} \!\mathord{\left/
{\vphantom {{\text{P}} {{P^{sat}}}}}\right.}
\!\lower0.7ex\hbox{${{P^{sat}}}$}} \approx 0.2$), the interlayer space begins to gradually expand, indicating the progressive intercalation of water molecules and IC solvation. The slight decrease in
 $q_{{\text{st}},{\text{ads}}}^{\text{*}}$ results from the interplay of the opposing energy contributions from IC solvation and TOT expansion. This outcome is also in accordance with the change in ionic DC conductivity, which confirms the interaction between water molecules and Na+, first on the external surface and then inside the interlayer space (Kharroubi et al., Reference Kharroubi, Balme, Haouzi, Belarbi, Sekou and Henn2012).
The isosteric heat curves (Fig. 6b) exhibit irreversibility, similar to that observed for the water sorption isotherms (Fig. 3b) and XRD data (Fig. 2b). These observations further support the idea that adsorption and desorption follow different pathways. During adsorption, the initial water molecules bind to the cation located at the TOT edges, thus lowering the energy barrier for subsequent insertion into the interlayer and promoting swelling. In contrast, during desorption, water molecules coordinated to the IC remain trapped within the interlayer when those bound at the edge are first released. The latter are then replaced by the interlayer water, leading to a reorganization of the remaining trapped molecules. Once the interlayer is emptied, desorption proceeds from the edges, which is a more reversible process, as indicated by the marked decrease in the difference between  $q_{{\text{st}},{\text{des}}}^{\text{*}}$ and
 $q_{{\text{st}},{\text{ads}}}^{\text{*}}$ at very low water pressures.
MWy-K
As with MWy-Na, for MWy-K no significant change in d(001) spacing is observed until  ${\raise0.7ex\hbox{{{P}}} \!\mathord{\left/
{\vphantom {{\text{P}} {{P^{sat}}}}}\right.}
\!\lower0.7ex\hbox{${{P^{sat}}}$}} \approx 0.25 - 0.3$ or
 $n\left( {{H_2}O} \right) = 1 - 1.5$ (Fig. 2c), indicating that the first water molecules primarily interact with K+ cations located at the TOT edge. This adsorption stage is marked by a rapid decrease in the isosteric heat of adsorption from ∼15 to ∼3 kJ mol–1, suggesting efficient cation solvation. Subsequently, a limited swelling of ∼2 Å occurs, corresponding to a minimal water uptake (i.e.
 $n\left( {{H_2}O} \right) \approx 4.5$, the lowest among all alkali samples). During this second adsorption stage,
 ${\text{q}}_{{\text{st}},{\text{ads}}}^{\text{*}}$ remains relatively constant at ∼2 kJ mol–1, signifying that the weaker solvation energy of K+ ions is compensated by the TOT layer attractive force. The significant irreversibility observed in MWy-K can be explained using a similar mechanism as for MWy-Na, but with a less pronounced effect throughout the desorption process due to a more balanced competition between the cation solvation and TOT attraction forces owing to the larger size of K+ and the resulting larger value of d(001) (Boek et al., Reference Boek, Coveney and Skipper1995).
MWy-Rb
We can analyse MWy-Rb structural (Fig. 2d) and water uptake (Fig. 3d) isotherms in the same way we interpret those of MWy-K and MWy-Na. What sets MWy-Rb apart is that the larger Rb+ ion makes adsorption and desorption within the interlayer space easier. Consequently, the first measurable value of  $q_{{\text{st}},{\text{ads}}}^{\text{*}}$ already incorporates some degree of interlayer expansion, resulting in a lower initial isosteric heat of adsorption and a plateau (Fig. 6d). As water uptake increases, d(001) spacing remains relatively constant, and the isosteric heat decreases only slightly. This is confirmed by the less irreversible desorption process for MWy-Rb compared to MWy-K and -Na.
MWy-Cs
For MWy-Cs, as previously highlighted through the comparison of the water sorption and the d(001) isotherms, the water molecules adsorb into the interlayer space without inducing significant swelling. This process occurs gradually, leading to a progressive decrease in the adsorption isosteric heat. A similar gradual trend is observed during desorption. Furthermore, it can also be observed that the adsorption and desorption isotherms intersect within the range of between 1 and 2. This behaviour appears similar to that of MWy-Li, but for different reasons, as, in this case, the adsorption/desorption process is primarily governed by the TOT attraction force.
Comparative analysis of the hydration behaviour of montmorillonites exchanged with alkali vs alkaline-earth metal cations
Our previous thermodynamic study conducted under identical conditions on the same reference montmorillonite exchanged with the three alkaline-earth cations (i.e. Mg, Ca and Ba) provides a valuable comparison (Belhocine et al., Reference Belhocine, Haouzi, Bassou, Phou, Maurin, Bantignies and Henn2018). The results reveal a significantly higher water adsorption capacity per cation for alkaline-earth cations compared to alkali cations (Fig. 4b), as previously reported in the literature (Ferrage et al., Reference Ferrage, Lanson, Sakharov and Drits2005; Vieillard et al., Reference Vieillard, Blanc, Fialips, Gailhanou and Gaboreau2011). This can be primarily attributed to the divalent nature of alkaline-earth cations, which enhances their ability to be solvated by a much higher number of water molecules and hence giving these montmorillonites a capacity to swell, similar to MWy-Li and MWy-Na (Berend et al., Reference Berend, Cases, François, Uriot, Michot, Masion and Thomas1995; Ferrage et al., Reference Ferrage, Lanson, Sakharov and Drits2005; Vieillard et al., Reference Vieillard, Blanc, Fialips, Gailhanou and Gaboreau2011). However, relating  $n\left( {{H_2}O} \right)$ to the IC charge is not enough to account for the observed differences. Indeed, even when
 $n\left( {{H_2}O} \right)$ is normalized by the IC charge, the water uptake per charge remains significantly larger for the Mg and Ca samples, thus emphasizing their distinct impacts on adsorption and swelling. A further interesting aspect is the comparison of isotherm shapes achieved by normalizing them to the water uptake at
 ${\raise0.7ex\hbox{{{P}}} \!\mathord{\left/
{\vphantom {{\text{P}} {{P^{sat}}}}}\right.}
\!\lower0.7ex\hbox{${{P^{sat}}}$}} = 0.5$ (Fig. 4a). This procedure emphasizes the similarities and differences observed across the various exchanged montmorillonites. MWy-Mg, -Ca and -Ba exhibit adsorption isotherms similar to MWy-Li and, to some extent, MWy-Cs, characterized by a rapid initial increase followed by a slower increase. This behaviour corresponds to type ‘II’ in the standard Langmuir classification. Notably, due to the significant irreversibility observed for the MWy-Na isotherm, the superposition of normalized desorption isotherms does not perfectly follow that of the adsorption isotherms (see Fig. S3). These outcomes are in line with those reported by Cancela et al. (Reference Cancela, Huertas, Taboada, Rasero and Laguna1997).
The two distinct adsorption behaviours observed in the montmorillonites can be further interpreted using the Dent model, which predicts isotherms for systems with two families of independent adsorption sites characterized by different interaction energies with water molecules. The experimental data can be fitted using Equation 2 (Du & Wang, Reference Du and Wang2022):
 \begin{align}n\left( {{H_2}O} \right) = \frac{{n\left( {{H_2}O,{\text{ }}mono} \right).{{\text{K}}_1}.{\raise0.7ex\hbox{$P$} \!\mathord{\left/
{\vphantom {P {{P^{sat}}}}}\right.}
\!\lower0.7ex\hbox{${{P^{sat}}}$}}}}{{\left( {1{\text{ }} - {\text{ }}{{\text{K}}_2}.{\raise0.7ex\hbox{$P$} \!\mathord{\left/
{\vphantom {P {P^\circ }}}\right.}
\!\lower0.7ex\hbox{${P^{0} }$}}} \right).\left( {1{\text{ }} - {\text{ }}{{\text{K}}_2}.{\raise0.7ex\hbox{$P$} \!\mathord{\left/
{\vphantom {P {{P^{sat}}}}}\right.}
\!\lower0.7ex\hbox{${{P^{sat}}}$}}{\text{ }} + {\text{ }}{{\text{K}}_1}.{\raise0.7ex\hbox{$P$} \!\mathord{\left/
{\vphantom {P {{P^{sat}}}}}\right.}
\!\lower0.7ex\hbox{${{P^{sat}}}$}}} \right)}}\end{align}
where  $n\left( {{H_2}O,{\text{ }}mono} \right)$ is the number of water molecules per cation that would correspond to the monolayer and
 ${{\text{K}}_1}$ and
 ${{\text{K}}_2}$ are the constants associated with adsorption sites 1 and 2, respectively. The Dent model, which assumes two independent adsorption sites with different interaction energies, accurately fits the experimental data for MWy-Li, -Cs, -Mg, -Ca and -Ba with minimal irreversibility (Figs 3 & 4b). For these montmorillonites,
 ${{\text{K}}_2}$ can be set to zero, as there is no second water layer adsorbed in the explored water pressure. In contrast, for MWy-Na, -K and -Rb, the Dent model fails to converge (see dotted lines in Fig. 3b–d), suggesting that a more sophisticated model is necessary, one that accounts for the interplay between IC solvation and the TOT attraction force. This competition may favour the initial adsorption of water molecules within microporous domains, such as TOT particle edges or confined cavities, as previously inferred from the trends in isosteric sorption heat and the observed isotherm irreversibility in these three samples (Rutherford et al., Reference Rutherford, Chiou and Eberl1997; Ng & Mintova, Reference Ng and Mintova2008).
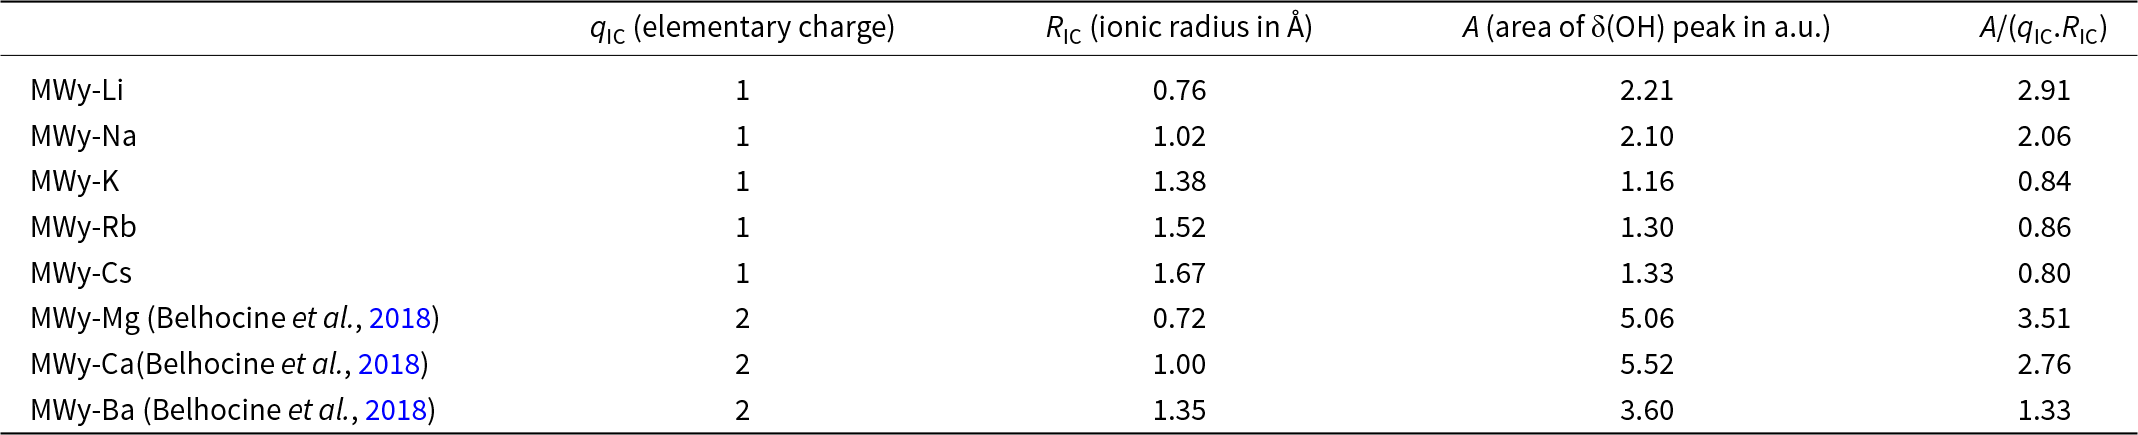
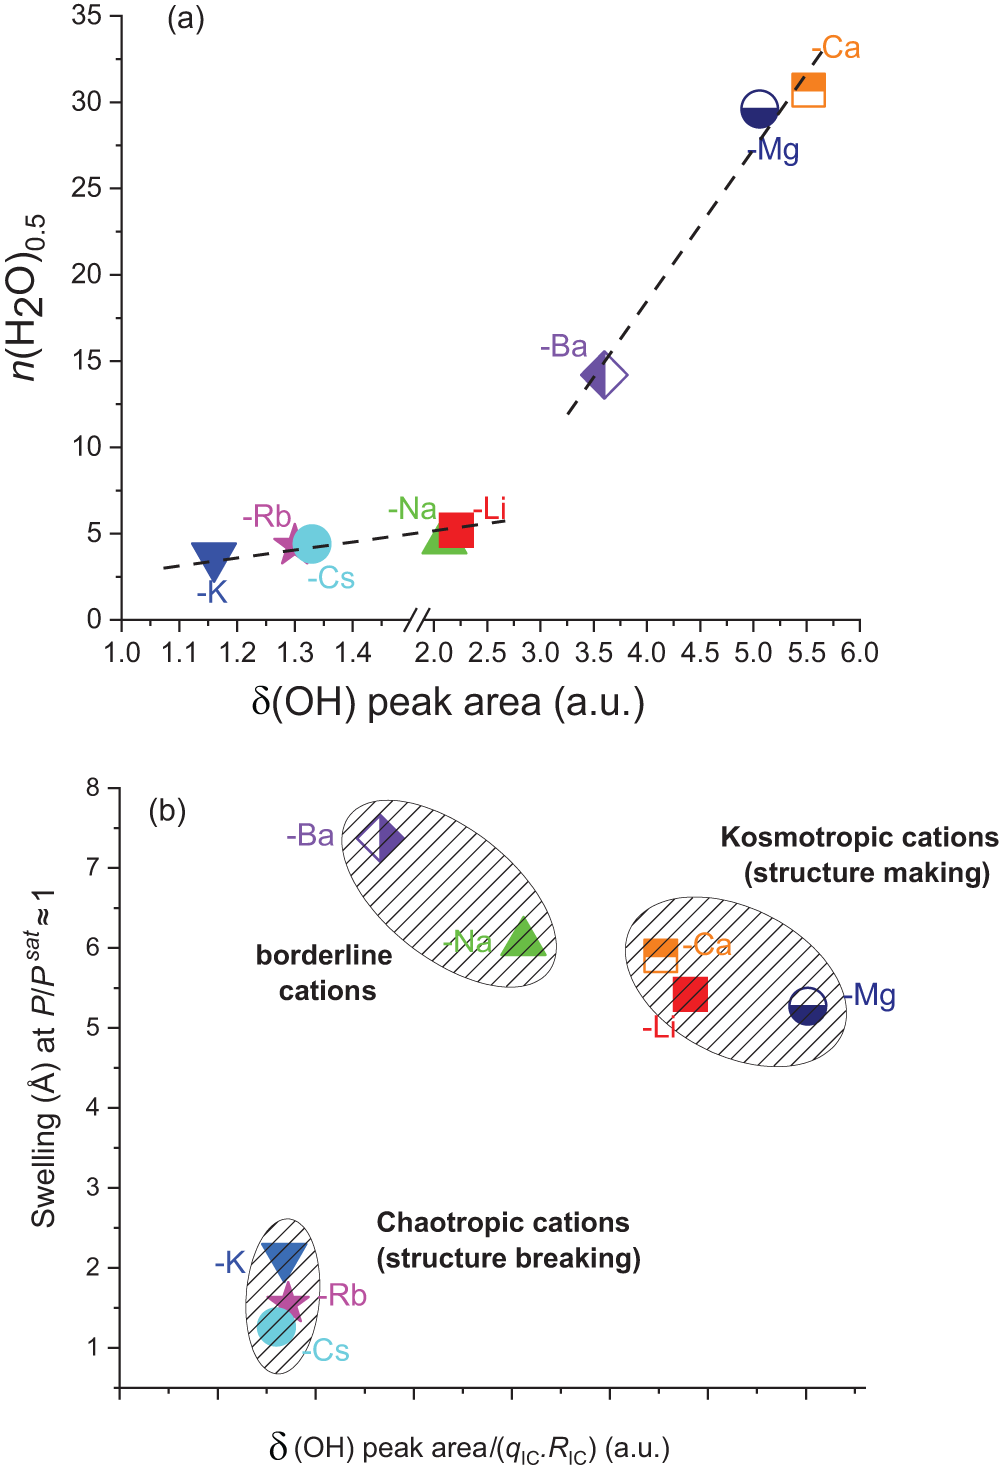
The δ(OH) peak areas in the 1550–1750 cm–1 wavenumber domain of the water molecules adsorbed in the homoionic alkali metal-exchanged montmorillonites studied in this work and in the alkaline-earth-exchanged montmorillonites studied in Belhocine et al. (Reference Belhocine, Haouzi, Bassou, Phou, Maurin, Bantignies and Henn2018) (see Figs 8 & S4). Areas are calculated using a peak-fitting procedure considering two Voigt functions.

Having gathered all of these comprehensive experimental data on these SWy-2 montmorillonite samples exchanged with alkali and alkaline-earth cations, we now aim to investigate whether a specific indicator related to the intrinsic properties of these cations can account for the observed trends. The search for correlations between the sorption features (i.e. the water uptake, the swelling, the isosteric heat and the shape and reversibility of the isotherms) and the IC features (i.e. the electrostatic charge ${\text{ }}{q_{{\text{IC}}}}$, the radius
 ${R_{{\text{IC}}}}$, the electrostatic potential
 ${\raise0.7ex\hbox{${{q_{{{IC}}}}}$} \!\mathord{\left/
{\vphantom {{{\text{ }}{q_{{\text{IC}}}}} {{R_{{\text{IC}}}}}}}\right.}
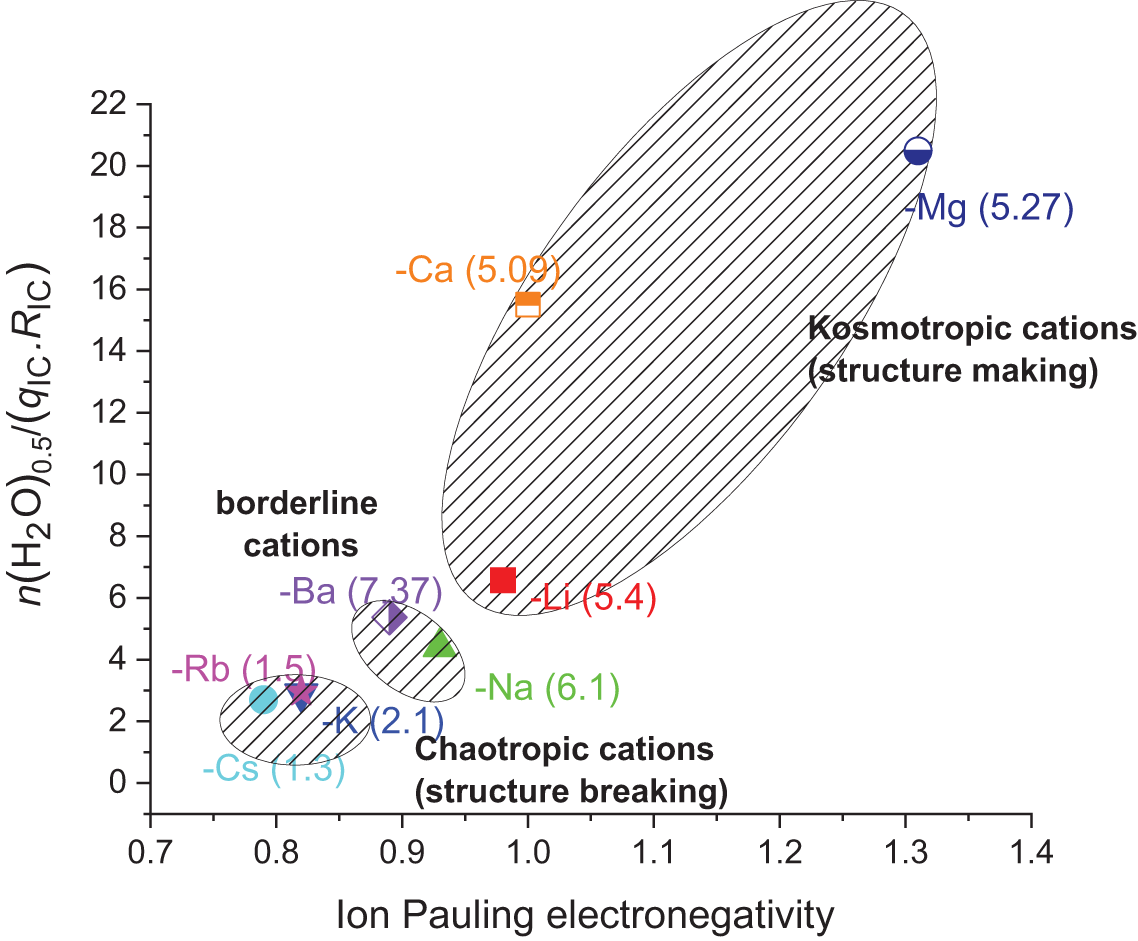
\!\lower0.7ex\hbox{${{R_{{{IC}}}}}$}}$ and the solvation enthalpy) proved wholly unsuccessful. The only factor that we found to be partly consistent is between
 $n{\left( {{H_2}O} \right)_{0.5}}$ divided by the product
 ${\text{ }}{q_{{\text{IC}}}}.{\text{ }}{R_{{\text{IC}}}}$ with the IC electronegativity (Fig. 7). This correlation is interesting because it clearly shows three zones in which ICs can be classified according to their kosmotropic (structure-making) or chaotropic (structure-breaking) character (Marcus, Reference Marcus2009). It is important to note that this correlation aligns well with the swelling behaviour since the kosmotropic cations (i.e. Mg2+, Ca2+ and Li+) show all values between 5.0 and 5.5 Å, borderline cations (i.e. Ba2+ and Na+) show values between 6.0 and 7.5 Å and chaotropic cations (i.e. K+, Rb+ and Cs+) show values between 1.2 and 2.0 Å. However, this correlation does not fully account for the distinct shapes of the water uptake and structural isotherms, particularly the high irreversibility observed in MWy-Na that is not observed in MWy-Ba, even though they appear in the same region of the plot. The same outcome can be applied to MWy-K when it is compared to MWy-Rb and -Cs.
Relationship between IC electronegativity and water uptake upon adsorption. The y-axis represents the ratio of  $n{\left( {{H_2}O} \right)_{0.5}}$, the number of adsorbed water molecules per cation at a partial water pressure of 0.5 and at 25°C divided by the cation’s elementary charge and radius (in angstroms). The x-axis represents the cation’s Pauling electronegativity. The numbers in parentheses represent the swelling (i.e. the difference in d(001) interlayer spacing (in angstroms) between the dehydrated and hydrated states at a partial water pressure of ∼1; see Table 4).

Fourier-transform infrared spectroscopy
The Mid-IR spectra of the alkali-exchanged montmorillonites, measured under primary vacuum, are assembled in Fig. S4 with those reported in our previous work (Belhocine et al., Reference Belhocine, Haouzi, Bassou, Phou, Maurin, Bantignies and Henn2018) on the alkaline-earth samples. The assignment of the main vibrational bands are gathered in Table S1. They correspond to the usual vibrational features of montmorillonite.
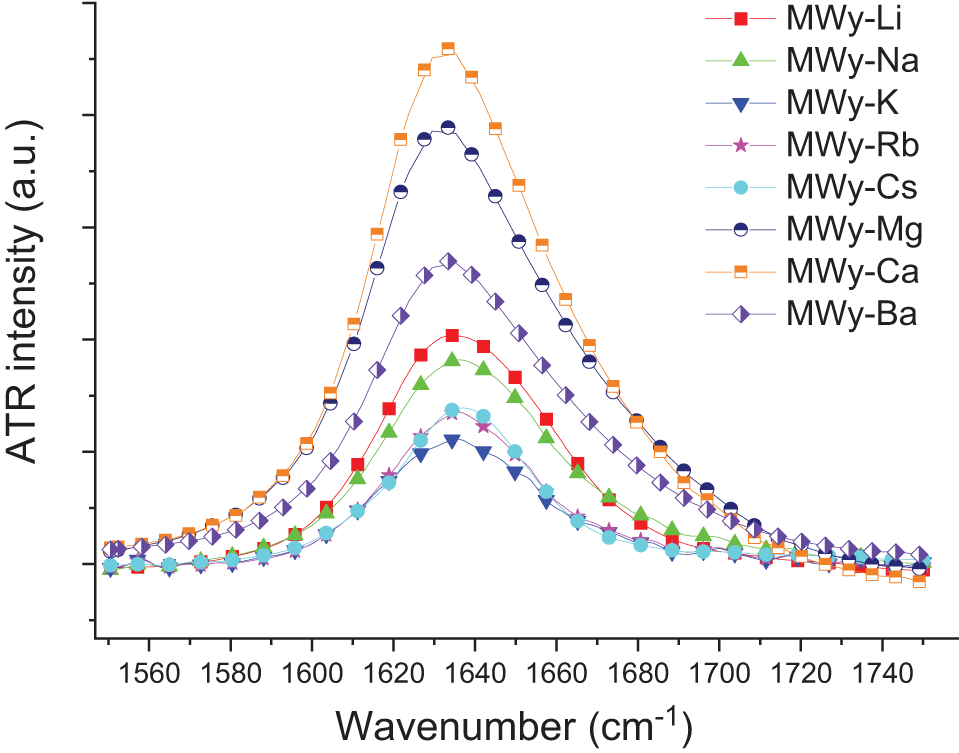
A more detailed analysis of the ν(OH) and δ(OH) bands assigned to water vibrations is proposed. The spectra derived from our previous investigation of montmorillonites exchanged with alkaline-earth ICs are analysed using the same analytical methods applied in the current study of montmorillonites exchanged with alkali metal cations. Firstly, it is worth emphasizing that the area of the δ(OH) band within the 1550–1750 cm–1 range (Fig. 8 & Table 4) shows a strong correlation with  $n{\left( {{H_2}{\text{O}}} \right)_{0.5}}$ when considering alkali and alkaline-earth ICs separately (Fig. 9a). For the alkali ICs, the slope equals ∼1.7, whereas it is ∼8.7 for the alkaline-earth ICs. These trends can be explained by the significant increase of the OH bond polarization, which is, as expected, much larger for the alkaline-earth than for the alkali ICs. The data also show that
 $n{\left( {{H_2}{\text{O}}} \right)_{0.5}}$ does not evolve solely according to the IC polarization impact, as the observed order for both alkali and alkaline-earth cations does not follow the periodic table order (Fig. 9a). The influence of ICs becomes even more evident when plotting the area of the δ(OH) peak normalized by the product
 ${\text{ }}{q_{{\text{IC }}}}.{R_{{\text{IC}}}}$, thereby highlighting again the impact of their chaotropic or kosmotropic nature (Fig. 9b). Therefore, the parameter
 ${q_{{\text{IC }}}}.{R_{{\text{IC}}}}$ appears more relevant than the IC electrostatic potential, hydration enthalpy or chemical hardness (Parr & Pearson, Reference Parr and Pearson1983) for classifying the impact of the IC on both swelling (Fig. 9b) and water uptake (Fig. 7).
Mid-IR spectra in the δ(OH) region for the alkali- and alkaline-earth-exchanged montmorillonites. Intensity is normalized on the maximum intensity of the ν(SiOSi) band at 1048 cm–1 (see Fig. S4). Peak areas are reported in Table 4.

Correlation between the area of the δ(OH) peak (see Figure 8 & Table 4) with (a) the water uptake at 25°C and  ${\raise0.7ex\hbox{$P$} \!\mathord{\left/
{\vphantom {P {{P^{sat}}}}}\right.}
\!\lower0.7ex\hbox{${{P^{sat}}}$}} = 0.5{\text{ }}$and (b) the swelling at
 ${\raise0.7ex\hbox{$P$} \!\mathord{\left/
{\vphantom {P {{P^{sat}}}}}\right.}
\!\lower0.7ex\hbox{${{P^{sat}}}$}} \approx 1{\text{ }}$. The axis break in (a) is for the sake of clarity in the [1–1.5] domain. Dashed lines are present to guide the reader. Part (a) clearly emphasizes the concomitant effect of the ICs on the water uptake along with OH bond polarization. Part (b) provides insights into the impacts of the kosmotropic (structure-making) and chaotropic (structure-breaking) features of the IC on the presence of water and swelling, and it also highlights the distinctive impact of the so-called ‘borderline’ cations (i.e. Na+ and Ba2+).

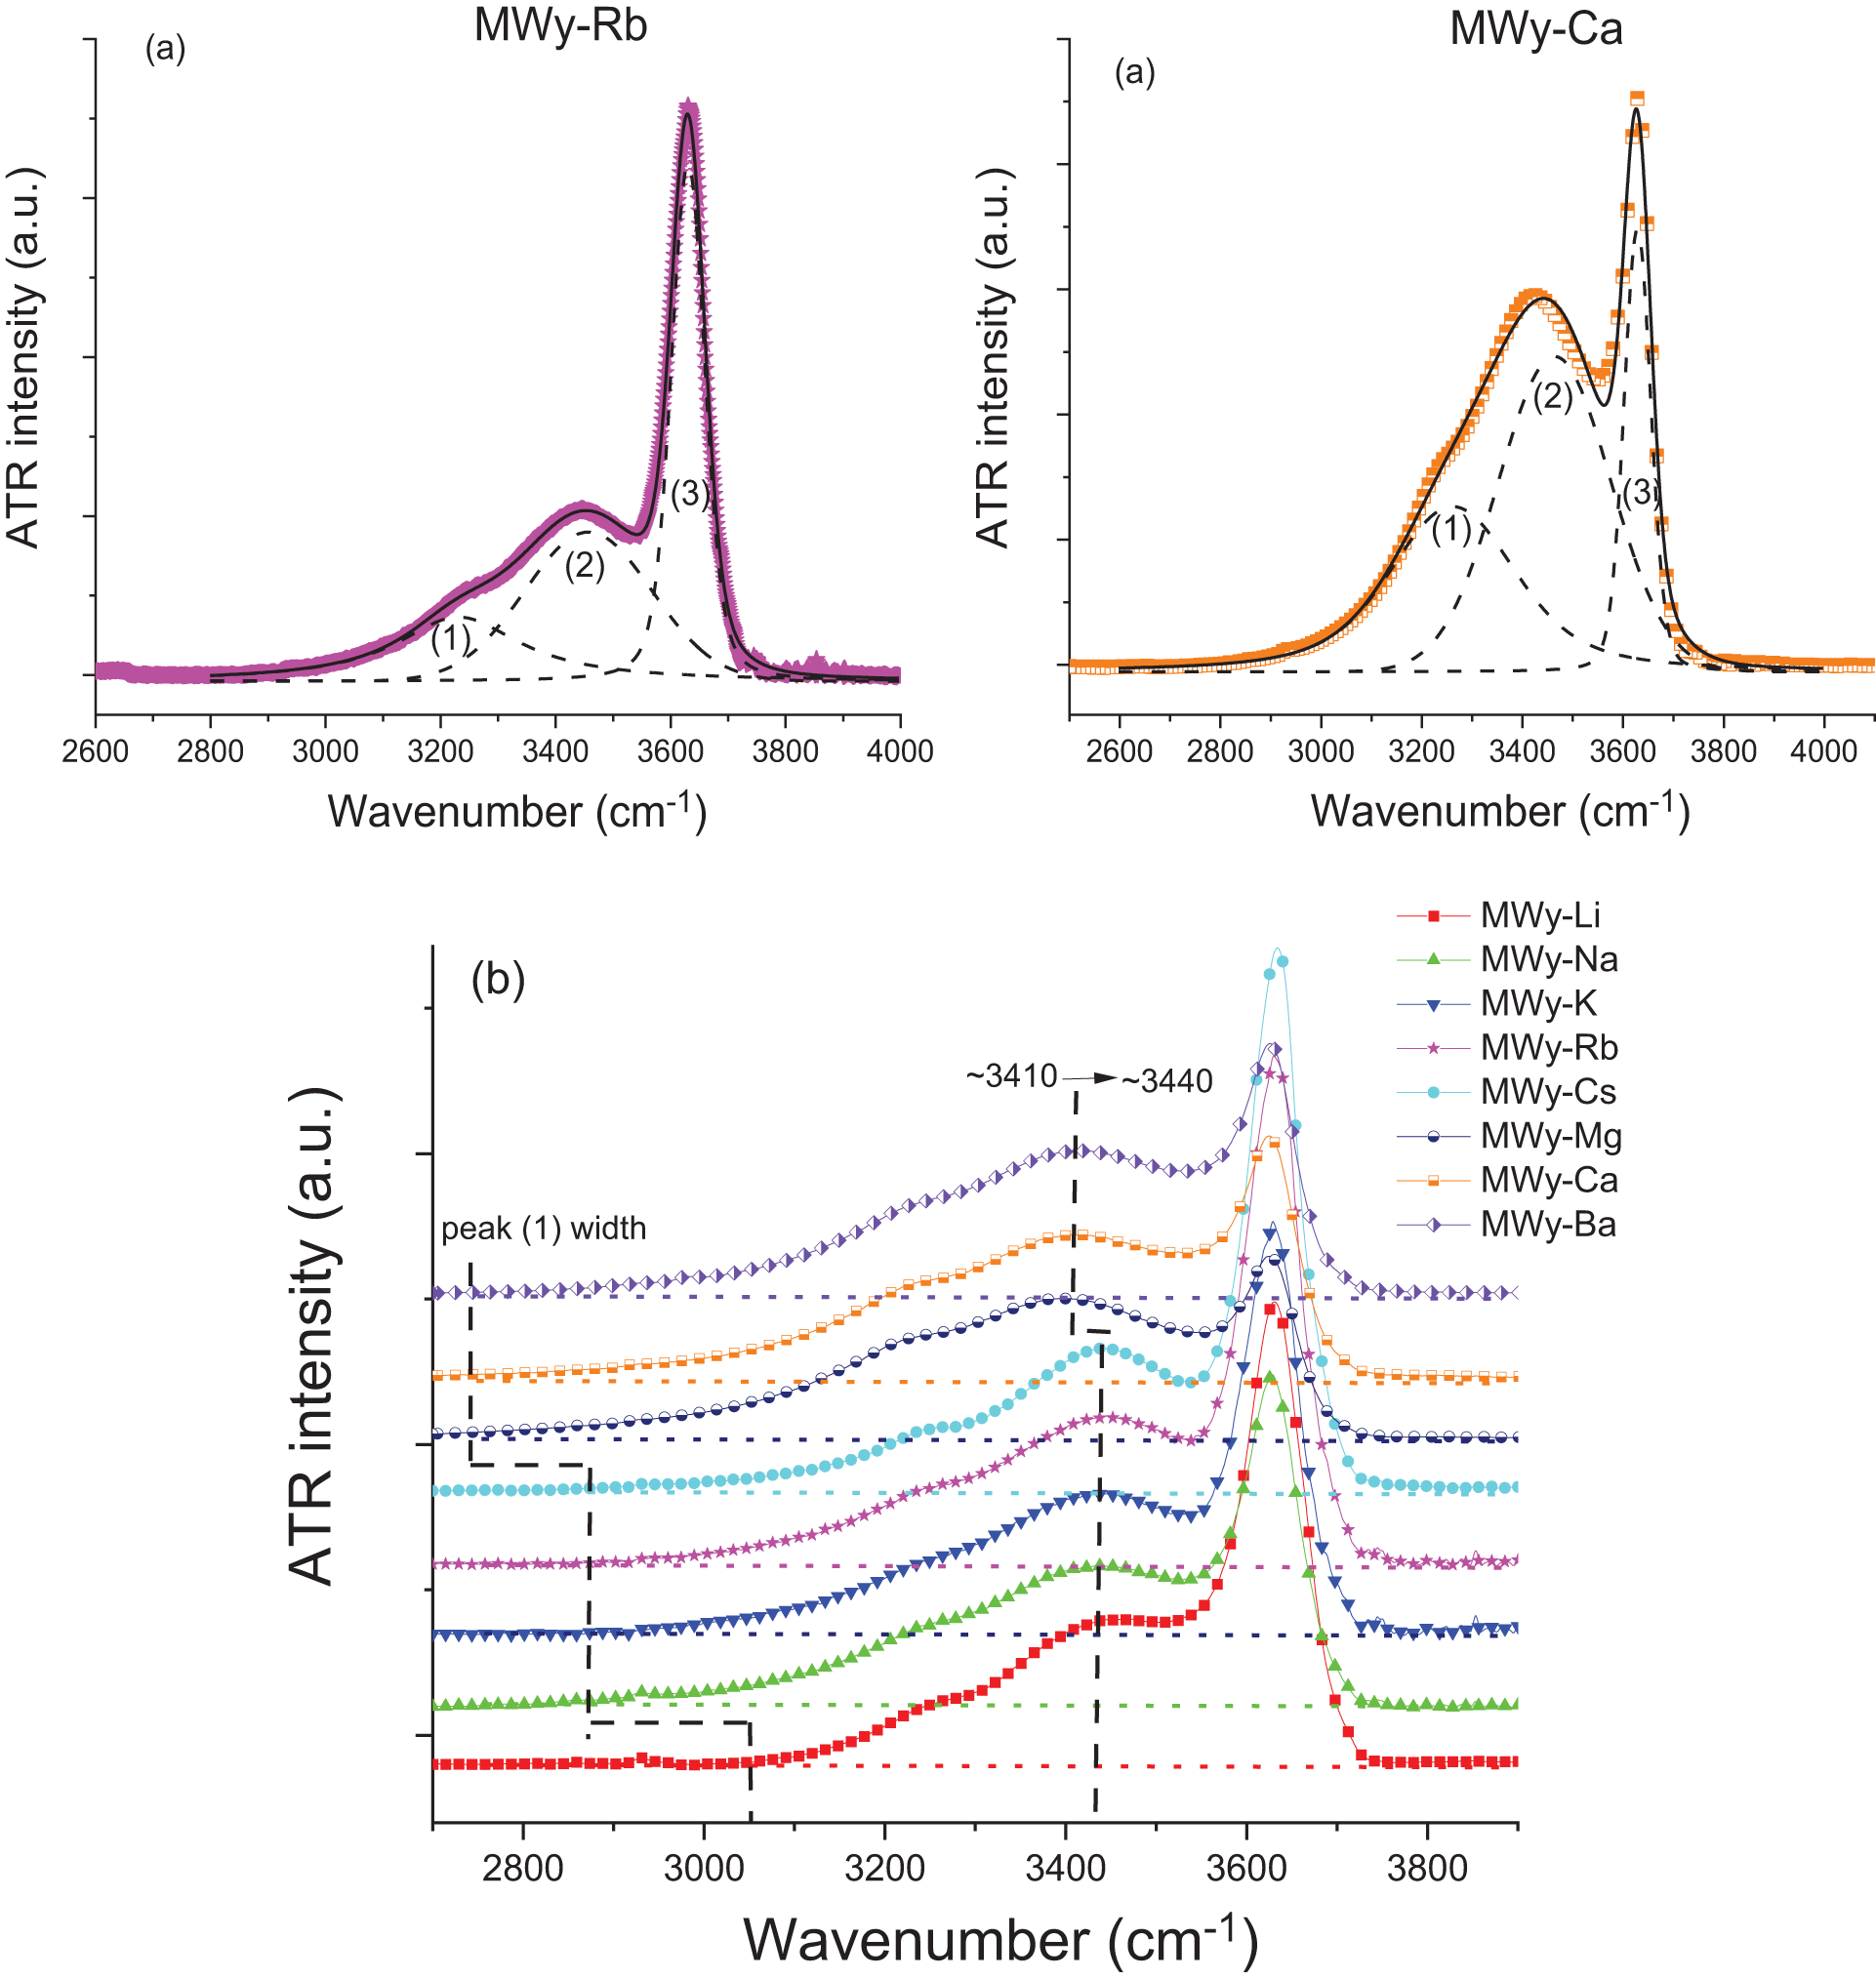
On the other hand, more information about the nature of the adsorbed water is gained from the ν(OH) broad band of water molecules in the 2500–4000 cm–1 domain. First, one can notice that this band is markedly more intense for the alkaline-earth ICs than for the alkali ICs (Fig. S4), probably due to their greater water uptake. However, a closer look at the intensities and total band areas shows no correlation with thermodynamic data and the δ(OH) band. The origin of this result is currently unclear. In addition, a closer examination of the structure of the ν(OH) signal shows that it can be decomposed in three contributions: (1) ‘ice-like’ water (i.e. frozen), (2) ‘liquid-like’ water (i.e. labile) and (3) O–H bonds of the montmorillonite network (Bernardina et al., Reference Bernardina, Paineau, Brubach, Judeinstein, Rouzière, Launois and Roy2016). Fits obtained in the cases of the MWy-Rb and -Ca samples are given as typical examples (Fig. 10a). A detailed analysis of these contributions remains inconclusive and shows no clear correlation between the areas of peaks (1) and (2),  $n{\left( {{H_2}{\text{O}}} \right)_{0.5}}$, the swelling and the nature of the IC. However, a clear trend with the IC can be observed on the evolution of the peak (2) position, as well as on the broadening of peak (1) (Fig. 10b). The alkaline-earth ICs induce a significant red shift of ∼30 cm–1 of peak (2), which can be ascribed to the strong polarization effect on the OH bond due to the ionic potential of the IC. A similar shift might be expected for peak (1); however, due to its poorly defined shape, it would be speculative to claim that such could be clearly identified. The second impact of the alkaline-earth ICs on the ν(OH) band is the broadening of peak (1) compared to that of the alkali ICs. The behaviour of this peak, linked to ‘frozen’ water, may reflect the greater number of ‘frozen’ water molecules in the IC coordination sphere influenced by the ionic potential of the IC, leading to more diverse interactions and hence a broader vibration band.
Mid-IR spectra in the (OH) region for the alkali- and alkaline-earth-exchanged montmorillonites: (a) peak fitting analysis for the Rb- and Ca-exchanged montmorillonites given as typical examples and (b) comparison of the peak position and shape providing that, for the sake of clarity, spectra have been normalized to the maximum of the (OH) peak (see Figure 8). Part (a) shows that this vibrational region can be decomposed into three components: (1) ‘ice-like’ water stretching vibrations of water molecules that are hydrogen-bonded in a similar manner to ice; (2) ‘liquid-like’ water stretching vibrations of water molecules less attached to the network, resembling liquid water; and (3) stretching vibrations of hydroxyl groups within the clay mineral framework. Part (b) highlights the frequency shift of the ‘liquid-like’ peak and the broadening of the ‘ice-like’ peak.

Conclusion
The findings of this study clearly confirm that ICs play a crucial role in determining the water uptake, swelling and sorption thermodynamics behaviours of our alkali- and alkaline-earth-exchanged SWy-2 montmorillonites. The impact of the IC on sample hydration cannot be fully accounted for by basic IC features such as charge, ionic radius, ionic potential or hydration enthalpy. Instead, this study highlights the importance of the chaotropic/kosmotropic character of the ICs for swelling and water uptake as follows:
(1) Kosmotropic cations (e.g. Li+, Mg2+, Ca2+) promote strong hydration and swelling.
(2) Chaotropic cations (e.g. K+, Rb+, Cs+) inhibit swelling.
(3) Borderline cations (e.g. Na+, Ba2+) involve mixed behaviour, with intermediate hydration and high swelling, and therefore they are not fully aligned with either of the former groups.
Among the tested descriptors, the product of the IC charge and radius (i.e.  ${\text{ }}{q_{{\text{IC }}}}.{R_{IC}}$) emerges as the most consistent parameter correlating with water uptake, swelling and Mid-IR δ(OH) peak intensity, offering a more nuanced understanding than the (traditional) ionic potential. However, analysis of the uptake isotherm and the sorption isosteric heat profiles reveals that the balance between cation solvation and TOT layer attraction gives rise to two distinct sorption mechanisms:
(1) In cases in which one force clearly dominates, either cation solvation (e.g. Li+, Mg2+, Ca2+, Ba2+) or TOT attraction (e.g. Cs+), the result is a type II reversible isotherm, and the sorption mechanism is likely to proceed directly via IC solvation.
(2) When solvation and TOT attraction are more evenly matched (e.g. Na+, K+ and Rb+), the competition between these forces leads to less well-defined isotherms and more complex sorption behaviour, probably involving cation solvation within microporous regions of the montmorillonite during the early stage of hydration.
These insights support a complex view of montmorillonite hydration in which specific ion effects akin to those described in the Hofmeister series play a critical role (Gregory et al., Reference Gregory, Elliott, Robertson, Kumar, Wanless and Webber2022). This work thus contributes to a deeper understanding of the mechanisms underlying water–montmorillonite interactions and may inform future studies and applications.
Supplementary material
The supplementary material for this article can be found at https://doi.org/10.1180/clm.2025.10012.
Acknowledgements
The infrared investigation was performed on the IR-RAMAN platform of the University of Montpellier.
Financial support
The authors are grateful to the French and Algerian Ministries for Foreign Affairs for their financial support via the CMEP/PHC Tassili programme and the PRFU research project.
Competing interests
The authors declare none.