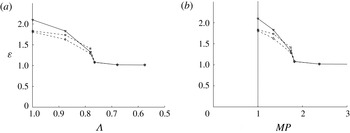
1 Introduction
Vortex interactions are an important and often dominant aspect of many fundamental and practical flows. In the case of decaying two-dimensional turbulence, the interaction of two like-signed vortices is considered to be a driving mechanism for the inverse energy cascade, producing larger scales through the merging of two vortices, and breaking down smaller, weaker vortices (McWilliams Reference McWilliams1990; Tabeling Reference Tabeling2002). This has led to the development of models and scaling laws for two-dimensional turbulence that employ simplified descriptions of vortex merger, typically based on the highly idealized case of inviscid symmetric merger (Carnevale et al. Reference Carnevale, McWilliams, Pomeau, Weiss and Young1991; Riccardi, Piva & Benzi Reference Riccardi, Piva and Benzi1995; Sire, Chavanis & Sopik Reference Sire, Chavanis and Sopik2011). In order to improve such models, and more generally to better understand two-dimensional vortex interactions, more accurate characterizations of these vortex interactions and their outcomes are needed.
Most fundamental studies of interacting co-rotating vortices (see, e.g. Brandt & Nomura (Reference Brandt and Nomura2010) for a review) consider inviscid flow and symmetric vortex pairs, wherein the two vortices are equal in size and strength. These studies indicate that two equal vortices will merge when they are separated within a critical distance, i.e. if
 $b/a\leqslant (b/a)_{cr}$
, where
 $b$
is the linear distance between vorticity peaks and
 $a$
is the vortex radius (e.g. Saffman & Szeto Reference Saffman and Szeto1980; Overman II & Zabusky Reference Overman and Zabusky1982). Vortices separated beyond this critical value revolve about each other and the two vortices persist in time: at intermediate distances, the vortices deform each other and exchange vorticity while at large distances they do not interact significantly. These three regimes (merger, exchange, no significant interaction) are well characterized by the initial
 $b/a$
and
 $(b/a)_{cr}$
(Waugh Reference Waugh1992). For the case of Rankine (uniform vorticity) vortices, a merging efficiency,
 $$\begin{eqnarray}\displaystyle H=\unicode[STIX]{x1D6E4}_{tot,f}/\unicode[STIX]{x1D6E4}_{tot,0}, & & \displaystyle\end{eqnarray}$$
which compares the total circulation of the final vortex,
 $\unicode[STIX]{x1D6E4}_{tot,f}$
, to the combined total circulation of the original two vortices,
 $\unicode[STIX]{x1D6E4}_{tot,0}$
, was evaluated by Waugh (Reference Waugh1992). Results indicate that the resulting compound vortex may have less circulation than the total of the original vortices due to the ejection of vorticity from the cores in the form of filaments during the merging process.
Inviscid interactions between two unequal vortices, i.e. an asymmetric pair, are found to produce more varied outcomes (e.g. Dritschel & Waugh Reference Dritschel and Waugh1992; Yasuda & Flierl Reference Yasuda and Flierl1997; Trieling, Velasco Fuentes & van Heijst Reference Trieling, Velasco Fuentes and van Heijst2005). Dritschel & Waugh (Reference Dritschel and Waugh1992) considered a pair of Rankine vortices with equal vorticity and unequal areas. They found that within some separation distance, which varied with the asymmetry of the pair, one vortex ejects a filament of vorticity which then may or may not be incorporated into the other. Interactions could then be divided into five regimes based on the values of the enhancement factor for each vortex
 $i=1,2$
,
 $$\begin{eqnarray}\displaystyle \unicode[STIX]{x1D716}_{i}=\unicode[STIX]{x1D6E4}_{i,f}/\unicode[STIX]{x1D6E4}_{i,0}, & & \displaystyle\end{eqnarray}$$
which compares the final circulation of each vortex to its circulation at the start of interaction. Outcomes with the initially larger vortex unchanged
 $\unicode[STIX]{x1D716}_{1}=1$
and the smaller vortex reduced
 $\unicode[STIX]{x1D716}_{2}<1$
correspond to partial or complete straining-out regimes, the latter with
 $\unicode[STIX]{x1D716}_{2}=0$
(i.e. only one vortex survives). Outcomes with the initially larger vortex enhanced, i.e.
 $\unicode[STIX]{x1D716}_{1}>1$
, and the smaller vortex reduced
 $\unicode[STIX]{x1D716}_{2}<1$
correspond to partial or complete merger regimes, the latter having
 $\unicode[STIX]{x1D716}_{2}=0$
(i.e. only one vortex survives). An elastic interaction regime is then associated with the limiting case in which
 $\unicode[STIX]{x1D716}_{1}=1$
and
 $\unicode[STIX]{x1D716}_{2}=1$
. Results from contour surgery simulations were presented on a regime diagram as a function of the ratio of initial vortex radii
 $a_{2}/a_{1}$
and non-dimensional separation distance
 $b/a_{1}$
and showed complicated dependencies on these parameters. Although this study suggests that only the initially stronger vortex can be enhanced, in general the weaker vortex could instead be the enhanced final vortex, i.e. be the ‘winner’ of the interaction (Melander, Zabusky & McWilliams Reference Melander, Zabusky and McWilliams1987b
). The exact conditions for this to occur are not yet entirely clear. Trieling et al. (Reference Trieling, Velasco Fuentes and van Heijst2005) consider various vorticity distributions, including a Gaussian profile, and asymmetric vortex pairs with equal-vorticity/unequal-area and equal-area/unequal-vorticity combinations. Regime maps comparable to those of Dritschel and Waugh (indicating the five regimes) were presented and again complex dependencies on the parameters considered (radii ratio, peak vorticity ratio and initial separation distance) were exhibited, and were found to also depend on the vorticity distribution. Although enhancement factors were evaluated, the flow regimes in this study were ultimately identified by visual inspection due to ambiguities in these quantities when the two vortices exchange fluid to negligible net effect.
In viscous flow, diffusion causes the vortices to grow in time, so
 $b/a$
will thereby inevitably be reduced below
 $(b/a)_{cr}$
. The interaction of two equal vortices thus always results in merger (Melander, Zabusky & McWilliams Reference Melander, Zabusky and McWilliams1988). Distinct flow regimes occur in the time development of the vortex pair (Melander et al.
Reference Melander, Zabusky and McWilliams1988; Le Dizès & Verga Reference Le Dizès and Verga2002; Meunier et al.
Reference Meunier, Ehrenstein, Leweke and Rossi2002; Cerretelli & Williamson Reference Cerretelli and Williamson2003; Brandt & Nomura Reference Brandt and Nomura2007). In the first (diffusive) phase of development, when
 $b/a$
is sufficiently large, the flow is dominated by the viscous growth of the vortices. During this time, each vortex responds to the strain field induced by the other, which elliptically deforms the vortices. In the second (convective) phase of development, the induced strain and deformation leads to the detrainment of core vorticity. The detrained fluid is circulated (exchanged) between vortices and the weakened cores eventually undergo mutual entrainment. These processes result in the primary motion of the vortices towards each other (Huang Reference Huang2005; Brandt & Nomura Reference Brandt and Nomura2007). The onset of merger (
 $(b/a)_{cr}$
) is considered to correspond to the start of the convective phase (Meunier et al.
Reference Meunier, Ehrenstein, Leweke and Rossi2002). A third (second diffusive) phase consists of the eventual elimination of the two vorticity peaks of the merged structure, which occurs on a diffusive time scale (Meunier et al.
Reference Meunier, Ehrenstein, Leweke and Rossi2002; Cerretelli & Williamson Reference Cerretelli and Williamson2003), followed by axisymmetrization of the final structure (Melander, McWilliams & Zabusky Reference Melander, McWilliams and Zabusky1987a
).
Viscous interactions between two unequal vortices also ultimately result in a single vortex, although the vortex may not be enhanced, as in the inviscid flow straining-out regimes. A detailed study of the associated physics was carried out by Brandt & Nomura (Reference Brandt and Nomura2010) using numerical simulations. Three interactions were considered to occur: complete merger, partial merger and straining out. Here, although the inviscid flow regime terminology is used, the definitions of each are given in terms of the relative timing of core detrainment and core destruction. A critical strain rate parameter, corresponding to the establishment of core detrainment, was defined and determined for each vortex. The onset of merger was then considered to be the achievement of the critical strain rate parameter by both vortices. In the case of symmetric merger, the critical strain rate parameter was shown to be related to
 $(b/a)_{cr}$
. Although the developed merging criterion and flow classification provide physical insight and allow for a more generalized characterization of the vortex interactions, it is not clear how it can be used in a practical manner. In particular, the classifications depend on the relative timing of the vortex detrainment and destruction processes, and the strain rate parameter is defined in the co-rotating frame. It is also noted that in this study, verification of merger and the extent of entrainment were determined by visual inspection rather than a more objective and quantitative means. Jing, Kanso & Newton (Reference Jing, Kanso and Newton2012) also examined the viscous interaction of an asymmetric pair (along with a symmetric pair) using a low-dimensional core growth model and identified a sequence of topological bifurcations in the instantaneous streamline patterns as the flow evolves into a single Gaussian vortex, although notably their model did not include an entrainment process. To the authors’ knowledge, no quantitative assessment of the interactions have been performed for either symmetric or asymmetric pairs in viscous flows, likely due to difficulties associated with the continuous development, both in space and time, inherent to these flows.
The present study seeks to extend the
 $\unicode[STIX]{x1D716}$
-type framework of Dritschel & Waugh (Reference Dritschel and Waugh1992) to viscous flow, and to use these metrics to quantitatively assess for the first time co-rotating viscous vortex pair interactions. Two-dimensional numerical simulations are performed for a wide range of initial asymmetries including both unequal size and unequal peak vorticity, allowing for more possible outcomes and enabling a more general characterization of these flows. A procedure is developed which allows the vortex cores and associated properties to be monitored in time, thereby enabling the identification of the times of start (
 $t_{start}^{\ast }$
) and end (
 $t_{end}^{\ast }$
) of the primary (convective) interaction. Values of an appropriately defined enhancement factor,
 $\unicode[STIX]{x1D700}$
, and merging efficiency,
 $\unicode[STIX]{x1D702}$
, are then evaluated and used to objectively assess each interaction. Since these viscous interactions all result in a single vortex, there are two general outcomes: enhancement (merger) and no enhancement (straining out). A new parameter, which measures the degree of mutuality of the interaction, is defined based on the relative straining of each vortex. It is found to effectively characterize
 $\unicode[STIX]{x1D700}$
and
 $\unicode[STIX]{x1D702}$
of the post-interaction vortex for the range of parameters considered and observed interaction regimes. Results are compared with available experimental data of Meunier (Reference Meunier2001).
The flow parameters and numerical simulations are described in § 2. The basic time development of the flows and the associated physical processes are first reviewed in § 3. The procedure for the quantitative assessment is then developed in § 4. Results are presented in § 5. The new parametrization is described in § 6. This is followed by comparisons with the lower Reynolds number simulations and experimental results in § 7. Summary and conclusions are given in § 8 along with some implications for two-dimensional turbulence.
2 Flow set-up and parameters
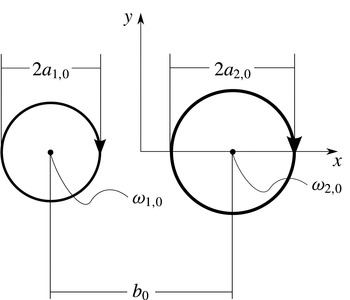
The two-dimensional flow initially consists of two Gaussian vortices
 $i=1,2$
, separated by a distance
 $b_{0}$
(figure 1). Each vortex has an initial circulation
 $\unicode[STIX]{x1D6E4}_{i,0}=\unicode[STIX]{x03C0}a_{i,0}^{2}\unicode[STIX]{x1D714}_{i,0}$
, where
 $a_{i,0}$
is the initial vortex radius and
 $\unicode[STIX]{x1D714}_{i,0}$
is the initial peak vorticity, giving an initial aspect ratio
 $a_{2,0}/b_{0}$
and circulation ratio
 $\unicode[STIX]{x1D6EC}_{0}=\unicode[STIX]{x1D6E4}_{1,0}/\unicode[STIX]{x1D6E4}_{2,0}\leqslant 1$
. The simulations cover three subcategories of asymmetric pairs: those having unequal vorticity peaks but equal areas (UPEA:
 $\unicode[STIX]{x1D6EC}_{0}=\unicode[STIX]{x1D714}_{1,0}/\unicode[STIX]{x1D714}_{2,0}<1$
), those having equal peaks but unequal areas (EPUA:
 $\unicode[STIX]{x1D6EC}_{0}=a_{1,0}^{2}/a_{2,0}^{2}<1$
) and those having both unequal peaks and unequal areas (UPUA:
 $\unicode[STIX]{x1D6EC}_{0}=a_{1,0}^{2}\unicode[STIX]{x1D714}_{1,0}/a_{2,0}^{2}\unicode[STIX]{x1D714}_{2,0}<1$
), as well as the limiting case of a symmetric pair (
 $\unicode[STIX]{x1D6EC}_{0}=a_{1,0}^{2}/a_{2,0}^{2}=\unicode[STIX]{x1D714}_{1,0}/\unicode[STIX]{x1D714}_{2,0}=1.0$
). The circulation Reynolds number,
 $Re_{\unicode[STIX]{x1D6E4}}=\unicode[STIX]{x1D6E4}_{2,0}/\unicode[STIX]{x1D708}=5000$
, is based on the stronger vortex. Additional UPEA simulations are performed with
 $Re_{\unicode[STIX]{x1D6E4}}=1000$
in order to compare with the experimental data. All simulations are performed with
 $a_{2,0}/b_{0}=0.157$
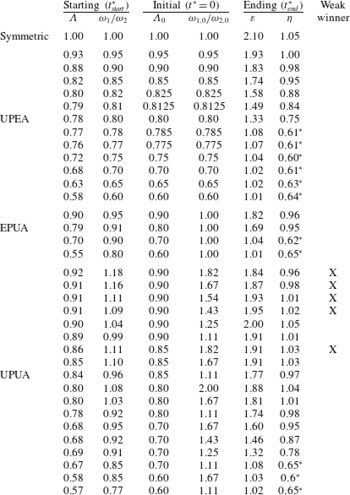
. This value satisfies computational requirements (see Brandt & Nomura Reference Brandt and Nomura2007) and is comparable to those in the experiments. The simulations performed are summarized in tables 1 and 2. All times are given in terms of a convective time scale based on the period of revolution of two point vortices
 $T=2\unicode[STIX]{x03C0}^{2}b_{0}^{2}/(0.5\unicode[STIX]{x1D6E4}_{2,0}(1+\unicode[STIX]{x1D6EC}_{0}))$
,
 $t^{\ast }=t/T$
.
The initial condition consisting of two Gaussian vortices
 $i=1,2$
each having initial radius
 $a_{i,0}$
, peak vorticity
 $\unicode[STIX]{x1D714}_{i,0}$
, separated by peak–peak distance
 $b_{0}$
. Initial aspect ratio
 $a_{2,0}/b_{0}=0.157$
and circulation ratio
 $\unicode[STIX]{x1D6EC}_{0}=\unicode[STIX]{x1D6E4}_{1,0}/\unicode[STIX]{x1D6E4}_{2,0}\leqslant 1$
.

Summary of simulation parameters and results for
 $Re_{\unicode[STIX]{x1D6E4}}=5000$
. Values for
 $\unicode[STIX]{x1D700}$
and
 $\unicode[STIX]{x1D702}$
are evaluated at
 $t_{end}^{\ast }$
. Starting
 $\unicode[STIX]{x1D6EC}=\unicode[STIX]{x1D6E4}_{1}/\unicode[STIX]{x1D6E4}_{2}$
is evaluated at
 $t_{start}^{\ast }$
. See § 4 for details and definitions of
 $t_{start}^{\ast }$
and
 $t_{end}^{\ast }$
.
 $\ast$
indicates that the straining-out regime has been reached and
 $\unicode[STIX]{x1D702}$
is therefore not a meaningful physical quantity. ‘Weak winner’ indicates that the peak of the weaker initial vortex becomes the peak of the resulting post-interaction vortex (see § 5).

The flow is incompressible and is integrated in time using finite-difference schemes on a uniform grid with periodic boundary conditions (see Gerz, Schumann & Elghobashi Reference Gerz, Schumann and Elghobashi1989; Orlandi Reference Orlandi2000). The domain consists of
 $2048^{2}$
points with side lengths of
 $L_{x}=L_{z}=24b_{0}$
, giving approximately 27 points across the larger core. Resolution and domain size testing on both local and integrated quantities showed these values to be sufficient; for further discussion see Brandt & Nomura (Reference Brandt and Nomura2007).
3 Basic flow behaviour
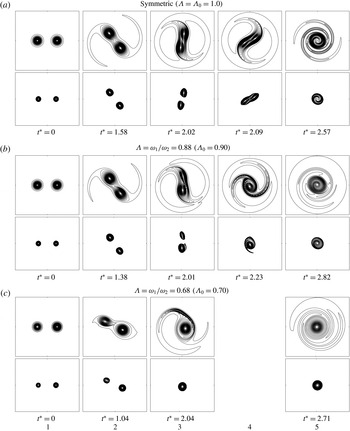
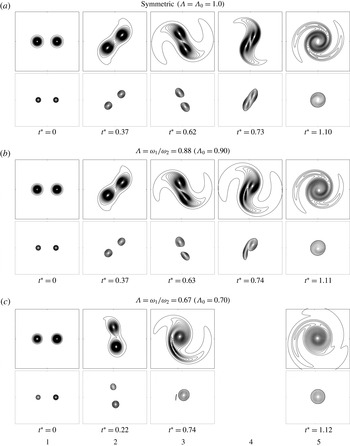
The flow development of three illustrative cases, a symmetric and two UPEA asymmetric pairs (
 $\unicode[STIX]{x1D6EC}_{0}=1.0,0.90,0.70$
), is presented in figure 2, with vorticity contour plots given in each of the upper rows of figure 2(a–c). Although only UPEA asymmetric pairs are shown, these cases depict the key processes involved in all interactions, which were investigated in detail by Brandt & Nomura (Reference Brandt and Nomura2007, Reference Brandt and Nomura2010). Here, we review these processes and consider further details in order to facilitate the current analysis.
Vorticity contours at the initial condition and key times during the interaction for (a) symmetric (
 $\unicode[STIX]{x1D6EC}=\unicode[STIX]{x1D6EC}_{0}=1.0$
) and UPEA (b)
 $\unicode[STIX]{x1D6EC}=0.88$
(
 $\unicode[STIX]{x1D6EC}_{0}=0.90$
) and (c)
 $\unicode[STIX]{x1D6EC}=0.68$
(
 $\unicode[STIX]{x1D6EC}_{0}=0.70$
) cases at
 $Re_{\unicode[STIX]{x1D6E4}}=5000$
. For each case, the upper row depicts the vorticity contours of the total flow and the lower row depicts the vorticity contours within the region considered ‘core’ using
 $II>II_{t}$
. Column 1: initial condition; column 2:
 $t^{\ast }=t_{start}^{\ast }$
; column 3:
 $t^{\ast }=t_{det}^{\ast }$
; column 4:
 $t^{\ast }=t_{ent}^{\ast }$
(omitted for
 $\unicode[STIX]{x1D6EC}=0.68$
since no entrainment process occurs); column 5: axisymmetrization. See § 4 for details and definitions of
 $t_{start}^{\ast }$
,
 $t_{det}^{\ast }$
and
 $t_{ent}^{\ast }$
.

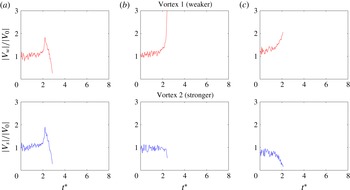
Time development of the normalized translational speed
 $|V|/|V_{0}|$
of each of the vorticity peaks, based on the initial translational speed of each vortex
 $V_{0}$
, for the cases depicted in figure 2. (a)
 $\unicode[STIX]{x1D6EC}=\unicode[STIX]{x1D6EC}_{0}=1.0$
, (b)
 $\unicode[STIX]{x1D6EC}=0.88\;(\unicode[STIX]{x1D6EC}_{0}=0.90)$
, (c)
 $\unicode[STIX]{x1D6EC}=0.68\;(\unicode[STIX]{x1D6EC}_{0}=0.70)$
.

Trajectories of vortex peaks for the cases depicted in figure 2. Red
 $\times$
: vortex 1 (weaker), blue ○: vortex 2 (stronger). Initial positions indicated by filled square and circle respectively. Plotted data points correspond to intervals of approximately 200 time steps.

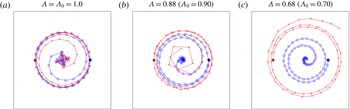
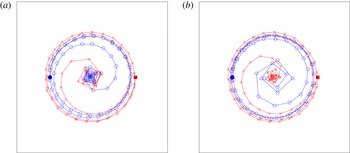
The mutually induced flow of the two vortices initially causes the vortices to revolve about each other with a nearly constant rotation rate (
 ${\approx}2\unicode[STIX]{x03C0}/T$
) and separation. These features are indicated in figure 3, which shows the translational speed of the vorticity peak of each vortex, and figure 4, which shows the trajectories of the vorticity peaks, for each of the cases shown in figure 2. The flow begins in a diffusive phase in which the flow evolves from the initial condition (column 1 of figure 2) primarily by viscous spreading of each vortex, which increases core size. The vortices also deform elliptically in response to the induced strain field of the other vortex. In the co-rotating frame, in the vicinity of the hyperbolic points where the vorticity magnitude is low, a tilt in the vorticity contours with respect to the streamlines develops (Brandt & Nomura Reference Brandt and Nomura2006). This results in filamentation at the outer ends of the vortex pair. At the central (hyperbolic) point, the tilt results in detrainment of core vorticity which is circulated and exchanged between the vortices. It is the establishment of this core detrainment process that is the predominant cause of the change from diffusion-dominated to convective-dominated behaviour, and is considered to be the beginning of the primary convective interaction.
In the symmetric pair (figure 2 a), the detrainment process is reciprocal and both vortices are detrained at the same rate (figure 2 a, columns 2–3). This weakens the vortex cores and at some point, they become mutually entrained (figure 2 a, columns 3–4) which corresponds to a rapid movement of the cores towards each other (figure 3 a). The original vortices are destroyed as they intertwine (figure 4 a) and the flow is transformed into a single compound structure (figure 2 a, column 4), which continues to axisymmetrize (figure 2 a, column 5).
In the asymmetric pairs (figure 2
b,c), the greater induced strain rate at the weaker vortex results in earlier deformation and detrainment (figure 2
b,c, columns 2–3). As the disparity of the vortices increases, more significant detrainment and even destruction of the weaker vortex may occur before detrainment can be established at the stronger vortex. The implication is that either a mutual but unequal entrainment process occurs (
 $\unicode[STIX]{x1D6EC}_{0}=0.90$
, figure 2
b, columns 3–4) or no entrainment occurs (
 $\unicode[STIX]{x1D6EC}_{0}=0.70$
, figure 2
c, column 3). In the former case, there is some intertwinement (figure 4
b) with only the weaker vortex destroyed. The stronger vortex entrains vorticity from the weaker vortex thereby yielding a compound vortex. In the latter case, there is no apparent interpenetration of vorticity from the original vortices (figure 4
c); the weaker vortex is destroyed while the stronger vortex remains, surrounded by vorticity from the weaker vortex.
The entrainment mechanism can be understood by considering the influence that each vortex exerts on the other. Huang (Reference Huang2005) elucidated this in a Lagrangian study of symmetric merger which showed that the vorticity that is detrained from one core and advected around the companion core, induces motion of the companion core towards it. In the symmetric case, since the cores are equal, the process is reciprocal and results in the rapid motion of the vorticity peaks towards each other as they are mutually entrained, as observed in figures 3(a) and 4(a) (
 $\unicode[STIX]{x1D6EC}_{0}=1.0$
). In the asymmetric case, as discussed in Brandt & Nomura (Reference Brandt and Nomura2010), the outcome depends on the relative time scales of each core’s detrainment and destruction. Consider two vortices 1 and 2 with
 $\unicode[STIX]{x1D6E4}_{1}/\unicode[STIX]{x1D6E4}_{2}<1$
. If vortex 1 is moderately weaker than vortex 2, although vortex 2 will detrain vortex 1 more quickly, vortex 1 will still detrain vortex 2, and the associated detrained vorticity will advect it inwards towards vortex 2. Since both vortices detrain, subsequently a mutual but non-reciprocal entrainment process will occur. This is observed in figures 3(b) and 4(b) (
 $\unicode[STIX]{x1D6EC}_{0}=0.9$
) which show vortex 1 accelerating with its trajectory moving inward while vortex 2 maintains its induced motion. Since vortex 1 is eventually eroded, its advection inward is limited, and only fluid from vortex 2 will become the centre of the resulting flow (figure 4
b). If vortex 1 is significantly weaker than vortex 2, it will be unable to detrain vortex 2 before it is eroded away by vortex 2 and thus will not be advected inwards. Hence, in this case, entrainment will not occur. This is seen in figures 3(c) and 4(c) (
 $\unicode[STIX]{x1D6EC}_{0}=0.7$
), wherein the peak of vortex 1 accelerates somewhat as it weakens but undergoes no inward motion, while vortex 2 decelerates as it establishes itself as the sole vortex in the flow. This is consistent with the results presented in a Lagrangian study of a highly asymmetric pair with
 $\unicode[STIX]{x1D6EC}_{0}=\unicode[STIX]{x1D714}_{1}/\unicode[STIX]{x1D714}_{2}=0.5$
by Huang (Reference Huang2006).
In all cases, whether or not entrainment occurs, by the end of the primary convective phase there exists only a single vortex structure, comprised of fluid from one or both starting cores, shown in column 4 of figure 2 for
 $\unicode[STIX]{x1D6EC}_{0}=1.0$
, 0.9 cases and in column 3 for
 $\unicode[STIX]{x1D6EC}_{0}=0.7$
case (since no entrainment occurs). Beyond the convective phase, the resulting structure undergoes a final phase (column 5 of figure 2) during which it axisymmetrizes into a circular Gaussian vortex which continues to evolve by viscous diffusion.
4 Assessing the product of asymmetric interactions
In order to quantitatively assess the interaction, an
 $\unicode[STIX]{x1D716}$
-type enhancement factor is evaluated,
 $$\begin{eqnarray}\unicode[STIX]{x1D700}\equiv \frac{\unicode[STIX]{x1D6E4}_{end}}{\unicode[STIX]{x1D6E4}_{2,start}},\end{eqnarray}$$
and, since
 $\unicode[STIX]{x1D700}$
(
 $\unicode[STIX]{x1D6E4}_{end}$
) depends directly on the total available circulation of the starting pair, a corresponding merging efficiency,
 $$\begin{eqnarray}\unicode[STIX]{x1D702}\equiv \frac{\unicode[STIX]{x1D6E4}_{end}}{\unicode[STIX]{x1D6E4}_{tot,start}},\end{eqnarray}$$
is also considered. Both quantities are based on the circulation of the vortex,
 $\unicode[STIX]{x1D6E4}_{end}$
, at the end time of the interaction (
 $t_{end}^{\ast }$
) relative to the circulation of the stronger vortex,
 $\unicode[STIX]{x1D6E4}_{2,start}$
, and of the total circulation of both vortices combined,
 $\unicode[STIX]{x1D6E4}_{tot,start}$
, respectively, at the starting time of the interaction (
 $t_{start}^{\ast }$
). Since the key processes that lead to a single vortex occur in the primary convective phase, the vortex pair interaction is considered to be the primary convective interaction only (see appendix A), and the start and end times are considered to be those of this phase.
In order to evaluate (4.1) and (4.2) for viscous flow, the vortex cores must be identified in a consistent manner throughout the entire flow development including the transition from two vortices into one. To do this, a criterion is used based on the second invariant of the velocity gradient tensor:
 $II=1/2(\unicode[STIX]{x1D714}^{2}/2-S^{2})>II_{t}$
, where
 $II_{t}$
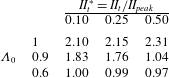
is an arbitrary threshold level (Hunt, Wray & Moin Reference Hunt, Wray and Moin1988). For the present study, the threshold level is set by
 $II_{t}^{\ast }\equiv II_{t}(t)/II_{peak}(t)=0.10$
, where
 $II_{peak}(t)$
is the instantaneous value of
 $II$
at the location of the higher of the values of
 $II_{i}$
evaluated at the location of each vorticity peak
 $i=1,2$
(or at the location of the only peak, if only one exists) unless otherwise noted. The value
 $II_{t}^{\ast }=0.10$
corresponds to the characteristic radius of a single isolated Gaussian vortex based upon the second moment of vorticity,
 $r=a_{\unicode[STIX]{x1D714}}$
, and is therefore used to identify the cores throughout the present study (Saffman Reference Saffman2001; Meunier et al.
Reference Meunier, Ehrenstein, Leweke and Rossi2002). For more discussion of the choice of
 $II_{t}$
, see appendix A. Each lower row of figure 2 depicts the portion of the flow considered to be core by
 $II>II_{t}$
. It is seen that low-level peripheral and filamentary vorticity is excluded and the transformation of the flow from two distinct structures into one is captured.
Since the interaction between two isolated co-rotating vortices in viscous fluid always ultimately results in a single vortex, aggregate area and circulation of the vortex core(s) are evaluated by
 $$\begin{eqnarray}A_{II}(t)=\displaystyle \int _{II>II_{t}}\,\text{d}A\end{eqnarray}$$
and
 $$\begin{eqnarray}\unicode[STIX]{x1D6E4}_{II}(t)=\displaystyle \int _{II>II_{t}}\unicode[STIX]{x1D714}\,\text{d}A,\end{eqnarray}$$
where
 $\text{d}A$
refers to an area element of fluid (properties of each individual vortex
 $i=1,2$
are computed similarly using a separate
 $II_{t,i}$
for each, not shown). While this means that the definition of the weaker vortex core is somewhat inconsistent across
 $\unicode[STIX]{x1D6EC}$
, by monitoring the properties continuously, the times of start (
 $t_{start}^{\ast }$
) and end (
 $t_{end}^{\ast }$
) of the interaction can be identified without presupposing when the vortices are destroyed or when a new one is formed. Illustrative plots of
 $A_{II}(t)$
and
 $\unicode[STIX]{x1D6E4}_{II}(t)$
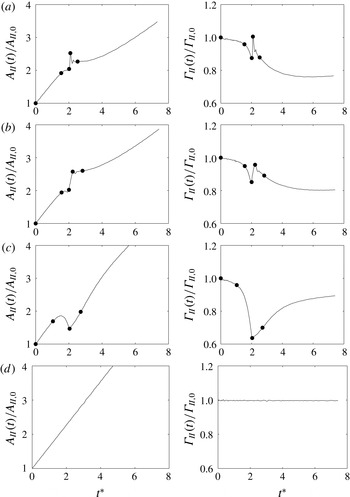
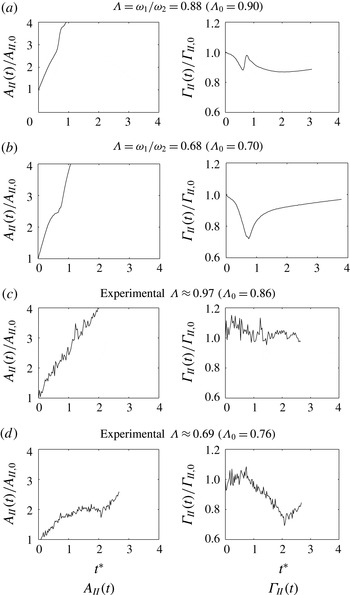
are presented in figure 5 which correspond to the cases depicted in figure 2. The aggregate properties are normalized by their values at the initial condition. Equivalent plots for a single Gaussian vortex having the same
 $Re_{\unicode[STIX]{x1D6E4}}$
as one member of the symmetric pair (
 $Re_{\unicode[STIX]{x1D6E4}}=5000$
) are also included in figure 5(d) for reference. In this case,
 $A_{II}(t)$
increases linearly in time while
 $\unicode[STIX]{x1D6E4}_{II}(t)$
remains very nearly constant, as expected, which verifies the evaluation of (4.3) and (4.4). Prior to
 $t_{start}^{\ast }$
, each individual vortex’s
 $\unicode[STIX]{x1D6E4}_{II,i}$
and
 $A_{II,i}$
evolve similarly to those of the single vortex (not shown).
Time development of normalized aggregate core area
 $A_{II}(t)/A_{II,0}$
and circulation
 $\unicode[STIX]{x1D6E4}_{II}(t)/\unicode[STIX]{x1D6E4}_{II,0}$
(see (4.3) and (4.4)) for (a–c) the cases depicted in figure 2 and (d) a single vortex with same
 $Re_{\unicode[STIX]{x1D6E4}}$
. The dots in (a–c) correspond to the times of the columns in figure 2. (a) Symmetric (
 $\unicode[STIX]{x1D6EC}=\unicode[STIX]{x1D6EC}_{0}=1.0$
), (b)
 $\unicode[STIX]{x1D6EC}=\unicode[STIX]{x1D714}_{1}/\unicode[STIX]{x1D714}_{2}=0.88\;(\unicode[STIX]{x1D6EC}_{0}=0.90)$
, (c)
 $\unicode[STIX]{x1D6EC}=\unicode[STIX]{x1D714}_{1}/\unicode[STIX]{x1D714}_{2}=0.68\;(\unicode[STIX]{x1D6EC}_{0}=0.70)$
, (d) single vortex.

In each of the pair interactions in figure 5(a–c), at first
 $A_{II}(t)$
grows linearly by viscous diffusion (i.e. during the first diffusive phase), while
 $\unicode[STIX]{x1D6E4}_{II}(t)$
decreases slightly due to the intensifying induced strain. There is then a deviation from linear growth of
 $A_{II}(t)$
due to filamentation and core detrainment. Since the start of detrainment is considered to be the start of the main convective interaction,
 $t_{start}^{\ast }$
is chosen to be the earlier time at which the evolution of either of the individual
 $A_{II,i}(t)$
begins a continual deviation from linear growth, reaching and thereafter maintaining at least a 0.5 % deviation from the
 $A_{II,i}$
value predicted by continual linear growth (note that computed
 $\unicode[STIX]{x1D700}$
and
 $\unicode[STIX]{x1D702}$
are relatively insensitive to choice of
 $t_{start}^{\ast }$
since
 $\unicode[STIX]{x1D6E4}_{II}$
remains approximately constant prior to detrainment, see appendix A for details). This essentially corresponds to the departure from linear growth of aggregate
 $A_{II}(t)$
but is somewhat easier to detect in UPUA cases. Note that for the remainder of this study, unless otherwise noted, vortex parameters such as
 $\unicode[STIX]{x1D6E4}_{II,1}$
,
 $\unicode[STIX]{x1D6E4}_{II,2}$
, and
 $\unicode[STIX]{x1D6EC}$
refer to quantities evaluated at
 $t_{start}^{\ast }$
, and that cases are identified by these properties (e.g.
 $\unicode[STIX]{x1D6EC}=0.88$
rather than
 $\unicode[STIX]{x1D6EC}_{0}=0.90$
).
Subsequent to
 $t_{start}^{\ast }$
in figure 5(a–c),
 $\unicode[STIX]{x1D6E4}_{II}(t)$
rapidly decreases to a local minimum, at time
 $t_{det}^{\ast }$
, as vorticity detrains from the cores (column 3 of figure 2 corresponds to this minimum). For vortices similar in strength (figure 5
a,b), immediately after the time the
 $\unicode[STIX]{x1D6E4}_{II}(t)$
local minimum is reached, both
 $A_{II}(t)$
and
 $\unicode[STIX]{x1D6E4}_{II}(t)$
grow rapidly, with
 $\unicode[STIX]{x1D6E4}_{II}(t)$
quickly reaching a sharp peak, at time
 $t_{ent}^{\ast }$
, before diminishing again (column 4 of figure 2 corresponds to this maximum). For vortices having more disparate strengths (figure 5
c), after
 $A_{II}(t)$
and
 $\unicode[STIX]{x1D6E4}_{II}(t)$
reach their (simultaneous) local minima they both experience smooth, nonlinear behaviour without any spike, and ultimately return to single Gaussian vortex behaviour which is maintained until the end of the simulation. Note that there is not a sharp or sudden change in qualitative behaviour: intermediate cases contain qualitative elements of both (not pictured; these cases are treated as spike-occurring cases in all subsequent analysis).
Comparing figures 5(a,b) and 3(a,b), it is seen that the spikes in the symmetric and
 $\unicode[STIX]{x1D6EC}_{0}=0.90$
cases coincide with the speed increase that is associated with mutual entrainment as described in § 3. It is also seen that there is no spike or rapid acceleration in the UPEA
 $\unicode[STIX]{x1D6EC}_{0}=0.70$
case for which no entrainment occurs. The spike in the
 $\unicode[STIX]{x1D6E4}_{II}(t)$
plot is therefore associated with entrainment, in these cases
 $t_{end}^{\ast }$
is chosen to be
 $t_{ent}^{\ast }$
since at this time there exists only one continuous
 $II>II_{t}$
region, i.e. effectively one vortical structure (see lower rows of figure 2
a,b). Then for cases having no spike,
 $t_{end}^{\ast }$
is chosen to be
 $t_{det}^{\ast }$
since at that point there is already only one continuous region because no entrainment occurs (see lower row of figure 2
c). If multiple local minima or maxima exist,
 $t_{det}^{\ast }$
and
 $t_{ent}^{\ast }$
are taken at the extremum with the smallest or largest
 $\unicode[STIX]{x1D6E4}_{II}$
, as appropriate.
With
 $t_{start}^{\ast }$
and
 $t_{end}^{\ast }$
determined,
 $\unicode[STIX]{x1D700}$
and
 $\unicode[STIX]{x1D702}$
can be computed and results are discussed in the following sections. Alternative choices of
 $t_{start}^{\ast }$
and
 $t_{end}^{\ast }$
were considered and found to yield similar results in terms of both values and trends of
 $\unicode[STIX]{x1D700}$
(and
 $\unicode[STIX]{x1D702}$
) (see appendix A for details). It is noted that
 $A_{II}(t)$
and
 $\unicode[STIX]{x1D6E4}_{II}(t)$
continue to evolve subsequent to
 $t_{end}^{\ast }$
, and careful observation shows that this corresponds to the axisymmetrization of the combined (i.e. final) structure and the diffusion of this structure into the non-quiescent post-interaction surrounding fluid (see appendix A). Since this predominantly viscous process occurs after the conclusion of the convective phase, it is not considered to be a part of the main interaction of the two vortices (i.e. not a part of the convective merging) and is therefore not considered in the evaluation of the interaction.
5 Results
Numerical values for
 $\unicode[STIX]{x1D700}$
and
 $\unicode[STIX]{x1D702}$
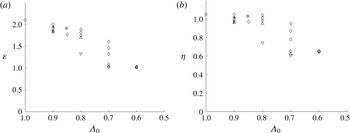
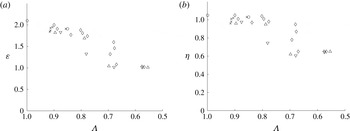
are tabulated in table 1 along with the initial condition and start of interaction pair properties for each case. Note that although the theoretical maximum value is
 $\unicode[STIX]{x1D700}_{max}=\unicode[STIX]{x1D6E4}_{end,max}/\unicode[STIX]{x1D6E4}_{2,start}=(\unicode[STIX]{x1D6E4}_{1,start}+\unicode[STIX]{x1D6E4}_{2,start})/\unicode[STIX]{x1D6E4}_{2,start}=\unicode[STIX]{x1D6EC}+1$
, this limit could be exceeded due to the use of
 $II_{t}$
. These values of
 $\unicode[STIX]{x1D700}$
and
 $\unicode[STIX]{x1D702}$
are plotted against initial
 $\unicode[STIX]{x1D6EC}_{0}$
in figure 6 and starting
 $\unicode[STIX]{x1D6EC}$
in figure 7 on a reversed horizontal axis, and the similarity of the plots suggests that the observed variance is not a consequence of the choice of the evaluation time of the parameter.
Results for
 $\unicode[STIX]{x1D700}$
and
 $\unicode[STIX]{x1D702}$
versus initial circulation ratio,
 $\unicode[STIX]{x1D6EC}_{0}$
: (a)
 $\unicode[STIX]{x1D700}$
versus
 $\unicode[STIX]{x1D6EC}_{0}$
and (b)
 $\unicode[STIX]{x1D702}$
versus
 $\unicode[STIX]{x1D6EC}_{0}$
, for
 $Re_{\unicode[STIX]{x1D6E4}}=5000$
cases. ▿: UPEA; ▵: EPUA; ♢: UPUA, stronger wins;
 $\times$
: UPUA, weaker wins; ○: no winner (includes symmetric).

Results for
 $\unicode[STIX]{x1D700}$
and
 $\unicode[STIX]{x1D702}$
versus starting circulation ratio,
 $\unicode[STIX]{x1D6EC}$
: (a)
 $\unicode[STIX]{x1D700}$
versus
 $\unicode[STIX]{x1D6EC}$
and (b)
 $\unicode[STIX]{x1D702}$
versus
 $\unicode[STIX]{x1D6EC}$
, for
 $Re_{\unicode[STIX]{x1D6E4}}=5000$
cases. ▿: UPEA; ▵: EPUA; ♢: UPUA, stronger wins;
 $\times$
: UPUA, weaker wins; ○: no winner (includes symmetric).

5.1 Symmetric merger
The symmetric interaction (
 $\unicode[STIX]{x1D6EC}=\unicode[STIX]{x1D6EC}_{0}=1.0$
, no winner) produces an enhancement
 $\unicode[STIX]{x1D700}\approx 2.1$
. This value indicates that the core circulation is essentially conserved in the interaction, having
 $\unicode[STIX]{x1D702}\approx 1.0$
, and comparable to the values of
 $\unicode[STIX]{x1D716}\approx 1.6{-}1.8$
and
 $\unicode[STIX]{x1D702}\approx 0.8{-}0.9$
found for inviscid symmetric pair interactions (with Gaussian initial vorticity distribution) by Waugh (Reference Waugh1992), Maze, Carton & Lapeyre (Reference Maze, Carton and Lapeyre2004) and Trieling et al. (Reference Trieling, Velasco Fuentes and van Heijst2005). It is noted that the presence of viscosity does not appear to induce any significant additional losses in the symmetric case in the present study. This is attributed to the fact that losses during merging arise primarily due to the dissipation of the vorticity filaments, which are associated with the low-level vorticity at the periphery of the vortex, which itself does not meet the
 $II_{t}^{\ast }>0.10$
threshold even at
 $t_{start}^{\ast }$
. This effect was noted by Trieling et al. (Reference Trieling, Velasco Fuentes and van Heijst2005), whose radius method used to define the ‘core’ is comparable to using
 $II_{t}^{\ast }\approx 0.10$
. This exclusion of the low-level vorticity accounts for
 $\unicode[STIX]{x1D716}$
and
 $\unicode[STIX]{x1D702}$
here being higher than has been found in studies of inviscid Rankine vortices (Waugh Reference Waugh1992; Maze et al.
Reference Maze, Carton and Lapeyre2004; Trieling et al.
Reference Trieling, Velasco Fuentes and van Heijst2005). That
 $\unicode[STIX]{x1D700}$
and
 $\unicode[STIX]{x1D702}$
found in the present study are somewhat higher than those found by Trieling et al. (Reference Trieling, Velasco Fuentes and van Heijst2005) for Gaussian vortices is attributed primarily to the differing choice of initial aspect ratio, as well as viscous effects.
5.2 Asymmetric interactions: UPEA and EPUA cases
For vortices with unequal initial vorticity peaks but equal areas (UPEA),
 $\unicode[STIX]{x1D700}$
is found to decrease monotonically from
 $\unicode[STIX]{x1D700}\approx 2.0$
in the symmetric case to
 $\unicode[STIX]{x1D700}\approx 1.0$
, reaching this value at
 $\unicode[STIX]{x1D6EC}=\unicode[STIX]{x1D714}_{1}/\unicode[STIX]{x1D714}_{2}=0.77$
for
 $Re_{\unicode[STIX]{x1D6E4}}=5000$
, and remains at approximately
 $1$
for further decreases in
 $\unicode[STIX]{x1D6EC}$
(see figure 7). The value of
 $\unicode[STIX]{x1D700}\approx 1$
corresponds to a straining-out interaction.
That
 $\unicode[STIX]{x1D700}$
decreases with
 $\unicode[STIX]{x1D6EC}$
is to be expected since total initial circulation is proportional to
 $1+\unicode[STIX]{x1D6EC}_{0}$
, but
 $\unicode[STIX]{x1D702}$
decreases monotonically as well, indicating that a progressively greater percentage of the initial circulation is lost during interaction. These
 $\unicode[STIX]{x1D702}$
values are found to be relatively high (greater than 90 %) until decreasing rapidly between
 $0.80\geqslant \unicode[STIX]{x1D6EC}\geqslant 0.77$
(corresponding to approximately
 $0.825\geqslant \unicode[STIX]{x1D6EC}_{0}\geqslant 0.785$
for the UPEA case), a relatively small transition region in the parameter space. Note that once
 $\unicode[STIX]{x1D700}=1$
is reached,
 $\unicode[STIX]{x1D702}=1/(1+\unicode[STIX]{x1D6EC})$
and ceases to be a meaningful quantity for further changes in
 $\unicode[STIX]{x1D6EC}$
.
Cases having equal peak vorticity and unequal areas (EPUA cases),
 $\unicode[STIX]{x1D714}_{1}/\unicode[STIX]{x1D714}_{2}=1.0$
and
 $A_{1}/A_{2}<1.0$
, proceed qualitatively similarly to the UPEA cases, achieving somewhat higher enhancement for
 $\unicode[STIX]{x1D6EC}\approx 0.8$
but similarly reaching
 $\unicode[STIX]{x1D700}\approx 1$
for
 $\unicode[STIX]{x1D6EC}\approx 0.7$
(see figure 7).
The results are in reasonable agreement with the qualitative assessments of other asymmetric flows (Dritschel & Waugh Reference Dritschel and Waugh1992; Brandt & Nomura Reference Brandt and Nomura2010) if ‘straining out’ is taken to correspond to
 $\unicode[STIX]{x1D700}\approx 1$
and ‘merging’ to
 $\unicode[STIX]{x1D700}$
significantly greater than 1. Trieling et al. (Reference Trieling, Velasco Fuentes and van Heijst2005) found a similar qualitative trend for enhancement produced by the mergers of inviscid initially Gaussian vortices, although they found the
 $\unicode[STIX]{x1D700}\approx 1.0$
regime occurs at much smaller
 $\unicode[STIX]{x1D6EC}$
(strictly,
 $\unicode[STIX]{x1D6EC}_{0}$
) than the present study (approximately 0.36 for unequal area pairs), with similarly high
 $\unicode[STIX]{x1D702}$
values (minimal
 $\unicode[STIX]{x1D702}\approx 0.8$
, some nearly 95 %). Since Trieling et al. (Reference Trieling, Velasco Fuentes and van Heijst2005) consider inviscid flows, and other studies of viscous merging at comparable
 $Re_{\unicode[STIX]{x1D6E4}}$
indicate an upper bound for
 $\unicode[STIX]{x1D6EC}$
for the straining-out regime to be between 0.6–0.7 (Brandt & Nomura Reference Brandt and Nomura2010) and between 0.5–1.0 (Huang Reference Huang2005, Reference Huang2006), this discrepancy is attributed to Trieling et al.’s use of much larger initial aspect ratios
 $(a/b)_{0}$
(i.e. smaller initial separations
 $(b/a)_{0}$
).
5.3 Asymmetric interactions: UPUA cases
Though most prior studies have considered asymmetric pair interactions having either unequal peaks or unequal areas, vortex pairs may in general simultaneously have both
 $\unicode[STIX]{x1D714}_{1}/\unicode[STIX]{x1D714}_{2}\neq 1$
and
 $A_{1}/A_{2}\neq 1$
, including those in which
 $\unicode[STIX]{x1D6EC}=\unicode[STIX]{x1D6E4}_{1}/\unicode[STIX]{x1D6E4}_{2}<1.0$
but
 $\unicode[STIX]{x1D714}_{1}/\unicode[STIX]{x1D714}_{2}>1.0$
. Simulations of pairs having unequal peaks and unequal areas (UPUA) were performed within the range of parameters judged to be computationally feasible.
Unlike the UPEA and EPUA cases, the enhancement produced by these UPUA cases does not follow simple monotonic behaviour with respect to
 $\unicode[STIX]{x1D6EC}$
, leading to the scatter seen in figure 7 for
 $Re_{\unicode[STIX]{x1D6E4}}=5000$
. The most extreme discrepancy is found to occur around
 $\unicode[STIX]{x1D6EC}=0.7$
, with interactions capable of producing significant enhancement (
 $\unicode[STIX]{x1D700}\approx 1.60$
) or none at all (
 $\unicode[STIX]{x1D700}\approx 1.01$
) depending on the exact parameters of the pair.
An interesting aspect of these UPUA cases is that in some cases the peak of the initially weaker vortex is found to become that of the resulting final vortex, a result not possible in the UPEA and EPUA cases. An example is presented in figure 8, where for a given
 $\unicode[STIX]{x1D6EC}\approx 0.9$
, vortices of differing
 $\unicode[STIX]{x1D714}_{1}/\unicode[STIX]{x1D714}_{2}$
at the start of detrainment are observed to each follow trajectories qualitatively similar to the UPEA
 $\unicode[STIX]{x1D6EC}_{0}=0.90$
(
 $\unicode[STIX]{x1D6EC}=0.88$
) asymmetric merger case shown in figure 4(b), but in figure 8(b) the peak of the initially weaker vortex becomes the peak of the resulting compound structure. Careful consideration of the underlying physics yields a simple explanation that generalizes this finding and the observed
 $\unicode[STIX]{x1D700}$
and
 $\unicode[STIX]{x1D702}$
trends, as discussed in § 6.
Trajectories of vortex peaks of UPUA pairs having
 $\unicode[STIX]{x1D6EC}\approx 0.9$
with differing peak vorticity ratios. Red
 $\times$
: vortex 1 (weaker), blue ○: vortex 2 (stronger). Initial positions indicated by filled square and circle respectively. (a) The stronger vortex’s peak becomes the post-interaction vortex centre (i.e. the stronger wins) for
 $\unicode[STIX]{x1D714}_{1}/\unicode[STIX]{x1D714}_{2}=1.04$
, (b) the weaker vortex’s peak becomes the post-interaction vortex centre for
 $\unicode[STIX]{x1D714}_{1}/\unicode[STIX]{x1D714}_{2}=1.18$
(i.e. the weaker wins).

6 Relative straining and the mutuality parameter
The relationship between the metrics characterizing the interaction outcome (
 $\unicode[STIX]{x1D700}$
and
 $\unicode[STIX]{x1D702}$
) and the basic parameters of the starting vortex pair (i.e.
 $\unicode[STIX]{x1D6EC}$
,
 $\unicode[STIX]{x1D714}_{1}/\unicode[STIX]{x1D714}_{2}$
,
 $A_{1}/A_{2}$
) presented in figure 7 and table 1 is unclear. A more effective parametrization may be developed by considering the underlying physics of the interaction. The analysis is given below and results are presented in figures 9–12. These figures include the
 $Re_{\unicode[STIX]{x1D6E4}}=5000$
cases as well as the
 $Re_{\unicode[STIX]{x1D6E4}}=1000$
cases. This section will focus on the
 $Re_{\unicode[STIX]{x1D6E4}}=5000$
results except where indicated; discussion of the
 $Re_{\unicode[STIX]{x1D6E4}}=1000$
results and viscous effects will be given in § 7.
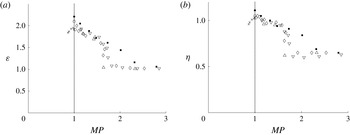
Results for
 $\unicode[STIX]{x1D700}$
and
 $\unicode[STIX]{x1D702}$
versus mutuality parameter,
 $MP$
: (a)
 $\unicode[STIX]{x1D700}$
versus
 $MP$
and (b)
 $\unicode[STIX]{x1D702}$
versus
 $MP$
, for all cases. For
 $Re_{\unicode[STIX]{x1D6E4}}=5000$
cases, ▿: UPEA; ▵: EPUA; ♢: UPUA, stronger wins;
 $\times$
: UPUA, weaker wins; ○: no winner. For the
 $Re_{\unicode[STIX]{x1D6E4}}=1000$
cases, ▪: UPEA; ●: no winner.

As discussed in § 3, for vortex merger to occur, i.e. for a compound vortex with
 $\unicode[STIX]{x1D700}>1$
to be produced, mutual entrainment must occur to some extent so that there is some interpenetration of vorticity of the two vortices. This requires detrainment to be established in both vortices. If the disparity between the vortices is too great, detrainment will only be initiated in one vortex, which will then erode and be destroyed before it can induce detrainment of the other vortex, leaving it unenhanced, i.e.
 $\unicode[STIX]{x1D700}\sim 1$
. Since detrainment of a vortex is initiated by the induced strain and resulting deformation of vorticity, it may be characterized by a ratio of the strain rate to vorticity,
 $(S/\unicode[STIX]{x1D714})_{i}$
, which is here referred to as the relative straining. Here,
 $S_{i}$
and
 $\unicode[STIX]{x1D714}_{i}$
are evaluated at the location of the vorticity peak of vortex
 $i$
at the start of convective interaction
 $t_{start}^{\ast }$
(note
 $S=\sqrt{\boldsymbol{S}^{2}}$
where
 $\boldsymbol{S}^{2}=\text{tr}[S_{mn}S_{mn}]$
). A mutuality parameter
 $MP$
is then defined as the ratio of the relative straining of each vortex,
 $$\begin{eqnarray}MP=\frac{(S/\unicode[STIX]{x1D714})_{1}}{(S/\unicode[STIX]{x1D714})_{2}}\end{eqnarray}$$
which indicates the degree of mutuality of the interaction. A value of
 $MP=1$
corresponds to a fully two-way interaction. When
 $MP\sim 1$
, the vortices experience comparable relative straining so that both vortices are detrained, resulting in entrainment and
 $\unicode[STIX]{x1D700}>1$
. As
 $MP$
deviates from unity, it is expected that the interaction will become increasingly dominated by one vortex and
 $\unicode[STIX]{x1D700}$
will decrease until some critical value is reached, beyond which
 $\unicode[STIX]{x1D700}\sim 1$
, i.e. a one-way interaction.
Figure 9 shows
 $\unicode[STIX]{x1D700}$
and
 $\unicode[STIX]{x1D702}$
as functions of
 $MP$
. Note that figure 9 includes all the cases in figure 7 (i.e.
 $Re_{\unicode[STIX]{x1D6E4}}=5000$
) as well as
 $Re_{\unicode[STIX]{x1D6E4}}=1000$
cases. For the
 $Re_{\unicode[STIX]{x1D6E4}}=5000$
results, the previous scatter in both
 $\unicode[STIX]{x1D700}$
and
 $\unicode[STIX]{x1D702}$
across all cases (UPEA, EPUA and UPUA) is seen to be significantly reduced, indicating a more effective characterization than
 $\unicode[STIX]{x1D6EC}$
. The dependence is peaked at
 $MP=1$
and generally monotonic to either side with both
 $\unicode[STIX]{x1D700}$
and
 $\unicode[STIX]{x1D702}$
decreasing as
 $MP$
varies from 1.
The majority of results correspond to
 $MP>1$
; in this case, since
 $(S/\unicode[STIX]{x1D714})_{1}>(S/\unicode[STIX]{x1D714})_{2}$
, the weaker vortex detrains first and the stronger vortex then dominates. The associated values of
 $\unicode[STIX]{x1D700}$
decrease as
 $MP$
increases from 1, at first relatively gradually and then quite rapidly near a critical value of
 $MP$
, beyond which they remain constant at
 $\unicode[STIX]{x1D700}\sim 1$
. The critical value,
 $MP_{cr}\approx 1.78\pm 0.04$
, thus gives a criterion for merger in these cases. These interactions may then be characterized as follows: for
 $MP=1$
, symmetric merger (and in principle asymmetric merger with
 $(S/\unicode[STIX]{x1D714})_{1}/(S/\unicode[STIX]{x1D714})_{2}=1$
, see figure 10) occurs and
 $\unicode[STIX]{x1D700}$
exhibits peak values; for
 $1<MP<MP_{cr}$
,
 $\unicode[STIX]{x1D700}>1$
, asymmetric merger occurs resulting in the stronger vortex being enhanced; and for
 $MP>MP_{cr}$
,
 $\unicode[STIX]{x1D700}\sim 1$
, straining out occurs with the stronger vortex surviving unenhanced. The behaviour of
 $\unicode[STIX]{x1D702}$
is similar, although for
 $MP<MP_{cr}$
, the decline is somewhat more muted; asymmetric merger is seen to be relatively high efficiency (most having
 $\unicode[STIX]{x1D702}>0.85$
) indicating relatively minor losses for mergers in general.
When
 $MP<1$
,
 $(S/\unicode[STIX]{x1D714})_{1}<(S/\unicode[STIX]{x1D714})_{2}$
, and the corresponding cases in figure 9 are asymmetric mergers in which the weaker vortex dominates (as seen in figure 8
b) and is ultimately enhanced by the interaction, i.e. wins (computed
 $\unicode[STIX]{x1D700}$
is based on the stronger starting vortex regardless of which wins). It is expected that straining out will occur for
 $MP<MP_{cr}\approx 1/1.78=0.56$
, however, resolution considerations preclude further investigation of this weak-winner regime. When
 $MP\approx 1$
, neither vortex dominates or clearly wins (identified as ‘no winner’ in figure 9). Recall that in the symmetric case where
 $MP=1$
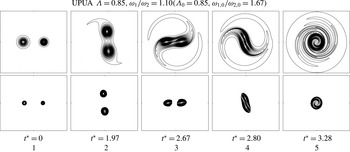
, both vortices are destroyed as they become mutually entrained and the flow transforms into a new vortex. This scenario can also occur in asymmetric (UPUA) cases when the relative straining on each vortex is nearly equal. An example of a no-winner UPUA case is given in figure 10, which shows that neither vortex dominates and the interaction proceeds in a similar manner to the symmetric case (figure 2
a). The symmetric and no-winner UPUA
 $MP\approx 1$
cases in the present study are seen to produce similar
 $\unicode[STIX]{x1D702}$
, implying comparably effective merging.
Vorticity contours at the initial condition and key times during the interaction for a UPUA case (
 $\unicode[STIX]{x1D6EC}=0.85$
,
 $\unicode[STIX]{x1D714}_{1}/\unicode[STIX]{x1D714}_{2}=1.10$
,
 $Re_{\unicode[STIX]{x1D6E4}}=5000$
) in which no winner can be determined (
 $MP=1.02$
). See figure 2 for meanings of the rows and columns.

It is useful to relate
 $MP$
to the previously considered vortex parameters. Simple expressions for
 $(S/\unicode[STIX]{x1D714})_{i}$
can be obtained by considering the external strain rate produced by a point vortex, i.e. the strain rate induced by one vortex at the location of the other were the other not present, e.g.
 $S_{1}=\unicode[STIX]{x1D6E4}_{2}/(2\unicode[STIX]{x03C0}b^{2})$
(a similar expression can be obtained using the expression for strain rate produced by a Lamb–Oseen vortex Saffman Reference Saffman2001), and using
 $\unicode[STIX]{x1D6E4}_{i}=\unicode[STIX]{x03C0}a_{i}^{2}\unicode[STIX]{x1D714}_{i}$
,
 $$\begin{eqnarray}\displaystyle & \displaystyle \left(\frac{S}{\unicode[STIX]{x1D714}}\right)_{1}\sim \frac{1}{2\unicode[STIX]{x1D6EC}}\left(\frac{a_{1}}{b}\right)^{2}, & \displaystyle\end{eqnarray}$$
 $$\begin{eqnarray}\displaystyle & \displaystyle \left(\frac{S}{\unicode[STIX]{x1D714}}\right)_{2}\sim \frac{\unicode[STIX]{x1D6EC}}{2}\left(\frac{a_{2}}{b}\right)^{2}. & \displaystyle\end{eqnarray}$$
This relates
 $(S/\unicode[STIX]{x1D714})_{i}$
to the vortex aspect ratios. For symmetric and UPEA pairs, equations (6.2)–(6.3) imply
 $MP=1/\unicode[STIX]{x1D6EC}^{2}$
, which is observed to hold approximately true across the range of
 $\unicode[STIX]{x1D6EC}$
considered in the present study (not shown). The critical
 $MP_{cr}\approx 1.78$
then implies a critical
 $\unicode[STIX]{x1D6EC}_{cr}\approx \sqrt{1/1.78}=0.75$
, very close to the observed UPEA
 $\unicode[STIX]{x1D6EC}_{cr}\approx 0.79$
(figure 7).
A simple relation for
 $MP$
may then be obtained from (6.2)–(6.3),
 $$\begin{eqnarray}MP=\frac{(S/\unicode[STIX]{x1D714})_{1}}{(S/\unicode[STIX]{x1D714})_{2}}\sim \frac{{\unicode[STIX]{x1D714}_{2}}^{2}{a_{2}}^{2}}{{\unicode[STIX]{x1D714}_{1}}^{2}{a_{1}}^{2}},\end{eqnarray}$$
where
 $\unicode[STIX]{x1D714}_{i}^{2}a_{i}^{2}$
is the enstrophy of a Rankine vortex. This suggests that the enstrophy ratio at the onset of convective interaction may capture the same physical principles and consequent
 $\unicode[STIX]{x1D700}$
and
 $\unicode[STIX]{x1D702}$
behaviour as
 $(S/\unicode[STIX]{x1D714})_{1}/(S/\unicode[STIX]{x1D714})_{2}$
. More generally, the enstrophy ratio can be defined as
 $$\begin{eqnarray}\frac{Z_{2}}{Z_{1}}=\frac{\displaystyle \int _{II>II_{t,2}}\unicode[STIX]{x1D714}_{2}^{2}\,\text{d}A_{2}}{\displaystyle \int _{II>II_{t,1}}\unicode[STIX]{x1D714}_{1}^{2}\,\text{d}A_{1}},\end{eqnarray}$$
where the integral is evaluated for each vortex at
 $t_{start}^{\ast }$
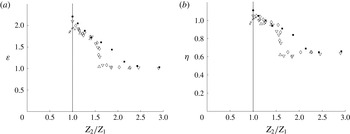
. Figure 11 shows
 $\unicode[STIX]{x1D700}$
and
 $\unicode[STIX]{x1D702}$
plotted against
 $Z_{2}/Z_{1}$
; the observed dependence is similar to that of
 $MP$
. It is noted, however, that this parameter is somewhat less successful at indicating the weak-winner regime boundary (figure 11). The critical enstrophy ratio beyond which no enhancement occurs is found to be
 $(Z_{2}/Z_{1})_{cr}\approx 1.63\pm 0.03$
for
 $Re_{\unicode[STIX]{x1D6E4}}=5000$
.
Results for
 $\unicode[STIX]{x1D700}$
and
 $\unicode[STIX]{x1D702}$
versus enstrophy ratio,
 $Z_{2}/Z_{1}$
: (a)
 $\unicode[STIX]{x1D700}$
versus
 $Z_{2}/Z_{1}$
and (b)
 $\unicode[STIX]{x1D702}$
versus
 $Z_{2}/Z_{1}$
, for all cases. For the
 $Re_{\unicode[STIX]{x1D6E4}}=5000$
cases, ▿: UPEA; ▵: EPUA; ♢: UPUA, stronger wins;
 $\times$
: UPUA, weaker wins; ○: no winner. For the
 $Re_{\unicode[STIX]{x1D6E4}}=1000$
cases, ▪: UPEA; ●: no winner.

To the authors’ knowledge, the only other study to consider strong-winner and weak-winner interactions is Melander et al. (Reference Melander, Zabusky and McWilliams1987b
), who found a transition region between these cases in their parameter space, which they approximated by
 $(\unicode[STIX]{x1D714}_{1}/\unicode[STIX]{x1D714}_{2})=(A_{1}/A_{2})^{-0.36}$
. A similar expression can be obtained from (6.4) with
 $MP=1$
(the boundary for the weak-winner regime in the present study),
 $(\unicode[STIX]{x1D714}_{1}/\unicode[STIX]{x1D714}_{2})=(A_{1}/A_{2})^{-0.5}$
, which approximately corresponds to the ‘lower edge’ of the transition region of Melander et al. (see their figure 2). Considering the slightly different definitions of ‘winner’ and the presence of viscosity in the present study, this correspondence is notable.
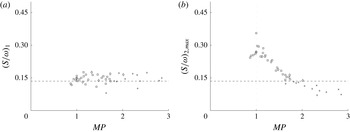
Examining
 $(S/\unicode[STIX]{x1D714})_{i}$
of each vortex separately, it is observed that the convective interaction begins when the relative straining of the first vortex to detrain reaches some consistent value. Figures 12(a) and 12(b) show the starting
 $(S/\unicode[STIX]{x1D714})_{1}$
and the maximum value of
 $(S/\unicode[STIX]{x1D714})_{2}$
reached before the end of detrainment, respectively, plotted against the corresponding
 $MP$
for all numerical cases. For each case the interaction outcome is coded as binary ‘merger’ or ‘straining out’ based on whether an entrainment process is evident in the
 $A_{II}(t)$
and
 $\unicode[STIX]{x1D6E4}_{II}(t)$
plots (this classification is consistent with a
 $\unicode[STIX]{x1D700}$
-based assessment, but avoids invoking an arbitrary
 $\unicode[STIX]{x1D700}$
cutoff to classify the
 $\unicode[STIX]{x1D700}\approx 1$
cases). Considering the results at both
 $Re_{\unicode[STIX]{x1D6E4}}=5000$
and
 $Re_{\unicode[STIX]{x1D6E4}}=1000$
, it is observed that entrainment only occurs if the stronger vortex achieves a maximum
 $(S/\unicode[STIX]{x1D714})_{2,max}\geqslant 0.138$
prior to the end of detrainment and never occurs for
 $(S/\unicode[STIX]{x1D714})_{2,max}\leqslant 0.132$
, suggesting a critical
 $(S/\unicode[STIX]{x1D714})_{cr}\approx 0.135$
(see figure 12
b), which is comparable to the relatively consistent mean value of starting
 $(S/\unicode[STIX]{x1D714})_{1}=0.147$
with an average deviation of 0.016 (figure 12
a). The scatter in the starting
 $(S/\unicode[STIX]{x1D714})_{1}$
values in the present study is attributed to imprecision in determining the exact starting time (see § 4). Thus, the critical value
 $(S/\unicode[STIX]{x1D714})_{cr}\approx 0.135$
generally characterizes the onset of detrainment of Gaussian vortices having
 $Re_{\unicode[STIX]{x1D6E4}}$
in the range considered in this study.
Results for the relative straining at each vortex with indication of occurrence of detrainment: (a)
 $(S/\unicode[STIX]{x1D714})_{1}$
versus
 $MP$
at
 $t_{start}^{\ast }$
, (b) maximum
 $(S/\unicode[STIX]{x1D714})_{2}$
prior to the end of detrainment
 $t_{det}^{\ast }$
versus
 $MP$
.
 $Re_{\unicode[STIX]{x1D6E4}}=5000$
: ▫: merger,
 $+$
: straining out.
 $Re_{\unicode[STIX]{x1D6E4}}=1000$
: ♢: merger,
 $\times$
: straining out. Dashed line indicates the critical
 $(S/\unicode[STIX]{x1D714})_{cr}=0.135,$
obtained from (b) (see § 6). Merger and straining out assessed by occurrence of entrainment phase and lack thereof respectively.

A critical strain rate to vorticity ratio has also been considered in a number of related studies. Le Dizès & Laporte (Reference Le Dizès and Laporte2002) and Le Dizès & Verga (Reference Le Dizès and Verga2002) showed that a similar quantity evaluated in the co-rotating frame is a leading-order approximation of the eccentricity of streamlines near the centre of an elliptical Gaussian vortex, i.e. a local eccentricity. Brandt & Nomura (Reference Brandt and Nomura2010) identified a critical value of their strain rate parameter (the strain rate evaluated at the central hyperbolic point in the co-rotating frame) that characterized the start of detrainment. Their results also show that start of detrainment corresponds to an approximately consistent local eccentricity
 $\unicode[STIX]{x1D700}_{l}\approx 0.2$
at the start of interaction (compare their figures 6a and 8), equivalent to
 $(S/\unicode[STIX]{x1D714})\approx 0.14$
(although here
 $(S/\unicode[STIX]{x1D714})$
is not evaluated in the co-rotating frame), which is similar to the observed
 $(S/\unicode[STIX]{x1D714})_{cr}\approx 0.135$
in the present study. Mariotti, Legras & Dritschel (Reference Mariotti, Legras and Dritschel1994) considered the similar phenomenon of vortex stripping of a single vortex by external adverse shear and likewise found a comparable critical ratio of strain rate to vorticity, equivalent to
 $S/\unicode[STIX]{x1D714}\approx 0.095$
in the present study, and moreover found this value to be consistent over a range of
 $Re_{\unicode[STIX]{x1D6E4}}$
, i.e. that this ‘stripping’ (and ultimately vortex breakup) is an inviscid mechanism, even in viscous flow. Trieling et al. (Reference Trieling, Velasco Fuentes and van Heijst2005) utilized a similar critical strain rate to characterize the boundary between complete and partial straining-out regimes in inviscid flow, relating the critical shear required to destroy the weaker vortex to a critical separation distance. This effectively distinguished partial (two vortices survive) and complete (one vortex completely destroyed) straining-out cases in inviscid flow for EPUA and UPEA pairs having small radius ratio
 $R_{2}/R_{1}$
and small peak vorticity ratio
 $\unicode[STIX]{x1D714}_{1}/\unicode[STIX]{x1D714}_{2}$
, respectively, for distributed vortices having various vorticity distributions, including a Gaussian profile. Since viscous effects in the present study reduce
 $\unicode[STIX]{x1D714}$
in
 $(S/\unicode[STIX]{x1D714})$
, the critical value
 $(S/\unicode[STIX]{x1D714})_{cr}$
(directly related to critical separation distance for symmetric merger; see (6.2)–(6.3)) is always attained by at least one of the vortices which is ultimately destroyed, precluding two-vortex outcomes. Trieling et al. (Reference Trieling, Velasco Fuentes and van Heijst2005) attributed the inefficacy of this criterion for pairs of low asymmetry (i.e. those having higher
 $R_{2}/R_{1}$
or
 $\unicode[STIX]{x1D714}_{1}/\unicode[STIX]{x1D714}_{2}$
) to spatial effects and captured circulation by the stronger vortex altering its induced strain. In light of the present analysis, it is suggested that this could be attributed to the mutual detrainment of both vortices activating the convective entrainment mechanism before either is completely destroyed (i.e. before the critical
 $(S/\unicode[STIX]{x1D714})$
for vortex destruction in inviscid flow is reached).
7 Comparison with experimental results and
 $Re_{\unicode[STIX]{x1D6E4}}$
effects

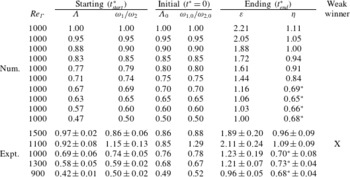
A series of UPEA numerical simulations at
 $Re_{\unicode[STIX]{x1D6E4}}=1000$
are performed in order to facilitate comparison with available experimental data. The simulation parameters and results are summarized in table 2. Contour plots for illustrative cases (symmetric
 $\unicode[STIX]{x1D6EC}=1.0$
and UPEA
 $\unicode[STIX]{x1D6EC}=0.88$
, 0.67), corresponding to those for
 $Re_{\unicode[STIX]{x1D6E4}}=5000$
in figure 2, are presented in figure 13. It is clear that diffusion and the onset of detrainment occur more rapidly for each case than in the comparable higher-
 $Re_{\unicode[STIX]{x1D6E4}}$
case. These basic effects are also seen in the evolutions of
 $A_{II}(t)$
and
 $\unicode[STIX]{x1D6E4}_{II}(t)$
(figure 14
a,b; symmetric case not shown). Otherwise, these results exhibit qualitatively similar features indicating that the flows experience the same underlying processes.
Summary of parameters and results for
 $Re_{\unicode[STIX]{x1D6E4}}=1000$
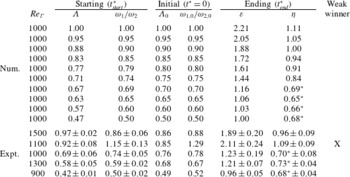
computational simulations (‘Num.’) and laboratory experiments (‘Expt.’). Here all numerical cases are UPEA cases.
 $\unicode[STIX]{x1D700}$
and
 $\unicode[STIX]{x1D702}$
are evaluated at
 $t_{end}^{\ast }$
. Starting
 $\unicode[STIX]{x1D6EC}=\unicode[STIX]{x1D6E4}_{1}/\unicode[STIX]{x1D6E4}_{2}$
is evaluated at
 $t_{start}^{\ast }$
. Due to the nature of the experiments, only
 $\unicode[STIX]{x1D6EC}_{0}$
was controlled in the initial condition.
 $\ast$
indicates that the ‘straining-out’ regime has been reached and
 $\unicode[STIX]{x1D702}$
is therefore not a meaningful physical quantity. ‘Weak winner’ indicates that the peak of the weaker initial vortex becomes the peak of the resulting post-interaction vortex (see § 5). Margins of error for the experimental cases correspond to extrema of error bars in figure 16 (for details see § 7).
Vorticity contours at the initial condition and key times during the interaction for (a) Symmetric (
 $\unicode[STIX]{x1D6EC}_{0}=1.0$
) and UPEA (b)
 $\unicode[STIX]{x1D6EC}=0.88$
(
 $\unicode[STIX]{x1D6EC}_{0}=0.90$
) and (c)
 $\unicode[STIX]{x1D6EC}=0.67$
(
 $\unicode[STIX]{x1D6EC}_{0}=0.70$
) cases at
 $Re_{\unicode[STIX]{x1D6E4}}=1000$
. The first row depicts the vorticity contours of the total flow, and the second row depicts the vorticity contours within the region considered ‘core’ using
 $II>II_{t}$
(see § 4). See figure 2 for meanings of columns.

Time development of normalized aggregate core area
 $A_{II}(t)/A_{II,0}$
and circulation
 $\unicode[STIX]{x1D6E4}_{II}(t)/\unicode[STIX]{x1D6E4}_{II,0}$
(
 $II>II_{t}$
) for
 $Re_{\unicode[STIX]{x1D6E4}}=1000$
numerical cases (a)
 $\unicode[STIX]{x1D6EC}=0.88$
and (b)
 $\unicode[STIX]{x1D6EC}=0.67$
, and comparable experimental cases (c)
 $\unicode[STIX]{x1D6EC}\approx 0.97$
,
 $Re_{\unicode[STIX]{x1D6E4}}\approx 1500$
and (d)
 $\unicode[STIX]{x1D6EC}\approx 0.69$
,
 $Re_{\unicode[STIX]{x1D6E4}}\approx 1000$
. Note that the ‘initial’ time for (c) and (d), i.e. time of evaluation of
 $X_{II,0}$
quantities, corresponds to the time at which vortices are judged to have formed.

The most significant implication of decreasing
 $Re_{\unicode[STIX]{x1D6E4}}$
is to increase
 $MP_{cr}$
(
 ${\approx}2.15\pm 0.16$
) and increase
 $(Z_{2}/Z_{1})_{cr}$
(
 ${\approx}2.00\pm 0.14$
) relative to the
 $Re_{\unicode[STIX]{x1D6E4}}=5000$
case, as indicated in the plots of
 $\unicode[STIX]{x1D700}$
and
 $\unicode[STIX]{x1D702}$
versus
 $MP$
and
 $Z_{2}/Z_{1}$
for
 $Re_{\unicode[STIX]{x1D6E4}}=1000$
(figures 9 and 11). Careful examination of the
 $\unicode[STIX]{x1D6E4}_{II}(t)$
and vorticity contour plots for all the simulations verifies that an entrainment process occurs in some low-
 $Re_{\unicode[STIX]{x1D6E4}}$
cases where there is none at the corresponding high
 $Re_{\unicode[STIX]{x1D6E4}}$
case with similar
 $\unicode[STIX]{x1D6EC}$
and
 $\unicode[STIX]{x1D714}_{1}/\unicode[STIX]{x1D714}_{2}$
. As discussed in the previous section,
 $(S/\unicode[STIX]{x1D714})_{cr}\approx 0.135$
is consistent for both
 $Re_{\unicode[STIX]{x1D6E4}}$
considered (see figure 12). The increase of
 $MP_{cr}$
with decreasing
 $Re_{\unicode[STIX]{x1D6E4}}$
is therefore attributed to the more rapid diffusion enabling comparatively stronger vortices to achieve
 $(S/\unicode[STIX]{x1D714})_{cr}$
by reducing
 $\unicode[STIX]{x1D714}$
more quickly. This is consistent with the results of Mariotti et al. (Reference Mariotti, Legras and Dritschel1994) for a single vortex, which indicate that the critical
 $S/\unicode[STIX]{x1D714}$
for vortex breakup by erosion, found to be independent of
 $Re_{\unicode[STIX]{x1D6E4}}$
, is reached more quickly for lower
 $Re_{\unicode[STIX]{x1D6E4}}$
. Although the case of interacting vortices is more complex, the processes underlying the onset of detrainment are similar (Kimura & Herring Reference Kimura and Herring2001; Brandt & Nomura Reference Brandt and Nomura2006). Additional effects of reducing
 $Re_{\unicode[STIX]{x1D6E4}}$
may include an increase in
 $\unicode[STIX]{x1D700}$
values as a result of the earlier onset of detrainment potentially reducing the amount of filamentation that can occur (although such a reduction is difficult to quantify), as well as increased diffusion of vorticity directly from one vortex into the other (although this effect is considered to be minor since the vortices are well-separated prior to convective merging, which then occurs on a much more rapid time scale than diffusion).
The numerical results are compared with digital particle image velocimetry (DPIV) data taken from water tank experiments of co-rotating symmetric and asymmetric vortex pairs (see Meunier Reference Meunier2001; Meunier et al.
Reference Meunier, Ehrenstein, Leweke and Rossi2002). The vortices are generated impulsively by the rotation of sharp-edged flat plates about their vertical axes such that they behave as laminar, two-dimensional vortices without axial velocity in the observation volume, with
 $\unicode[STIX]{x1D6EC}_{0}$
adjusted by varying the relative angular velocity of the plates. The experimental cases are summarized in table 2. The
 $\unicode[STIX]{x1D6EC}_{0}$
value is evaluated at the time at which the vortices are judged to have become coherent and detached from the flaps by visual examination (which may differ slightly from Meunier et al.
Reference Meunier, Ehrenstein, Leweke and Rossi2002). The starting
 $\unicode[STIX]{x1D6EC}$
value in each case is the average of the highest and lowest of several possible
 $\unicode[STIX]{x1D6EC}$
values computed using different plausible choices of starting time in order to minimize the effect of the variability in these values (since with noisy data slight differences in choice of start/end times can have a relatively pronounced effect).
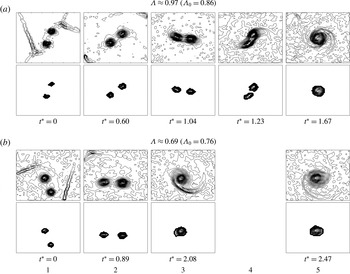
Contours of vorticity comparable to those in figure 13 are presented in figure 15 for the
 $\unicode[STIX]{x1D6EC}\approx 0.97$
,
 $Re_{\unicode[STIX]{x1D6E4}}\approx 1500$
and
 $\unicode[STIX]{x1D6EC}\approx 0.69$
,
 $Re_{\unicode[STIX]{x1D6E4}}\approx 1000$
experimental cases. The oblong structures visible at the early times are the plates that produce the vortices and should be disregarded. Despite the noise, these appear qualitatively similar to those of the comparable numerical cases.
PIV results for experimental cases having (a)
 $\unicode[STIX]{x1D6EC}\approx 0.97$
,
 $Re_{\unicode[STIX]{x1D6E4}}\approx 1500$
and (b)
 $\unicode[STIX]{x1D6EC}\approx 0.69$
,
 $Re_{\unicode[STIX]{x1D6E4}}\approx 1000$
. The first row depicts the vorticity contours of the entire flow and the second row depicts the vorticity contours of the portion considered ‘core’ using
 $II>II_{t}$
. See figure 2 for meanings of columns. Note that the ‘initial condition’ corresponds to the time at which vortices are judged to have formed.

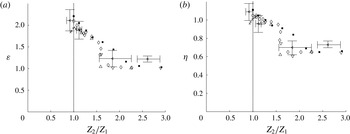
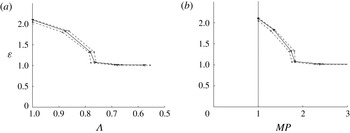
Plots of
 $A_{II}(t)$
and
 $\unicode[STIX]{x1D6E4}_{II}(t)$
for the experimental results are presented in figure 14(c,d) along with the
 $Re_{\unicode[STIX]{x1D6E4}}=1000$
numerical cases. No smoothing or averaging has been applied to the experimental data, but despite the noise they qualitatively resemble those of the comparable numerical cases: the
 $A_{II}(t)$
of both experimental cases suggest a linear growth at first, then nonlinear behaviour before returning to linear viscous growth, while
 $\unicode[STIX]{x1D6E4}_{II}(t)$
of both appears to grow slightly at first (attributed to the method used to create the vortices) followed by a decline to a local minimum, then a spike in the
 $\unicode[STIX]{x1D6EC}\approx 0.97$
case but not in the
 $\unicode[STIX]{x1D6EC}\approx 0.69$
case, followed by relatively smooth nonlinear behaviour. These features are interpreted to correspond to the diffusive, convective and final phases of interaction that are observed in the numerical cases. The longer diffusive phase in the experimental
 $\unicode[STIX]{x1D6EC}\approx 0.69$
case (compared to the numerical
 $\unicode[STIX]{x1D6EC}=0.67$
,
 $Re_{\unicode[STIX]{x1D6E4}}=1000$
case) is attributed to its having a somewhat lower initial aspect ratio
 $a_{0}/b_{0}$
.
Results for
 $\unicode[STIX]{x1D700}$
and
 $\unicode[STIX]{x1D702}$
for the experimental cases are summarized in table 2 and plotted with the low- and high-
 $Re_{\unicode[STIX]{x1D6E4}}$
numerical results in figure 16. As with
 $\unicode[STIX]{x1D6EC}$
, for each case several
 $\unicode[STIX]{x1D700}$
and
 $\unicode[STIX]{x1D702}$
were computed using a number of plausible choices for ending times due to the noise in the data. The integrated quantity
 $Z_{2}/Z_{1}$
is used to examine the trends since the local quantities
 $(S/\unicode[STIX]{x1D714})$
and
 $MP$
are too uncertain to give meaningful results. The experimental results in figure 16 are shown with horizontal error bars indicating the maximum and minimum plausible
 $Z_{2}/Z_{1}$
and vertical error bars indicating the maximum and minimum potential
 $\unicode[STIX]{x1D700}$
and
 $\unicode[STIX]{x1D702}$
within this range, and
 $\unicode[STIX]{x1D700}$
and
 $\unicode[STIX]{x1D702}$
plotted at the midpoint. It is noted that one experimental case (
 $\unicode[STIX]{x1D6EC}\approx 0.92$
with
 $\unicode[STIX]{x1D714}_{1}/\unicode[STIX]{x1D714}_{2}>1$
,
 $Re_{\unicode[STIX]{x1D6E4}}\approx 1100$
) is a UPUA weak-winner case. Despite the limitations of the data, the experimental values are in reasonable accordance with the numerical results.
Results for
 $\unicode[STIX]{x1D700}$
and
 $\unicode[STIX]{x1D702}$
versus enstrophy ratio,
 $Z_{2}/Z_{1}$
: (a)
 $\unicode[STIX]{x1D700}$
versus
 $Z_{2}/Z_{1}$
and (b)
 $\unicode[STIX]{x1D702}$
versus
 $Z_{2}/Z_{1}$
, for all cases. For the
 $Re_{\unicode[STIX]{x1D6E4}}=5000$
cases, ▿: UPEA; ▵: EPUA; ♢: UPUA, stronger wins;
 $\times$
: UPUA, weaker wins; ○: no winner. For the
 $Re_{\unicode[STIX]{x1D6E4}}=1000$
cases, ▪: UPEA; ●: no winner. The experimental results are indicated by
 ${\vartriangleleft}$
with error bars, see § 7 for explanation.

8 Summary and discussion
The interactions of two unequal co-rotating vortices in viscous fluid have been further investigated and for the first time, their outcomes quantitatively assessed. A new parameterization of the possible interaction outcomes has been developed. Numerical simulations were performed to consider a range of vortex strength ratios,
 $\unicode[STIX]{x1D6EC}=\unicode[STIX]{x1D6E4}_{1}/\unicode[STIX]{x1D6E4}_{2}\leqslant 1$
, corresponding to vortices of differing size and/or peak vorticity, and with
 $Re_{\unicode[STIX]{x1D6E4}}=5000$
. An additional set of simulations at lower
 $Re_{\unicode[STIX]{x1D6E4}}$
was also performed in order to compare with available data from the experiments of Meunier (Reference Meunier2001).
The primary convective interaction between the two vortices is initiated by the induced strain of each vortex on the other, and in viscous flow, leads to a single vortex. The post-interaction vortex is quantitatively assessed in terms of an enhancement factor,
 $\unicode[STIX]{x1D700}=\unicode[STIX]{x1D6E4}_{end}/\unicode[STIX]{x1D6E4}_{2,start}$
, and a corresponding merging efficiency,
 $\unicode[STIX]{x1D702}=\unicode[STIX]{x1D6E4}_{end}/\unicode[STIX]{x1D6E4}_{total,start}$
, similar to the analysis of inviscid flow by Dritschel & Waugh (Reference Dritschel and Waugh1992), which compare the vortex strengths at the start and end of the convective interaction. An effective parameterization is developed by characterizing the degree of mutuality of the interaction with the mutuality parameter,
 $MP\equiv (S/\unicode[STIX]{x1D714})_{1}/(S/\unicode[STIX]{x1D714})_{2}$
, where the relative straining
 $(S/\unicode[STIX]{x1D714})_{i}$
, evaluated at the start of the interaction, is an indicator for core detrainment of each vortex.
Analysis of the simulation results demonstrates the general description: two vortices will undergo mutual entrainment (merger) if
 $MP$
is sufficiently close to unity, i.e. within some critical value,
 $MP_{cr}$
. For the present results,
 $MP_{cr}\approx 1.8$
for
 $MP>1$
(stronger vortex dominates). Asymmetric merger with
 $MP_{cr}<MP<1$
may also occur, and in this case the originally weaker vortex dominates and survives enhanced. Symmetric merger (
 $MP=1$
) is the limiting case of a fully two-way reciprocal interaction with
 $\unicode[STIX]{x1D700}\sim 2$
and correspondingly,
 $\unicode[STIX]{x1D702}\sim 1$
; the most efficient merger. As
 $MP$
increasingly deviates from unity, both
 $\unicode[STIX]{x1D700}$
and
 $\unicode[STIX]{x1D702}$
diminish until
 $MP\sim MP_{cr}$
, beyond which
 $\unicode[STIX]{x1D700}\approx 1$
and the interaction is essentially one-way; entrainment does not occur and the dominating vortex erodes the other away (straining out) and survives relatively unaffected. The enstrophy ratio
 $Z_{2}/Z_{1}$
is found to characterize the behaviour of
 $\unicode[STIX]{x1D700}$
and
 $\unicode[STIX]{x1D702}$
similarly to
 $MP$
overall, although it is somewhat less effective at distinguishing the weak-winner regime. Results also indicate that core detrainment is initiated when
 $(S/\unicode[STIX]{x1D714})_{i}$
reaches a critical value of
 $(S/\unicode[STIX]{x1D714})_{cr}\approx 0.135$
. A simple analysis shows that
 $(S/\unicode[STIX]{x1D714})_{i}$
can be related to
 $\unicode[STIX]{x1D6EC}$
and
 $a_{i}/b$
. In the case of symmetric merger, this is consistent with the initiation of detrainment corresponding to the critical aspect ratio,
 $(a/b)_{cr}$
, which is inevitably achieved in viscous flow. This may then also explain, more generally, why the outcome of interactions in viscous flow is always a single vortex: diffusion of core vorticity will weaken the cores so that eventually
 $(S/\unicode[STIX]{x1D714})_{cr}$
is attained by at least one of the vortices, which in time becomes completely eroded.
These observations generally hold for the lower
 $Re_{\unicode[STIX]{x1D6E4}}$
simulations and for the available experimental data. Since initiation of detrainment is essentially an inviscid mechanism, we may expect the value of
 $(S/\unicode[STIX]{x1D714})_{cr}$
to remain constant with
 $Re_{\unicode[STIX]{x1D6E4}}$
, as the present results support. However, the value of
 $MP_{cr}$
(and
 $(Z_{2}/Z_{1})_{cr}$
) is found to vary somewhat (favouring merger) as
 $Re_{\unicode[STIX]{x1D6E4}}$
decreases. Since
 $MP$
may be considered a ratio of time scales, i.e. the disparity in timing for detrainment to be established in each of the vortices, this is influenced by viscous effects. With decreasing
 $Re_{\unicode[STIX]{x1D6E4}}$
, the more rapid diffusion of vorticity will accelerate the achievement of
 $(S/\unicode[STIX]{x1D714})_{cr}$
so that more disparate vortices may still both detrain within the interaction time.
The present results have implications for two-dimensional turbulence. The observation that in asymmetric interactions, one of the original vortices essentially survives with its peak becoming that of the post-interaction vortex, may explain the noted persistence of vorticity extrema throughout the evolution of turbulent flow (McWilliams Reference McWilliams1990; Carnevale et al. Reference Carnevale, McWilliams, Pomeau, Weiss and Young1991, Reference Carnevale, McWilliams, Pomeau, Weiss and Young1992; Dritschel et al. Reference Dritschel, Scott, Macaskill, Gottwald and Tran2008). Moreover, the findings of the present study show how the peak of the post-interaction vortex can be related directly to the original pair, which in principle allows for modelling and perhaps analytical consideration of two-dimensional turbulent flows having vortices of varying peak vorticity. Such analysis remains for future work.
The present findings also suggest that the simple transformation rule utilized in a number of point vortex models of two-dimensional turbulence to incorporate vortex merging may not accurately reflect the enhancement produced by interactions of real vortices. This rule is derived from conservation of energy and typically takes the form
 $\unicode[STIX]{x1D6E4}_{A}^{2}+\unicode[STIX]{x1D6E4}_{B}^{2}=\unicode[STIX]{x1D6E4}_{C}^{2}$
, where
 $A$
and
 $B$
are the interacting vortices and
 $C$
is the resulting vortex, which ‘replaces’
 $A$
and
 $B$
to emulate merging (Carnevale et al.
Reference Carnevale, McWilliams, Pomeau, Weiss and Young1991; Riccardi et al.
Reference Riccardi, Piva and Benzi1995; Sire et al.
Reference Sire, Chavanis and Sopik2011). This expression can be written in terms of enhancement as
 $1+\unicode[STIX]{x1D6EC}^{2}=\unicode[STIX]{x1D700}_{model}^{2}$
by dividing by the
 $\unicode[STIX]{x1D6E4}$
of the stronger initial vortex, and it can be seen that this generally underestimates the enhancement produced by symmetric or slightly asymmetric mergers (e.g. for symmetric pairs,
 $\unicode[STIX]{x1D700}_{model}=1.41$
but observed
 $\unicode[STIX]{x1D700}\approx 2$
), but overestimates the enhancement produced by very asymmetric pairs (e.g. for the
 $\unicode[STIX]{x1D6EC}=0.7$
UPEA case,
 $\unicode[STIX]{x1D700}_{model}=1.22$
but observed
 $\unicode[STIX]{x1D700}\approx 1$
). It is emphasized that this theory was never intended to be precise at the level of individual interactions, but it is nevertheless at odds with the findings of isolated vortex pair studies. Trieling et al. (Reference Trieling, Velasco Fuentes and van Heijst2005) reported a similar finding and proposed that conservation of circulation may be more accurate, although they found this overestimates the enhancement produced by straining-out interactions, a finding supported by the rapid diminishing of
 $\unicode[STIX]{x1D702}$
with increasing
 $MP$
(and
 $Z_{2}/Z_{1}$
) observed here.
Based on the present findings, it is suggested that a simple binary transformation rule could improve accuracy without adding prohibitive complication: when
 $(S/\unicode[STIX]{x1D714})$
of a vortex in a two-dimensional turbulent flow exceeds
 $(S/\unicode[STIX]{x1D714})_{cr}$
(
 ${\approx}0.135$
), this value is compared with the
 $(S/\unicode[STIX]{x1D714})$
of the nearest vortex to determine
 $MP$
. If
 $MP<MP_{cr}$
, the merger conserves circulation, i.e. the two vortices
 $A$
and
 $B$
are replaced with a single vortex
 $C$
having circulation
 $\unicode[STIX]{x1D6E4}_{C}=\unicode[STIX]{x1D6E4}_{A}+\unicode[STIX]{x1D6E4}_{B}$
. If
 $MP>MP_{cr}$
, the stronger’s circulation is preserved, i.e.
 $\unicode[STIX]{x1D6E4}_{C}=\unicode[STIX]{x1D6E4}_{A}$
, where
 $\unicode[STIX]{x1D6E4}_{A}>\unicode[STIX]{x1D6E4}_{B}$
. Further study is needed to determine
 $MP_{cr}$
as a function of
 $Re_{\unicode[STIX]{x1D6E4}}$
, but it is expected that for most typical flows values of
 $MP_{cr}$
in the range presented here will constitute reasonably accurate choices. A more nuanced transformation rule, perhaps incorporating the continuous variation of
 $\unicode[STIX]{x1D700}$
and
 $\unicode[STIX]{x1D702}$
with
 $MP$
and/or incorporating the concept of interaction winners, could also be considered. This remains for future work.
One major aspect of two-dimensional turbulence not considered in this study is the influence of the surrounding vortices in the flow on the interacting pair, which could be simply approximated by an imposed external strain. Although a few studies have considered the effect of a background flow on the interactions of symmetric vortex pairs (see, e.g. Maze et al. Reference Maze, Carton and Lapeyre2004; Perrot & Carton Reference Perrot and Carton2010; Trieling, Dam & van Heijst Reference Trieling, Dam and van Heijst2010; Folz & Nomura Reference Folz and Nomura2014), none have considered the case of asymmetric pairs. Such a study, using the present analysis framework, is currently in progress by the authors.
Acknowledgements
The authors gratefully acknowledge Dr P. Meunier for providing his experimental data and for his helpful support and feedback. We also acknowledge Dr P. Orlandi for providing the code used for the EPUA simulations, Dr G. Carnevale for providing invaluable discussion and feedback and Mr M. Corson for his preliminary analysis of the experimental data.
Appendix A. Details of the assessment method
A method to quantitatively assess the interaction outcomes was presented in § 4. Here, further details of the method are provided, and the sensitivity of the assessment to key parameter values is examined.
A.1 Effect of choice of
$II_{t}^{\ast }$

In general, values of
 $II_{t}^{\ast }=0.01{-}0.15$
are found to approximately correspond to the values of
 $II|_{r=a}/II_{peak}$
at
 $a_{\unicode[STIX]{x1D714}}$
and the characteristic radius based on the azimuthal velocity maximum,
 $a_{\unicode[STIX]{x1D703}}$
, for a vortex in a co-rotating pair and therefore effectively capture what has commonly been considered to be the ‘core’ in prior vortex merger studies (e.g. Meunier et al.
Reference Meunier, Ehrenstein, Leweke and Rossi2002; Brandt & Nomura Reference Brandt and Nomura2007). For all choices of
 $II_{t}^{\ast }$
within this range, the time development of
 $A_{II}(t)$
and
 $\unicode[STIX]{x1D6E4}_{II}(t)$
proceeds similarly and yields quantitatively similar values for
 $\unicode[STIX]{x1D700}$
and
 $\unicode[STIX]{x1D702}$
for a given case and choice of (
 $t_{start}$
,
 $t_{end}$
).
For this study, the value of
 $II_{t}=0.10$
was chosen due to its correspondence with the characteristic vortex radius based upon second moment of vorticity,
 $a_{\unicode[STIX]{x1D714}}$
. For a single isolated axisymmetric Gaussian vortex,
 $II^{\ast }=II(r)/II_{peak}=(\unicode[STIX]{x1D714}(r)^{2}/2-S_{r\unicode[STIX]{x1D703}}(r)^{2})/(\unicode[STIX]{x1D714}_{peak}^{2}/2)$
because there is zero strain at the location of the peak. Evaluating this using expressions for the vorticity distribution
 $\unicode[STIX]{x1D714}(r)=\unicode[STIX]{x1D714}_{peak}\exp (-r^{2}/a_{\unicode[STIX]{x1D714}}^{2})$
and strain distribution
 $S_{r\unicode[STIX]{x1D703}}=a_{\unicode[STIX]{x1D714}}^{2}(\unicode[STIX]{x1D714}_{peak}/2)[-1/r^{2}+(1/a_{\unicode[STIX]{x1D714}}^{2}+1/r^{2})\exp (-r^{2}/a_{\unicode[STIX]{x1D714}}^{2})]$
at
 $r=a_{\unicode[STIX]{x1D714}}$
implies a value for
 $II^{\ast }=0.10$
(Saffman Reference Saffman2001).
For
 $II_{t}^{\ast }>0.15$
, the behaviour of
 $A_{II}(t)$
and
 $\unicode[STIX]{x1D6E4}_{II}(t)$
for asymmetric
 $\unicode[STIX]{x1D6EC}>\unicode[STIX]{x1D6EC}_{cr}$
cases exhibits significant qualitative change as
 $II_{t}^{\ast }$
increases, losing the characteristic entrainment spike and resembling the straining-out case, and eventually exhibiting essentially single vortex behaviour when
 $II_{t}^{\ast }$
is so high that the weaker vortex is not counted at all, even in the initial condition. Note that the portion counted by
 $II_{t}^{\ast }$
in the initial condition in this manner may belong to the losing vortex, in certain UPUA cases. Choosing
 $II_{t}^{\ast }>0.15$
therefore can affect the computed values of
 $\unicode[STIX]{x1D700}$
, and so are not used in this study and not recommended in general. In the other extreme case, approximately
 $II_{t}^{\ast }<0.01$
, the threshold captures too much of the low-level vorticity surrounding the core, and so this threshold cannot be said to capture what is commonly considered to be the ‘vortex core’. Example results for various
 $II_{t}^{\ast }$
are tabulated in table 3.
Effect of
 $II_{t}^{\ast }$
on computed
 $\unicode[STIX]{x1D700}$
values for UPEA cases having various values of
 $\unicode[STIX]{x1D6EC}_{0}$
at
 $Re_{\unicode[STIX]{x1D6E4}}=5000$
.
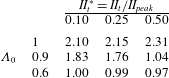
A.2 Effect of choice of
$t_{start}^{\ast }$

The influence of choice of
 $t_{start}^{\ast }$
on the assessment was examined by computing
 $\unicode[STIX]{x1D700}$
and
 $\unicode[STIX]{x1D702}$
using several alternative choices of
 $t_{start}^{\ast }$
in the vicinity of the departure from linear
 $A_{II}(t)$
growth (using
 $II_{t}^{\ast }=0.10$
and maintaining the same choice of
 $t_{end}^{\ast }$
for a given case as was used in the main body of this study). Results are presented in figure 17. Even when the most extreme plausible values of
 $t_{start}^{\ast }$
are used (approximately 37 % earlier and 15 % later than the selected
 $t_{start}^{\ast }$
), a maximum
 $\unicode[STIX]{x1D700}$
deviation of only 2.4 % was observed relative to the canonical value of
 $\unicode[STIX]{x1D700}$
(i.e. that used in the main body of the study) for the UPEA cases (EPUA and UPUA cases were not tested). Moreover, a similar general trend was found for
 $\unicode[STIX]{x1D700}$
(and
 $\unicode[STIX]{x1D702}$
, not pictured) with respect to
 $\unicode[STIX]{x1D6EC}$
and
 $MP$
for all
 $t_{start}^{\ast }$
considered (see figure 17), indicating that the choice of
 $t_{start}^{\ast }$
has little influence on the findings discussed in the present study.
Collected results for
 $\unicode[STIX]{x1D700}$
of UPEA as a function of (a)
 $\unicode[STIX]{x1D6EC}$
and (b)
 $MP$
for various choices of
 $t_{start}^{\ast }$
,
 $II_{t}^{\ast }=0.10$
,
 $Re_{\unicode[STIX]{x1D6E4}}=5000$
. Solid line with ▿ indicates
 $t_{start}^{\ast }$
as selected in the main body (figures 7 and 9);
 $+$
indicates earlier choice of
 $t_{start}^{\ast }$
,
 $\times$
indicates later choice of
 $t_{start}^{\ast }$
.

Collected results for
 $\unicode[STIX]{x1D700}$
of UPEA cases as a function of (a)
 $\unicode[STIX]{x1D6EC}$
and (b)
 $MP$
for various choices of
 $t_{end}^{\ast }$
,
 $II_{t}^{\ast }=0.10$
,
 $Re_{\unicode[STIX]{x1D6E4}}=5000$
. ▿ indicates
 $t_{end}^{\ast }$
as selected in the main body (figures 7 and 9), ♢ indicates
 $t_{det}^{\ast }$
used for all cases, ▫ indicates
 $t_{single}^{\ast }$
used for all cases. Note that these methods give identical results in the straining-out regime.

A.3 Effect of choice of
$t_{end}^{\ast }$

Likewise, the effect of choice of
 $t_{end}^{\ast }$
was examined by considering two alternative choices:
 $t_{det}^{\ast }$
for every case, since it constitutes a consistent objective time identifiable in every case even though it does not mark the ‘end’ of the interaction for cases in which entrainment occurs, as well as a time
 $t_{single}^{\ast }$
subsequent to both
 $t_{det}^{\ast }$
and
 $t_{ent}^{\ast }$
at which the final vortex is judged to have formed (using
 $II_{t}^{\ast }=0.10$
and maintaining the same choice of
 $t_{start}^{\ast }$
for a given case as was used in the main body of this study). Results are presented in figure 18, where it can be seen that although different choices can give different values of
 $\unicode[STIX]{x1D700}$
and
 $\unicode[STIX]{x1D702}$
(with
 $t_{ent}^{\ast }$
giving somewhat higher values for high
 $\unicode[STIX]{x1D6EC}$
and
 $MP$
near
 $1$
), all three capture essentially the same trend with respect to
 $\unicode[STIX]{x1D6EC}$
and
 $MP$
, and the critical value
 $MP_{cr}$
remains unchanged. Note that this is true even using exclusively
 $t_{det}^{\ast }$
, despite this not being the ‘end’ of interaction for cases in which entrainment occurs.