


Introduction
The British Antarctic Survey (BAS) has access to more than 30 000 vertical aerial photographs of the Antarctic Peninsula (Fig. 1) acquired since 1946. in many areas photographic sorties have been repeated at intervals so that in some places the photography spans 40 years. While compiling maps from this archive, it has become apparent that the snow cover has decreased between the dates of the earlier photographs and later ones of the same area. This is evident in all areas examined, from the northern Antarctic Peninsula southward to Alexander Island.
To document the change, this paper examines one area of the Antarctic Peninsula (the northern part of Marguerite Bay), and the observed decrease in snow cover since the late 1950s or early 1960s is compared with the underlying climatic regime.
In addition to the usefulness of these measurements as an indication of climate change, they may also help to explain other observations. D. A. Peel (personal communication, 1997) has proposed that this increase of exposed ground may be the cause of the higher dust levels seen in ice cores (Reference ThompsonThompson and others, 1994).
Studyarea
To show the pervasive reduction in size of small snow or ice bodies observed throughout the Antarctic Peninsula, we concentrated our investigation on land areas in the northern part of Marguerite Bay. This area was selected for its proximity to locations where long temperature records are available (Adelaide and Rothera research stations), and because it has many sites where aerial photography has been repeated. Study sites were chosen where photography from at
Locations referred to in the text; asterisks denote research stations.

least three seasons was available; where photographs were taken late in the season and where photographs showed no evidence of recent snowfall (i.e. blurring of ice/rock bound-aries and dusting of snow on rock). Where possible, photographs were chosen from the same stage of the season; most are within seven clays of each other, and the use of photographs earlier or later in the season is justified in the discussion. Sites represent a variety of geographic settings; Anchorage Island, Dismal Island, Jenny Island and Lainez Point on Pourquoi Pas Island (Fig. 1). Fox and Thomson (1995) showed that similar changes have taken place at Sto-nington Island and Reference Smith, Vaughan, C. S. M. and A. G.Smith and others (1998) show that the ice ramp at Rothera Point has declined in response to climate change. Although Rothera Point has been a site for meteorological observations since 1976 and comprehensive repeat photography is available from there, it was excluded from this study because human activity at Rothera is likely to have affected the snow cover on the point.
Sources, dales and scales of aerial photography
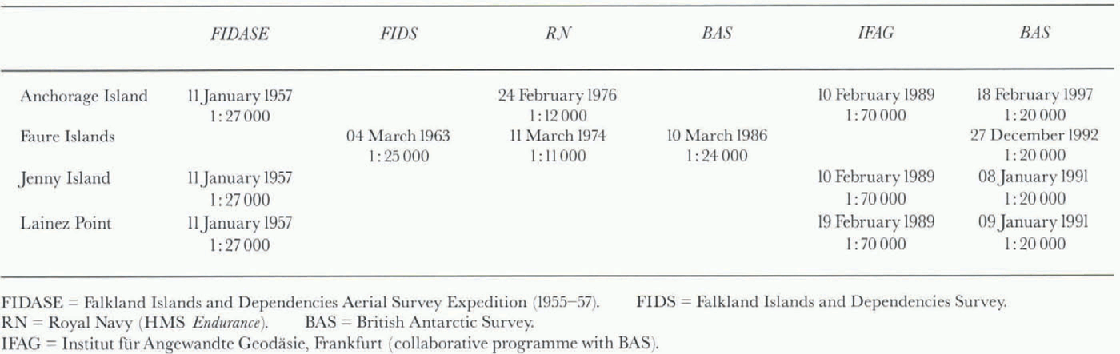
Aerial Photography
Marguerite Bay, a focus for British Antarctic operations since 1946, is one of the most photographed areas of the Antarctic Peninsula. Scientific stations have been located at Horseshoe Island, Stonington Island, and at Adelaide and Rothera Point on Adelaide Island. Nevertheless, no systematic programme of aerial photography has been carried out for the whole of Marguerite Bay. Despite the patchy eoverage, extensive aerial photography is available for some areas, acquired by several organisations at different times and at different scales. The data sources are summarised in Table 1.
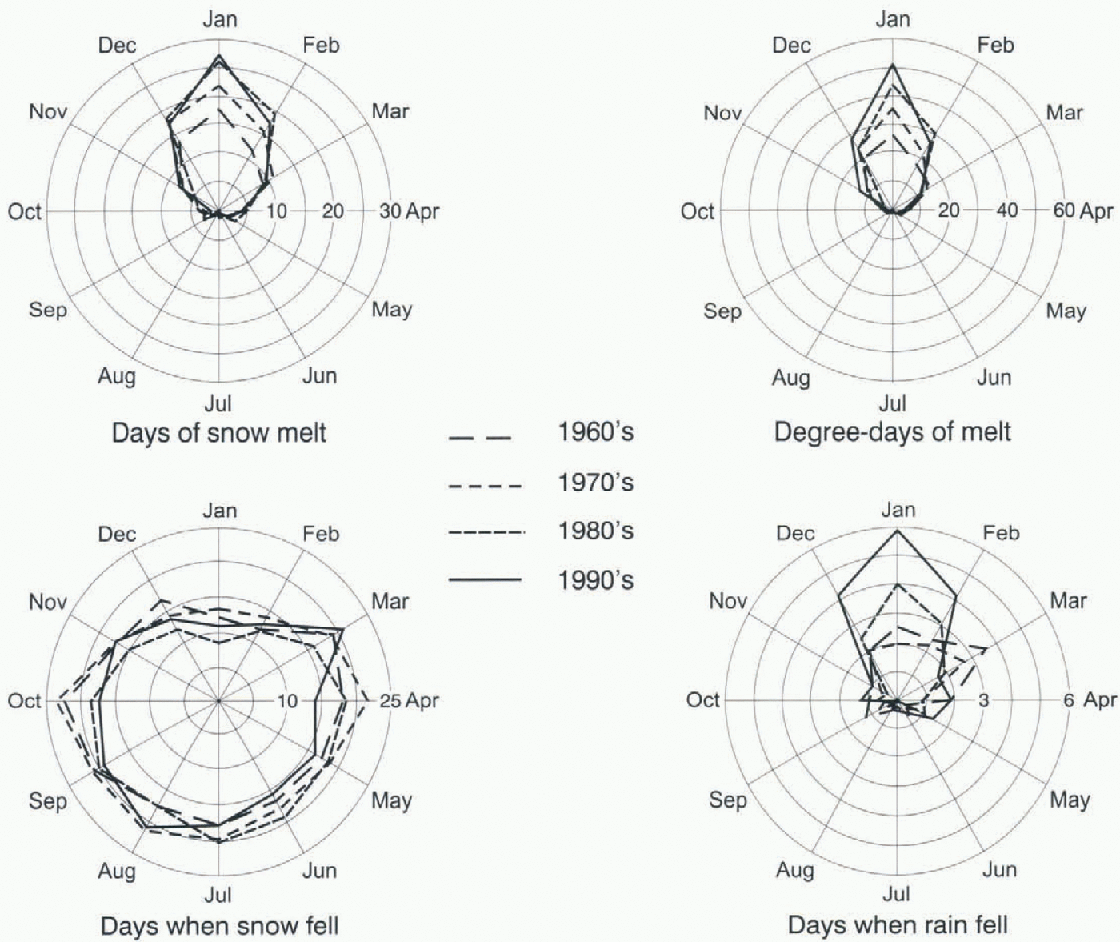
Polar diagrams showing monthly climatic parameters averaged by decade for the four decades since 1960.
Changes in ice cover on Anchorage Island since 1957. Grey is ice, black is exposed rock or moraine.

Maps of the snow extent in each area for every available date were compiled photogrammetrically at BAS. As well as good quality photography, successful photogrammetry requires accurately surveyed ground-control points, i.e. features of known position and height that can be identified on the photographs. The scarcity of ground-control points throughout the Antarctic Peninsula hampers photogram-metric mapping. Except for Anchorage Island, ground control was insufficient for direct photogrammetric plotting from the larger-scale photographs. in these cases the following procedures, described by Fox (1995), were used:
-
1. The smallest-scale photography was chosen (usually 1:70 000; Institut für Angewandte Geodäsie).
-
2. The photographs were oriented to the available control. Where necessary height control from points at sca-lcvel was added at the shoreline and planimetrie control points were extracted from geo-referenced Landsat Thematic Mapper imagery.
-
2. Once the smallest-scale photograph was oriented, sufficient “secondary” control points could be measured from it to allow photogrammetric orientation of the larger-scale photographs.
Using this technique, absolute positioning accuracy is low but the accuracy with which the photo sets are related to each other is high, about 2-3 m (from the error statistics for the photogrammetric orientation of the photo sets). For this study consistency between the datasets is important, to allow valid comparison of the snow cover; absolute positioning accuracy is not essential.
For Dismal Island, insufficient control was identifiable for these procedures tobe followed, so the extent of exposed rock was digitized from the photographs without photogrammetric correction. Because the maximum height of Dismal Island above sea-level (a.s.l.) is about 50 m, this procedure introduced minimal error. The photographs were roughly oriented and scaled using two existing survey points but these could not be identified with certainty. The maps should therefore be regarded as relatively but not absolutely accurate. Internal consistency of the set of maps was assured by matching points at sea-level between photographs from different years.
Changes in ice cover on Dismal Island since 1963. Grey is ice, dark grey is fast ice, black is exposed rock or moraine.

Climate Data
We examined the meteorological records from Adelaide and Rothera research stations. The record from Adelaide extends from I May 1962 to 1 January 1976, and that from Rothera from 8 March 1976 to the present.
Using these records, we determined the mean number of days per month for each decade when the average temperature was above freezing, when snow fell and when rain fell. For days when the temperature was above freezing, we calculated “positive degree-days”, the product of the temperature and number of days (Fig. 2). in broad terms, the number of melting days has increased, the number of positive degree-days has increased, the number of days with snowfall has slightly decreased and summer rainfall has increased. It may also be noteworthy that the early years show much more intcrannual variability than the later years. The increase in summer rainfall is especially significant because rain is very efficient at transferring heat into the snow or ice.
Results
Anchorage Island (Fig. 3)
Anchorage Island is a rocky, low-lying island 3 km long. The highest point is 57 m a.s.l.
Photographic data from four dates are available: 11 January 1957, 24 February 1976,10 February 1989 and 18 February 1997. The total area of snow cover has decreased substantially from 1957 to the present. Snow or ice that filled inlets at A, Β and C in 1957 has melted, allowing the sea to extend further into the island.
Dismal Island (Fig. 4)
The aptly named Dismal Island is the largest of the Faure Islands, a small archipelago of mainly ice-covcrcd islands and skerries. The maximum height is about 50 m a.s.l.
Usable aerial photographs of the Faure Islands are available from: 4 March 1963,11 March 1974,10 March 1986 and 27 December 1992. A marked increase in the extent of exposed rock took place between 1963 and 1974, followed by a continuing but lesser increase in subsequent years. However, in each season, new areas of exposed rock appear, and the sea has extended into inlets previously filled with snow or ice. The 1992 photographs were taken much earlier in the austral summer than previous ones, before the peak melting period. Even so, new areas of rock are visible and many existing ones have grown larger.
Jenny Island (Fig. 5)
Jenny Island is a 3 km long island with rugged terrain rising to 569 m a.s.l. There is a low-lying, north-facing central bowl. Three sets of aerial photographs coverjenny Island: 11 January 1957,10 February 1989 and 8 January 1991.
Comparison of the photography from January 1957 with that from January 1991 shows a significant decrease in snow cover in the low-lying central area of the island at A. The same trend is evident in photography from mid-February 1989. The terminus of the small glacier at Β and the extent of ice-free ground at higher elevations (e.g. at C) have remained almost the same, indicating that changes in snow cover are linked to elevation. For this area of Jenny Island the threshold of snowmelt appears to be 175-200 m a.s.l.
Lainez Point (Fig. 6)
Lainez Point is a low-lying rocky promontory on the southwestern lip of Pourquoi Pas Island, rising to about 15 m a.s.l.
Three sets of photographs were used: 11 January 1957,19 February 1989 and 9 January 1991. The principal change noted is the retreat of the small glacier in the centre of the map, by approximately 500 m ai A. It remained pinned on the newly exposed outcrops at Ai and Aii during the study period. The snow cover at Lainez Point (B) and at C has decreased from 1957.
Discussion
The 1957 and 1991 photo sets for Lainez Point were acquired within two season days of each other and show the changes discussed above. The 1989 data were acquired in February but show the same extent of exposed ground as the 1991 photography from January. This suggests that for low-lying areas like Lainez Point most of the seasonal melt has already taken place by January. Photographs of Dismal Island support this, since the December 1991 photography already shows the outcrop visible in March 1986. Furthermore, the climate data presented in Figure 2 show that the peak month for melting in the Marguerite Bay area is January. Useful comparison can therefore be made between photographs taken after mid-summer. All the photography discussed was acquired after mid-summer.
Changes in ice cover on Jenny Island since 1957. Grey is ice, dark grey is a small glacier and black is exposed rock or moraine.

A net reduction in the area of permanent snow and ice has taken place in all locations studied. This appears to be related to the rise in the length and intensity of the melt season, as recorded in the climate records from Adelaide and Rothera. Snowfall over the past 40 years has changed little but rainfall has increased. Therefore, it is the rise in heat input to these ice masses, both from the air and from rainfall, that has changed the balance. Casual inspection of aerial photographs from a number of years leads us to believe that the reduction in the area of small ice or snow bodies since the FIDASE is not restricted to the immediate area of Marguerite Bay but is a widespread phenomenon throughout the Antarctic Peninsula.
Changes in ice cover on Lainez Point since 1957. Grey is ice, black is exposed rock or moraine.

The reduction in area of small snow and ice bodies is confined to sites at low elevation and in the more maritime areas. Photographs from Blaiklock Island, isolated from the open sea and where the terrain is higher, show little change since 1957. On Jenny Island Fig. 5) little variation has occurred above 200 m a.s.l., where the terminus of a small glacier has remained static.
Most of the ice masses examined are too small for flow to develop. The few small glaciers assessed (e.g. at Lainez Point) lie entirely with in the study area. They depend only on local accumulation and ablation and are not nourished by flow of ice from distant catchments, which may lie in different climatic regimes. If accumulation exceeds ablation, they will grow to limits imposed by the presence of deep water at shorelines or until they coalesce with adjacent snow patches or glaciers inland. Otherwise, if ablation exceeds accumulation, they will shrink. The study shows that in the northern Marguerite Bay area ablation currently exceeds accumulation at elevations below 200 m a.s.l. Earlier photographs show that the equilibrium line was at or below sea-level before 1963, as sharp changes in the area of exposed ground did not take place until after that date.
The change in elevation oft lie equilibrium line is consistent with determinations of lapse rate and rate of change of temperature. Equation I shows the relationship between elapsed time (T), lapse rate (L), change in height of the equilibrium line (H) and the rate of change of temperature (R),

Using H = 200 m, L =- 0.0082 ±0.0007°C m −1 (Reference Morris and VaughanMorris and Vaughan, 1994) and R = 0.067°Ca−1 (Reference KingKing, 1994) gives a period of 24 years, a figure consistent with our observation that the equilibrium line passed through sea-level between 1963 and 1974 and was at 200 m a.s.l. in 1991.
We may have, by chance, taken data from years when the normal interannual variation in snow cover led to the changes described here. Using the worst-case assumption, that the probability of a decrease in snow area is 0.5 each year, the overall likelihood of the observed results arising by chance is one in 1024. However, the assumption that an increase or decrease in snow area is equally likely despite previous history is unrealistic. A better model would have a distribution of snow extents about some mean value. The probability of reduction in snow area would then only be 0.5, when the snow area was near the central value and it would decrease as the snow area decreased, reducing further the probability of the observed result arising by chance. Furthermore, other sites in the area, such as Stonington Island (Fox and Thomson, 1995), also show decreases in snow or ice extent.
Conclusions
The evidence presented here shows a significant reduction has taken place in the extent of small snow and ice bodies in the area around northern Marguerite Bay. The extent of this change is related to elevation and to the extent of the maritime influence; higher elevation sites and those farther from the open sea remain more or less the same. The climate records at Rothera and Adelaide show increasing heat input during the melt season. The reduction in snow area described indicates that the change in climatic parameters has caused mass balance below 200 m a.s.l. to change from either positive or in balance to negative. The observations here are also consistent with determinations of lapse rate (Morris and Vaughan, 1994) and temperature change (King, 1994).
This study relied on aerial photography because the period investigated pre-dated the satellite remote sensing of the 1970s. Moreover, the earliest satellite images had a low resolution; only the most recent satellite images would have a high enough resolution to provide material suitable for this project.
Acknowledgements
We should like to thank D. G. Vaughan, British Antarctic Survey, for his suggestion of linking our observations with lapse-rate determinations.



