Introduction
Pearl millet is a highly cross-pollinating crop (>80%) with a genome size of approximately 1.79 GB (Varshney et al., Reference Varshney, Shi, Thudi, Mariac, Wallace, Qi, Zhang, Zhao, Wang, Rathore, Srivastava, Chitikineni, Fan, Bajaj, Punnuri, Gupta, Wang, Jiang, Couderc, Katta, Paudel, Mungra, Chen, Harris-Shultz, Garg, Desai, Doddamani, Kane, Conner, Ghatak, Chaturvedi, Subramaniam, Yadav, Berthouly-Salazar, Hamidou, Wang, Liang, Clotault, Upadhyaya, Cubry, Rhoné, Gueye, Sunkar, Dupuy, Sparvoli, Cheng, Mahala, Singh, Yadav, Lyons, Datta, Hash, Devos, Buckler, Bennetzen, Paterson, Ozias-Akins, Grando, Wang, Mohapatra, Weckwerth, Reif, Liu, Vigouroux and Xu2017). Globally, pearl millet holds the sixth position among the most significant crops, and in India, it is recognized as the fourth most crucial food crop after rice, wheat, and maize. India, leading in pearl millet production in Asia, cultivates it across 7.41 mha, achieving an average annual production of 10.31 mt and a productivity rate of 1,391 kg/ha (Chandra et al., Reference Chandra, Singh, Satyavathi, Sankar, Singh and Bhat2022). The growing population has led to an increased demand for food, causing concern about food security. Due to climate adversity and global nutritional deficits, food security worries are now more prevalent in developing countries. Millets have recently piqued the curiosity of many experts because of their abundance of essential nutrients and bioactive substances that have promised health-improving properties (Hassan et al., Reference Hassan, Sebola and Mabelebele2021). Despite being considered coarse grains, they are now referred to as ‘nutri-millets’ and ‘nutri-cereals’ due to their significant nutritional advantages. The United Nations Food and Agriculture Organization (FAO) declared 2023 the ‘International Year of Millets’.
The diversity in nutritional and functional characteristics of the pearl millet genotype is primarily influenced by key biochemical components such as resistant starch, amylose, total dietary fibre, protein, antioxidants, fats, and phytic acid. The functional qualities of pearl millet starch, such as gelatinization and hypoglycaemic properties are determined by the appropriate combination of starch and amylose (Annor et al., Reference Annor, Tyl, Marcone, Ragaee and Marti2017). Proteins are the second most crucial biochemical component in pearl millet grains, amounting to 11.8 %, which is more than rice (8.6%), maize (9.2%), and sorghum (10.7%). According to reports, pearl millet has higher levels of lipids than other cereals like sorghum and maize (Dias-Martins et al., Reference Dias-Martins, Pessanha, Pacheco, Rodrigues and Carvalho2018). It is also endowed with a higher concentration of phenolic components compared to other dietary sources like rye, oats, barley, wheat, maize, and sorghum (Tomar et al., Reference Tomar, Bhardwaj, Kumar, Singh, Krishnan, Kansal, Verma, Yadav, Ahlawat, Rana and Bollinedi2021). Despite having high mineral nutritional value, pearl millet also contains anti-nutrients such as phytate, oxalate, and tannins that limit the mineral bioavailability in the diet (Kaushik et al., Reference Kaushik, Singhal and Chaturvedi2018 and Samtiya et al., Reference Samtiya, Aluko and Dhewa2020).
Regardless of the high nutritional content of pearl millet grains, a complete understanding of how genes affect these properties is still limited. The non-allelic interactions are crucial in enhancing the nutritional composition of pearl millet varieties and hybrids. Generation mean analysis (GMA) provides insights into the proportional significance of average genetic effects, dominance deviations, and effects resulting from non-allelic gene interactions when determining the genotypic values of individuals and, in turn, the mean genotypic values of families and generations. Therefore, the present study was undertaken to unravel the genetic control of key biochemical and yield-related traits in pearl millet. The objectives were to dissect the nature and magnitude of gene actions through generation mean analysis, quantify heterosis and inbreeding depression, and identify superior crosses. The outcomes are expected to provide critical insights for parent selection, choice of breeding method, and strategic deployment of heterosis and selection approaches in developing nutritionally enriched and high-yielding pearl millet cultivars.
Materials and methods
Plant material and field evaluation
The experimental material consisted of the six basic generations (P1, P2, F1, F2, BC1 and BC2) derived from six crosses involving five parental lines of diverse pedigree. These included two inbreds lines with cream-coloured grains (WGI 100 and PPMI 1229) and three grey-coloured grains (ICFD 14-R-61, ICMB 13222, and HFeIT 17/2). The parental lines, differing in proximate composition and yield traits: Amylose Content (AC), starch content (SC), oil content (OC), total protein content (TPC), phytic acid content (PAC), total phenolic content (TPhC), thousand seed weight (TSW) and seed yield per spike (SYS) were crossed to generate six F1 hybrids: Cross I (WGI 100 × ICMB 13222), Cross II (HFeIT 17/2 × PPMI 1229), Cross III (ICMB 13222 × PPMI 1229), Cross IV (HFeIT 17/2 × WGI 100), Cross V (ICFD 14-R-61 × WGI 100) and Cross VI (ICFD 14-R-61 × PPMI 1229). The F1s were planted alongside their respective parents to produce the subsequent F2, BC1 and BC2 generations.
During the south-west monsoon season, 2021 (ENV1) and 2022 (ENV2), all six generations from six crosses along with parents were sown in a Randomized Complete Block Design (RCBD) with three replicates at ICAR-Indian Agricultural Research Institute, New Delhi (28° 382′ N, 77° 802′ E), India. Each RCBD block consisted of 2 rows each of the parents and F1, 25 rows each of the BC1 and BC2 and 50 rows for each of the F2s. Each row comprised of 30 plants with row length of 3 m and row to row and plant to plant distance of 65 and 10 cm, respectively. The recommended packages of practices were followed to raise healthy crop. To prevent foreign pollen contamination, all plants were self-pollinated. The seeds were planted at a depth of 5 cm with the aid of a seed planter.
Data collection and statistical analysis
Grain samples were harvested at physiological maturity, then sun-dried to achieve a moisture content of 8–10% and stored at 4°C. Biochemical traits were analysed using near-infrared reflectance spectroscopy (NIRS). Five grams of whole grain were scanned to acquire reflectance spectra using a FOSS NIRS 6500 spectrometer equipped with Win ISI Project Manager Software version 1.50. Prior to each sample scan, a reference cell (white mica) was scanned to maintain accuracy.
Combined Analysis of Variance (ANOVA) was conducted using ‘stats’ package in R version 4.2.2. The SpATS (Spatial Analysis of field Trials with Splines) model adopts the P-spline ANOVA (PS ANOVA) formulation proposed by Lee et al. (Reference Lee, Durbán and Eilers2013) to represent the fitted spatial trends and genotypic Best Linear Unbiased Predictions (BLUPs). The significance of the test genotypes was determined using F probabilities at a threshold of P ≤ 0.05. OPSTAT software was used to perform the six-parameter model of generation mean analysis (Sheoran et al., Reference Sheoran, Tonk, Kaushik, Hasija and Pannu1998). The adequacy of the additive-dominance model for each cross was evaluated using scaling tests, as proposed by Mather (Reference Mather1949) and assumes that the populations exhibit non-homogeneous variances (Mather and Jink, Reference Mather and Jinks1971).
Relative heterosis and heterobeltiosis
Relative heterosis (RH) was expressed as the percentage increase or reduction observed in the F1 progeny over that of the mid-parent value (MP) (Fonseca and Patterson, Reference Fonseca and Patterson1968).
 $$RH\;\left( \% \right) = {{\overline {{F_1}} - \overline {MP} } \over {\overline {MP} }}\; \times 100$$
Heterobeltiosis (HB) is a form of heterosis where the hybrid is superior to its better parent (BP) (Singh and Chaudhary, Reference Singh and Choudhary1985).
 $$HB\;\left( \% \right) = {{\overline {{F_1}} - \overline {BP} } \over {\overline {BP} }}\; \times 100$$
Inbreeding depression
The loss of fitness in progeny with reduced heterozygosity arising from consanguineous mating, known as inbreeding depression (ID), was estimated as described by Kempthrone (Reference Kempthrone1957). Values were obtained using the following equations:
 $$Inbreeding{\rm{\;}}Depression\;\left( \% \right) = {{\overline {{F_1}} - \overline {{F_2}} } \over {\overline {{F_1}} }}\; \times 100$$
Results
Biochemical and yield traits evaluations
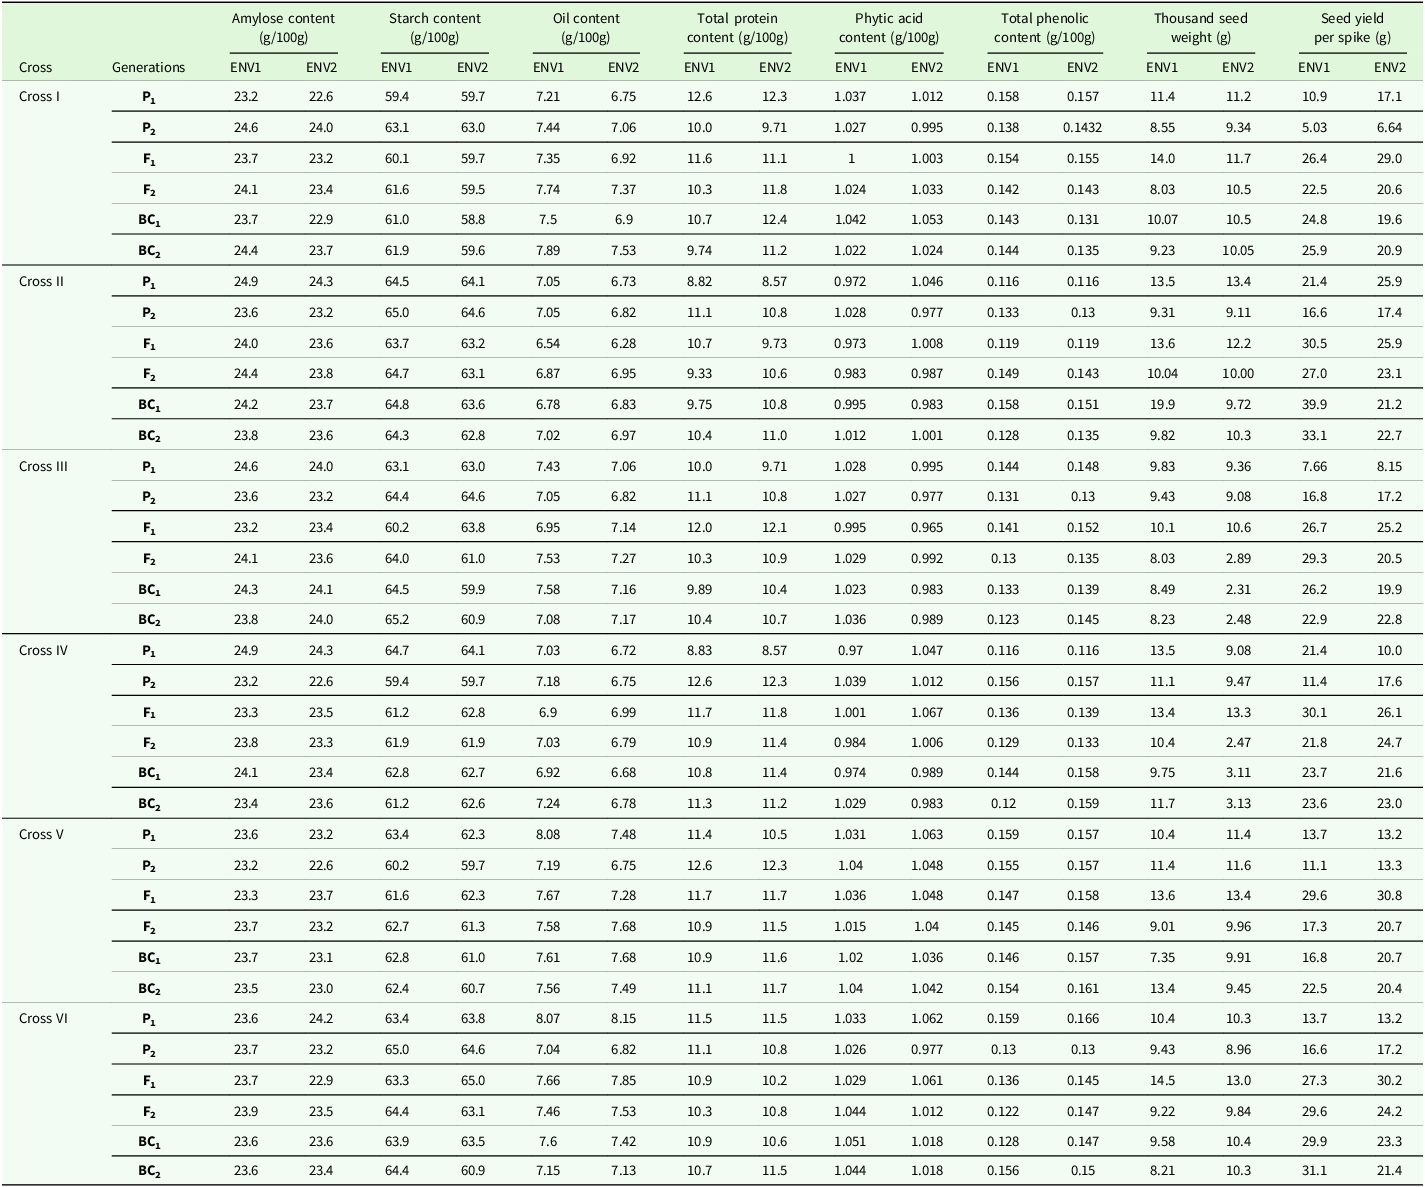
A wide range of variation was observed across the studied crosses and generations for several key traits, reflecting both genetic diversity and environmental influence. AC ranged from 22.6 to 24.9 g/100 g, with slightly lower values in F1 generations and moderate increases in F2 and backcrosses. Starch content (SC) varied between 58.8 and 65.2 g/100 g, with parental lines often showing the highest values, and slight reductions observed in hybrids and backcrosses under some environmental conditions. OC ranged from 6.328 to 8.15 g/100 g, with the highest values observed in Cross VI and Cross V parents. Hybrids generally retained intermediate oil levels, with mild reductions in some backcross generations. TPC displayed considerable variability, ranging from 8.57 to 12.6 g/100 g. In contrast, PAC showed a narrower range from 0.965 to 1.067 g/100 g, indicating relatively stable inheritance across generations and environments. Similarly, TPhC ranged from 0.116 to 0.166 g/100 g, with minimal fluctuation between generations, suggesting limited segregation for this trait. Thousand seed weight (TSW) showed substantial variation, ranging from as low as 2.31 g in some F2 and backcross generations to as high as 19.85 g, particularly in Cross II BC1. This reflects strong segregation and potential for selection. Seed yield per spike (SYS) was the most variable trait, ranging widely from 5.03 to 39.9 g, with several F1s and BC1s showing transgressive segregation beyond parental values, suggesting strong genetic potential for yield improvement. Additionally, the mean performance revealed significant differences in all traits across generations for all crosses; with a few exceptions (Table 1 and Figure 1). The frequency distribution of all traits across the environments for each segregating generation is depicted in Supplementary Figure S1–S6.
Mean performance of six crosses for biochemical and yield traits in New Delhi 2021 and 2022

ENV1, Environment 1 (south-west monsoon season, 2021); ENV2, Environment 2 (south-west monsoon season, 2022).
Mean performance of parents (P1 and P2), F1, F2 and backcross generations (BCP1 and BCP2) for biochemical and yield traits among all crosses (I, II, III, IV, V and VI) evaluated in New Delhi 2021 and 2022.

Analysis of variance and correlation study
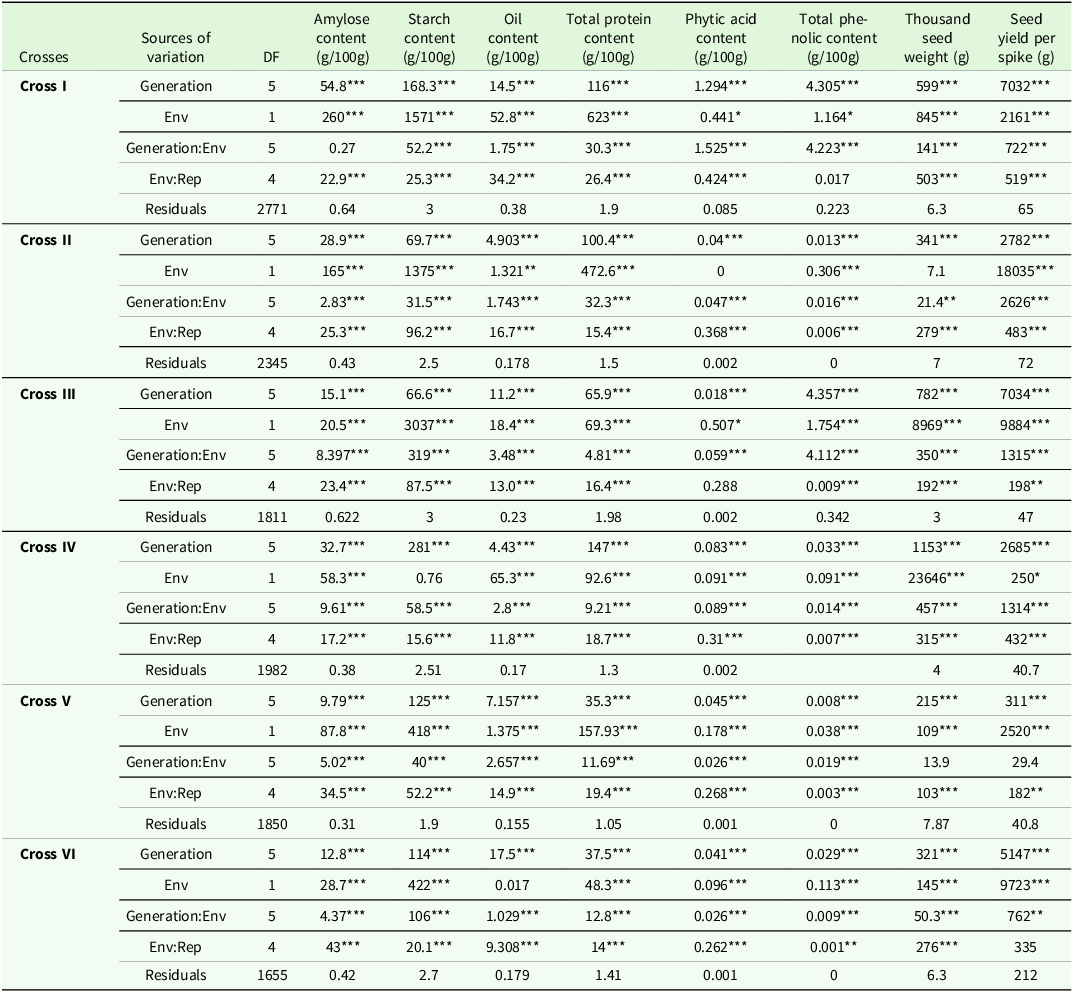
The ANOVA results showed that generation effects were highly significant for all traits, indicating strong genetic variability and good potential for selection through breeding. Environmental effects were also significant for most traits, especially for SC, SYS, and TSW, highlighting their sensitivity to growing conditions. Significant generation × environment (G × E) interactions were observed for several traits, notably SC, OC, TPhC, and SYS, suggesting that genotype performance varied across environments (Table 2). Overall, the expression of most traits is influenced by genetic factors, but environmental conditions and G × E interactions must be considered to ensure stable performance and effective selection.
Combined ANOVA for all biochemical and yield traits of six different crosses evaluated in New Delhi 2021 and 2022

DF, Degrees of freedom; Env, environment; Rep, replication.
*, **, *** significant at p ≤ 0.05, p ≤ 0.01 and p ≤ 0.001 respectively.
The mean sum of squares was significant (P ≤ 0.05) for all traits across generations in all crosses (Table 2), except for TPhC, which was non-significant in crosses I and II. A significant positive correlation was found between SYS and SC (0.115), While TSW showed a significant negative correlation with AC (−0.178) and OC (−0.115). AC was positively correlated with SC (0.629) but had a significant negative correlation with OC (−0.206), TPC (−0.952), and PAC (−0.607). Likewise, SC exhibited a negative correlation with OC (−0.355), TPC (−0.687), and PAC (−0.326). In current study, OC exhibited a significant positive correlation with TPC (0.333), PAC (0.457), and TPhC (0.544) (Figure 2).
Correlogram showing association between all biochemical and yield traits of six different crosses evaluated in New Delhi 2021 and 2022. TSW – thousand seed weight, SYS – seed yield per spike, AC – Amylose Content, SC – starch content, OC – oil content, TPC – total protein content, PAC – phytic acid content and TPhC – total phenolic content.

In the current study, amylose (Supplementary Figure S7 A and B) showed a gradual spatial trend with a modest gradient in E1, while E2 revealed more pronounced spatial variability with a higher intensity of values in specific regions. The genotype BLUPs showed consistent performance across genotypes, with some variability indicating genetic control. In the case of OC (Supplementary Figure S7 C and D), E1 demonstrated a smooth spatial trend predominantly increasing from one side to the other, while E2 displayed a more heterogeneous spatial pattern, suggesting environmental micro-variation. The BLUPs again revealed distinct differences among genotypes, indicating genetic diversity for this trait. Phenol content (Supplementary Figure S7 E and F) followed a similar pattern, where E1 was relatively uniform with a slight gradient, while E2 was characterized by localized pockets of high and low values. Genotype performance remains relatively stable, although certain genotypes appeared to have environment-specific responses. For Phytate (Supplementary Figure S7 G and H), spatial trends in E1 were more linear and gradual, whereas E2 showed central areas of elevated values surrounded by lower-value zones. Genotypic performance appeared consistent, though environmental influence was evident. For protein content (Supplementary Figure S7 I and J), both environments showed significant spatial trends, particularly E2, where a strong gradient was visible. Genotypic differences were well expressed, suggesting heritable variation. Starch content (Supplementary Figure S7 K and L) exhibited modest spatial variation in E1 and more intense spatial features in E2. The BLUPs for starch indicated a clear differentiation among genotypes, consistent across environments. For Seed yield per spike (Supplementary Figure S7 M and N), spatial heterogeneity was more prominent in E2, showing hotspots and low-performance areas. Genotype BLUPs reflected a wide range of variation, implying strong genetic effects and possible genotype-environment interactions. Lastly, thousand seed weight (Supplementary Figure O and P) showed subtle spatial patterns in E1 and stronger, more defined zones in E2. Genotypic performance remains diverse, with some genotypes showing high values across both environments.
Scaling test and genetic components of variation
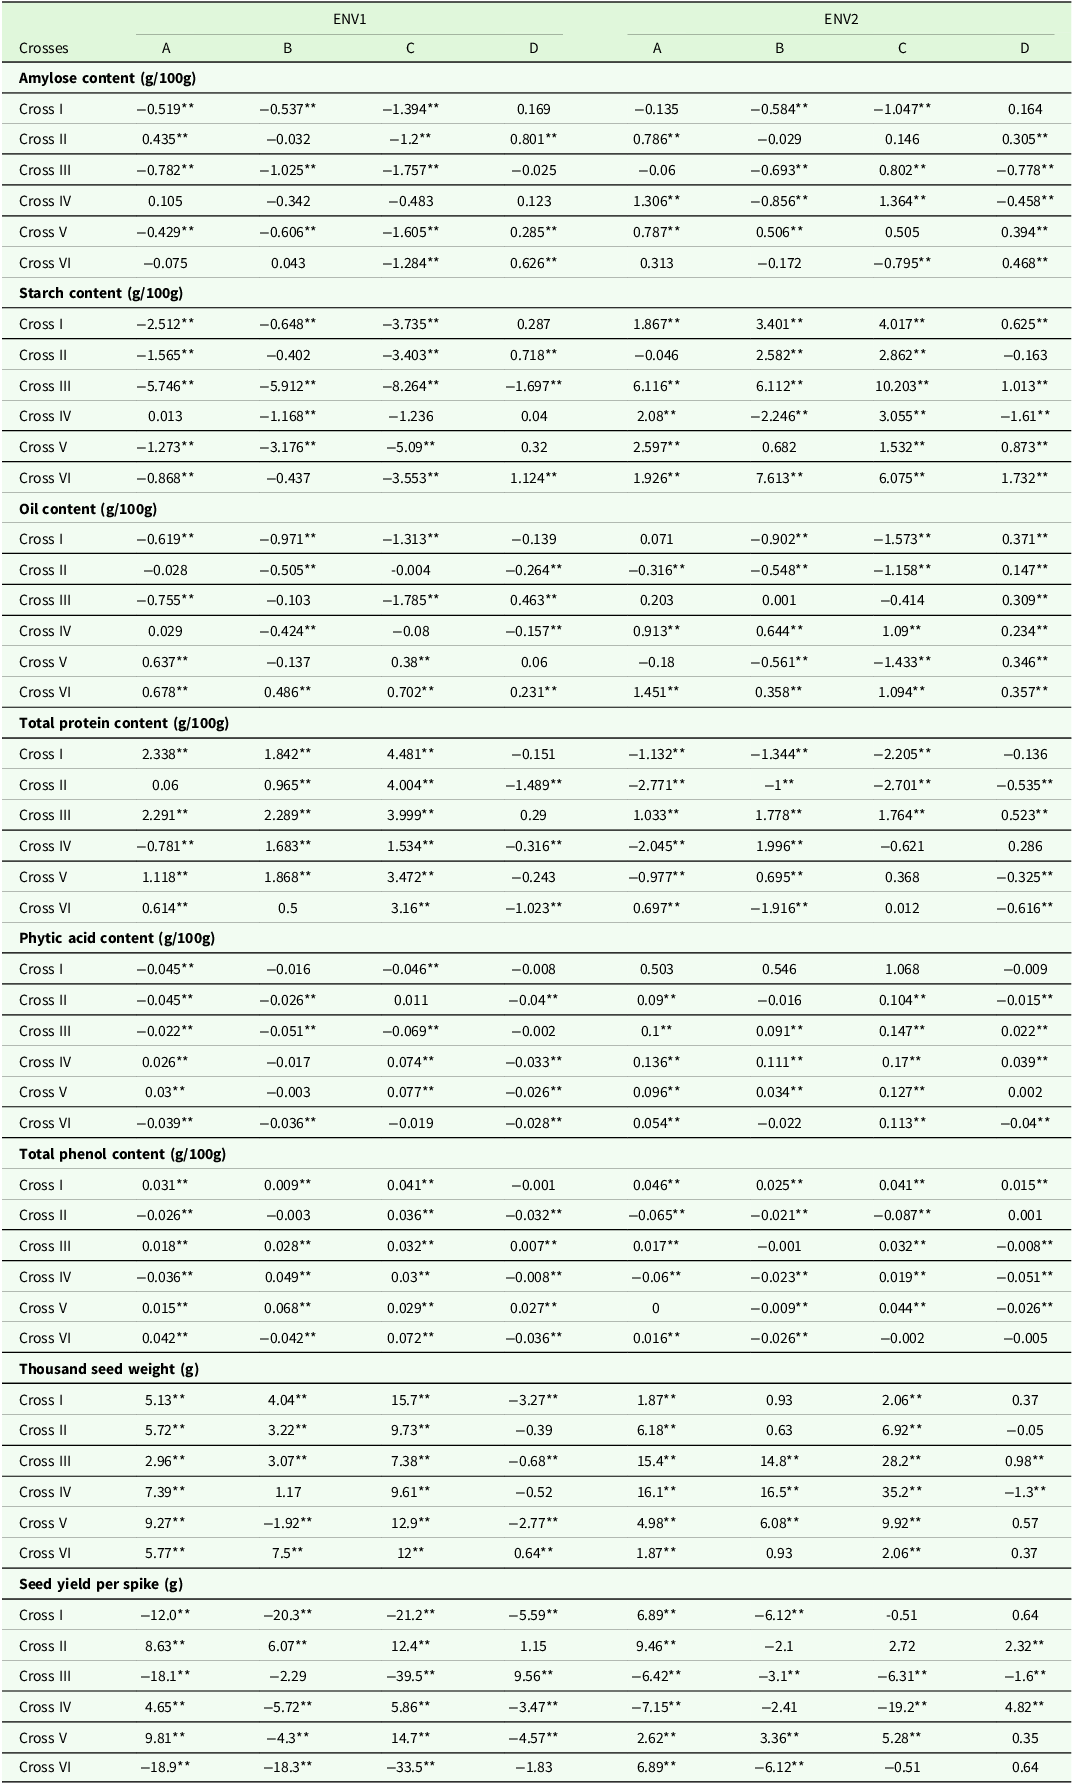
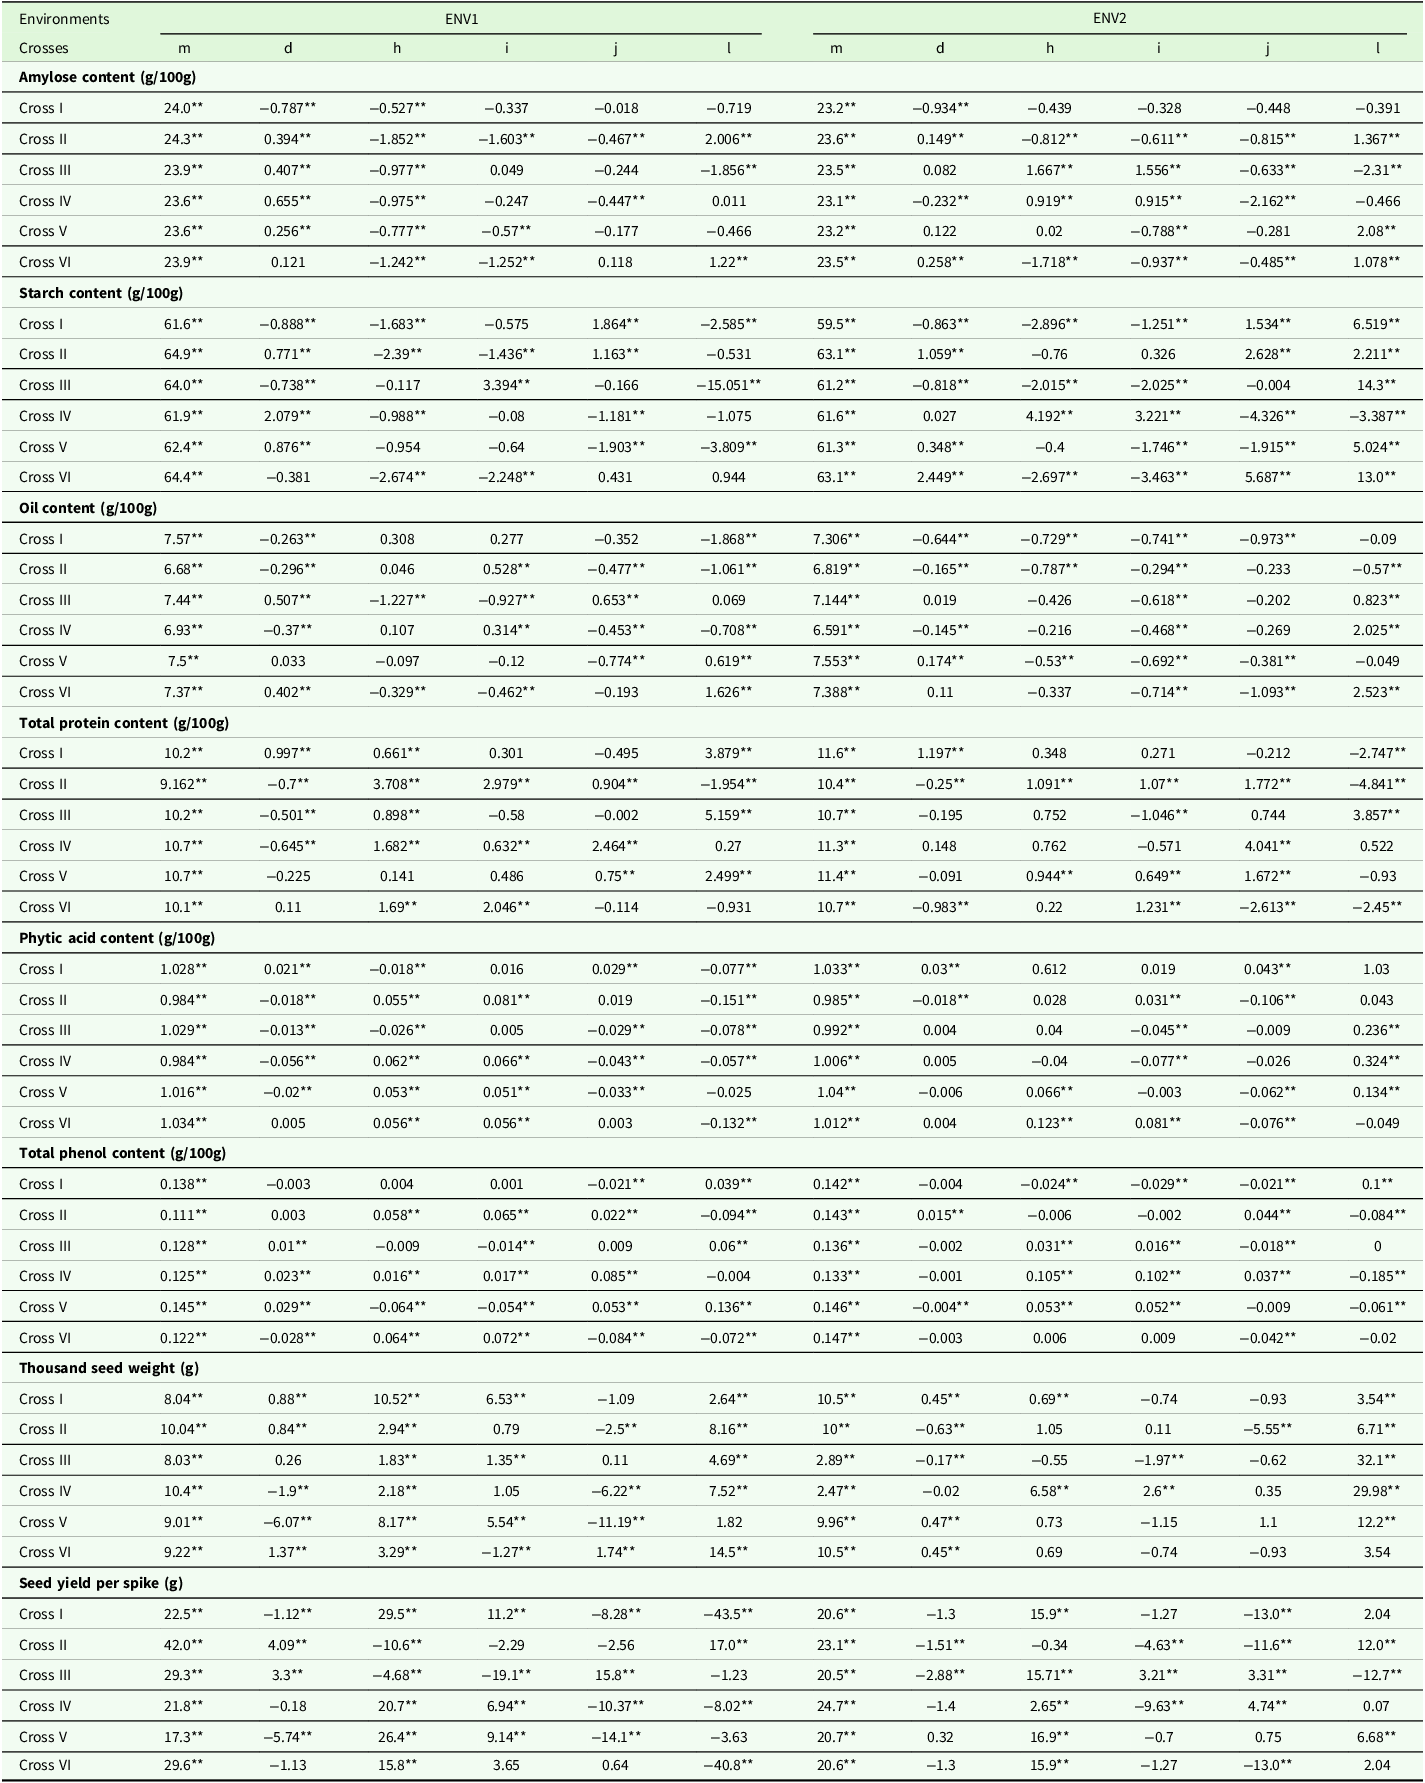
Among all the crosses, at least one significant scaling test (A, B, C, and D) was observed out during ENV1 and ENV2, indicating the presence of epistasis or gene interactions. However, exceptions were noted in AC (cross IV) in ENV1 and PAC (cross V) in ENV2, where all four scaling tests were non-significant (Tables 3 and 4), suggesting that a simple additive and dominant was sufficient to explain the genetic variation. Consequently, GMA was performed to detect inter-allelic interactions. Partitioning of the generation means revealed that the mean component (m) was significant in all crosses and had a higher magnitude compared to other genetic effects such as additive (d), dominant (h), and the three epistatic interactions – additive × additive (i), additive × dominant (j), and dominant × dominant (l).
Scaling tests for all biochemical and yield traits of six different crosses evaluated in New Delhi 2021 and 2022

ENV1, Environment 1 (south-west monsoon season, 2021); ENV2, Environment 2 (south-west monsoon season, 2022); A, B, C, and D, four scaling test.
**Significant at p ≤ 0.01.
Direct and interaction gene effects for biochemical traits, thousand seed weight and seed yield per spike of different cross evaluated in New Delhi 2021 and 2022

ENV1, Environment 1 (south-west monsoon season, 2021); ENV2, Environment 2 (south-west monsoon season, 2022); m, mean; d, additive effect; h, dominance effect; i, additive × additive effect; j, additive × dominance effect; l, dominance × dominance effect.
**Significant at p ≤ 0.01.
AC was primarily governed by both (d) and (h) types in most crosses, except for cross V in ENV2. In general, the magnitude of (h) type was higher compared to (d) type. In ENV2, cross I exhibited the (d) type, while cross III showed the (h) type. Among epistatic interactions, cross II in ENV1, along with crosses II, III, and VI in ENV2, exhibited all three types of epistasis, where magnitude of (l) type was higher than (i) and (j) type of interactions. In ENV1, cross III showed (l) effect, cross IV exhibited (j) effect, and cross V showed (i) effect. In ENV2, cross IV demonstrated both (i) and (j) effects, whereas cross V exhibited (i) and (l) effects. Most of the crosses exhibited duplicate epistasis except for crosses III in ENV1, which showed complementary epistasis for AC.
Starch content was controlled by both (d) and (h) types in most crosses, except for crosses III, V, and VI in ENV1 and crosses II, IV, and V in ENV2. The (h) type generally exhibited a higher magnitude than (d) type, except in cross IV (ENV1), where the additive effect was stronger. Cross V showed (d) type, while cross IV exhibited (h) type across environments. Additionally, cross III in ENV1 and cross II in ENV2 were characterized by the (d) type. Among epistatic interactions, crosses I, IV, and V in ENV2 exhibited all three types of epistasis, with (l) effects being most pronounced. Crosses I and IV in ENV1 and cross II in ENV2 showed (j) and (l) effects, while cross III in both environments showed (i) and (l), and cross IV in ENV1 showed only (i) effect. Duplicate epistasis was prominent in crosses I, III, IV, and VI in ENV2, while cross I in ENV1 displayed complementary epistasis.
OC was influenced by both (d) and (h) types, specifically in crosses III and IV in ENV1 and crosses I, II, and V in ENV2. The (h) type was generally stronger than the (d) type, except in cross VI of ENV1. The (d) type was observed in crosses I, II, and IV in ENV1 and cross IV in ENV2. In terms of epistatic interactions, crosses II and IV in ENV1 and cross VI in ENV2 exhibited all three interaction types, with the (l) effect being most prominent. Cross III in ENV1 and crosses I and V in ENV2 showed combinations of (i) and (j), while cross VI in ENV1 and crosses II, III, and IV in ENV2 exhibited (i) and (l). Cross I in ENV1 showed only the (l) effect. Duplicate epistasis was observed in cross IV (ENV1), while cross II in ENV2 revealed complementary epistasis.
TPC was regulated by both (d) and (h) effects in crosses I, II, III, and IV in ENV1 and in cross II of ENV2, with (h) effects being stronger in most crosses, except in cross I of ENV1. Cross VI in ENV1 and cross V in ENV2 were predominantly governed by the (h) type, whereas crosses I and VI in ENV2 was characterized by the (d) type. In terms of epistatic interactions, cross II in both environments and cross VI in ENV2 exhibited all three types of interactions. Cross I in both environments and cross III in ENV1, showed (l) type interactions, while cross IV in ENV1 and cross V in ENV2 showed a combination of (i) and (j) effects. Cross VI in ENV1 showed only the (i) effect. Additionally, cross IV in ENV1 and cross V in ENV2 demonstrated (i) and (j) effects, while cross III in ENV2 exhibited (i) and (l). Complementary epistasis was observed in crosses I and III of ENV1, while cross II in both environments showed duplicate epistasis.
PAC was influenced by both (d) and (h) types in crosses I, II, III, IV, and V in ENV1, with (h) generally having a greater effect except in cross I of ENV1. Cross VI in ENV1 and crosses V and VI in ENV2 were predominantly governed by the (h) type, whereas crosses I and II in ENV2 exhibited the (d) type. In terms of epistatic interactions, cross IV in ENV1 exhibited all three types of epistasis. Complementary epistasis was observed in cross III in ENV1 and cross V in ENV2, whereas crosses I, IV, and V in ENV1 showed duplicate epistasis.
Total phenol content was influenced by both (d) and (h) types in crosses IV, V, and VI in ENV1 and in cross V in ENV2. The (h) type generally had a greater effect than the (d) type, except in cross IV of ENV1. Cross II in ENV1 and crosses I, III, and IV in ENV2 were primarily controlled by the (h) type, whereas cross III in ENV1 was governed by the (d) type.
For epistatic interactions, crosses II, V, and VI in ENV1, along with crosses I and IV in ENV2 exhibited all three types of epistasis. The majority of interactions involved duplicate epistasis.
Thousand seed weight was predominantly controlled by both (d) and (h) types in most crosses, except for cross III in ENV1 and crosses II and IV in ENV2. Additionally, the (h) type had a greater influence than the (d) type. Cross III in ENV1 and cross IV in ENV2 were influenced by the (h) type, whereas cross II in ENV2 exhibited the (d) type. For epistatic interactions, cross VI in ENV1 showed all three types of epistasis, and overall, complementary epistasis played a major role in the genetic control of this trait.
Seed yield per spike was regulated by both (d) and (h) types in crosses I, II, III, and V in ENV1, and cross III in ENV2, with (h) generally having a greater influence. Crosses IV and VI in ENV1, along with crosses I, IV, V, and VI in ENV2, were primarily governed by the (h) type. Regarding epistatic interactions, crosses I and IV in ENV1, as well as crosses II and III in ENV2, exhibited all three types of epistasis. Duplicate epistasis observed in crosses I, III, and IV (ENV1) and cross III (ENV2), while cross V (ENV2) exhibited complementary epistasis. The component of variance for all biochemical traits were summarized in Figure 3.
Diagram showing gene action scenario by generation means for various biochemical and yield traits in pearl millet.

Heterosis and inbreeding depression
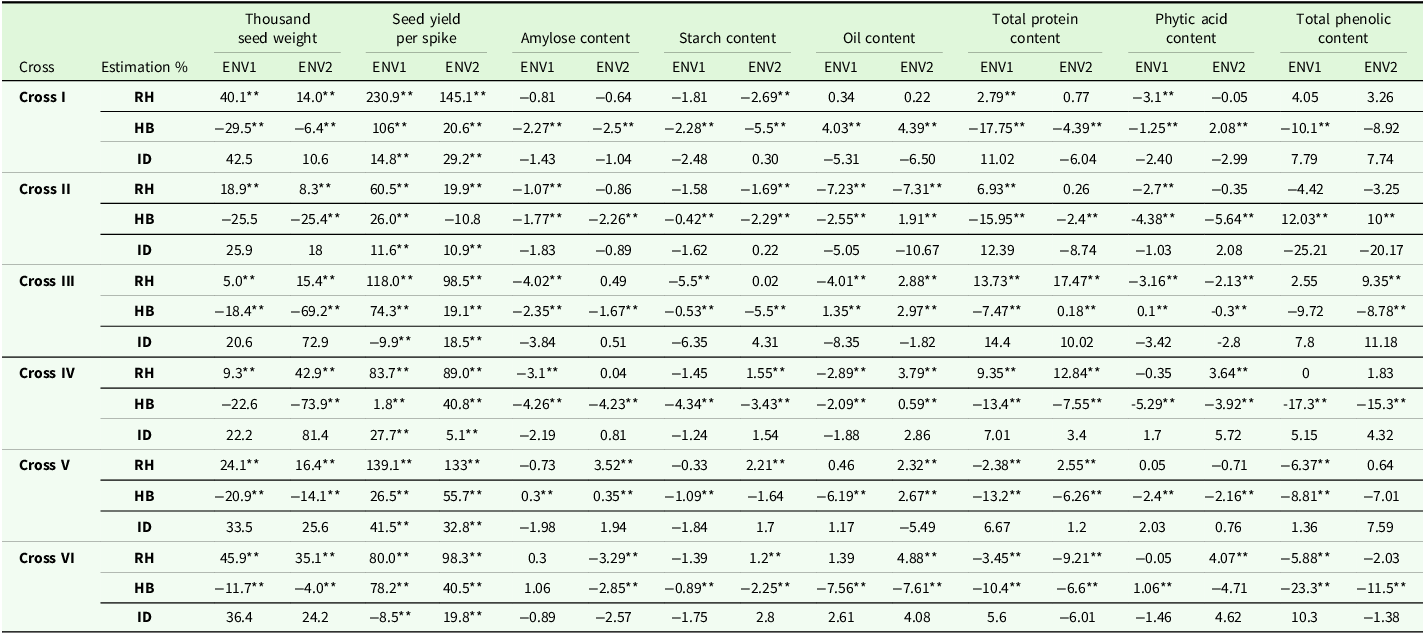
For TSW, all crosses exhibited significant positive relative heterosis (RH). Among them, Cross VI had the highest RH (45.9%), while Cross III recorded the lowest (5%) in ENV1. However, all crosses showed negative heterobeltiosis (HB), with Cross IV showing the most pronounced negative HB in ENV2. Inbreeding depression was non-significant in all cases. Both RH and HB were significant across all crosses for SYS, with Cross I showing the highest RH (231%) and HB (106%). Cross II recorded the lowest RH (19.9%), while Cross IV had the lowest HB (1.8%). Inbreeding depression was significant in all crosses, with Cross V exhibiting the highest (41.5%) in ENV1. For AC, significant negative RH was observed in Crosses II, III, and IV in ENV1, as well as in Cross VI in ENV2, whereas Cross V exhibited significant positive RH in ENV2. Significant negative HB was recorded across all crosses except for Cross V, which showed positive HB in both environments. The highest HB (−4.26%) was noted in Cross IV in ENV1. In ENV1, Cross III exhibited significant negative RH for SC, whereas in ENV2, significant negative RH was observed in Crosses I and II, while Crosses IV, V, and VI showed positive RH. All crosses in both environments demonstrated significant negative HB, with the highest magnitude (−4.34%) recorded in Cross IV in ENV1. Inbreeding depression remained non-significant across all cases. For OC, Crosses II, III, and IV in ENV1, along with Cross II in ENV2, exhibited significant negative RH, whereas Crosses III, IV, V, and VI showed positive RH, with Cross II recording the highest negative RH (−7.31%). Significant HB was observed across all crosses in both environments, with Cross VI exhibiting the maximum negative HB in both ENV1 (−7.56%) and ENV2 (−7.61%). For TPC, significant RH was observed across all crosses, except for Crosses I and II in ENV2. The highest RH was recorded in Cross III (17.5%) in ENV2. Additionally, HB was significant in all cases, with the maximum negative HB observed at −17.8%. Significant RH was detected in Crosses I, II, and III in ENV1 and Crosses III, IV, and VI in ENV2 for PAC. The HB was significant across all crosses for PAC, except Cross VI in ENV2, with the highest negative HB observed in Cross II (−5.64%) in ENV2. For TPhC, RH was non-significant across all cases, while HB was significantly negative in all crosses, with the highest negative HB observed in Cross VI (−23.3%) in ENV2. Inbreeding depression remained non-significant across all cases (Table 5).
Mid-parent heterosis, better parent heterosis and inbreeding depression for different traits in two environments

ENV1, Environment 1 (south-west monsoon season, 2021); ENV2, Environment 2 (south-west monsoon season, 2022); RH, Relative heterosis; HB, Heterobeltosis; ID, Inbreeding depression.
**Significant at p ≤ 0.01.
Discussion
The significant generation effects confirm substantial genetic variability, indicating good prospects for selection. Significant environmental effects, particularly for SC, SYS, and TSW, reflect the sensitivity of these traits to growing conditions. The observed G × E interactions for SC, OC, TPhC, and SYS suggest that genotype performance is environment-dependent. These interactions highlight the need for multi-environment testing and stability-focused selection to identify genotypes with consistent performance. The study was conducted in two contrasting environments, providing preliminary insights into environmental influences on biochemical trait inheritance in pearl millet. Due to limitations in seed availability and the complexity of handling multiple segregating generations, broader multi-environment testing was not feasible. While informative, the current evaluation may not fully capture genotype × environment interactions. Future studies across more locations and seasons are needed to confirm the stability of the observed genetic effects. Integrating G × E analysis into breeding programs will be essential for developing nutritionally superior and widely adapted pearl millet genotypes. The correlation study revealed that SYS exhibited a positive correlation with AC and SC while it showed a negative correlation with PC. Likewise, AC and SC demonstrated a negative correlation with TPC, OC, PAC and TPhC. Correlation results of our study were found in concordance with Pujar et al. (Reference Pujar, Govindaraj, Gangaprasad, Kanatti and Shivade2020) and Tomar et al. (Reference Tomar, Bhardwaj, Kumar, Singh, Krishnan, Kansal, Verma, Yadav, Ahlawat, Rana and Bollinedi2021). The spatial trends and genotype BLUPs for various traits across the two environments (E1 and E2) highlight both environmental variability and differences in genetic performance. For most traits – including amylose, oil, phenol, phytate, protein, starch, seed yield per spike, and thousand seed weight – E1 generally exhibits smoother, more uniform spatial patterns, while E2 displays greater spatial heterogeneity with distinct zones of high and low values, suggesting stronger micro-environmental effects. Genotype BLUPs show clear differences among lines across all traits, indicating substantial genetic variability. Some traits, such as SYS and OC, reveal more pronounced genotype-by-environment interactions. Overall, the figure emphasizes the importance of accounting for spatial trends in field trials to accurately assess genotypic performance and environmental effects.
GMS serves as a powerful method to discern the contributions of various genetic effects, such as additive effects, dominance deviations, and non-allelic gene interactions, which collectively determine the genotypic values of individuals. One of the four scaling tests showed significance across all biochemical traits, implying that the presence of epistasis. This suggests that the simple additive and dominant model sufficiently explains the underlying causes of variation in these traits. The significant mean sums of squares attributed to generations indicate the existence of genetic diversity within the materials investigated in the present study. Both (d) and (h) components were identified for both AC and SC. However, across all crosses, the (h) component exhibited a greater magnitude compared to the (d) component. Significant role of epistasis was also observed to influence these traits. Similar outcomes were demonstrated by Khatri et al. (Reference Khatri, Patel, Patel, Patel, Shah, Patel and Vaghela2023) in pearl millet and Bisen et al. (Reference Bisen, Dadheech, Namrata, Kumar, Solanki and Dhakar2017) in maize for SC. OC was found to be mainly governed by (d) components; however, in a few crosses, (h) components also exhibited significant contributions. These results are in line with report of Khatri et al. (Reference Khatri, Patel, Patel, Patel, Shah, Patel and Vaghela2023). Both (d) and (h) with large interaction effects played a significant role in governing TPC. These findings align with those of Bisen et al. (Reference Bisen, Dadheech, Namrata, Kumar, Solanki and Dhakar2017) in maize, where significant GCA and SCA for OC and TPC were reported. Singh et al. (Reference Singh, Dubey, Ameta, Haritwal and Ola2017) also reported significant GCA for SC, OC and TPC in a Line × Tester analysis in maize. However, Chaudhari et al. (Reference Chaudhari, Patel, Kalola and Kumar2022) reported dominant gene action for SC and TPC in wheat using diallele mating design analysis. The average performance of both the parents and their offspring suggested that enhancing both parental lines would be essential to improve oil and protein content. Additionally, for PAC and TPhC, both (d) and (h) gene actions were evident. However, the presence of epistatic interactions in their inheritance, notably with a pronounced dominance × dominance effect, signified the prevailing influence of dominance gene action. To minimize the content of these anti-nutritional factors, parental lines having low content of PAC and TPhC should be used in breeding program. In the present study, the inheritance of TSW in pearl millet was predominantly regulated by (d), (h), and (l) gene actions, along with complementary epistasis. These findings are consistent with the results reported by Godasara et al. (Reference Godasara, Dangaria, Savaliya, Pansuriya and Davada2010) in pearl millet. However, the conclusions of Kumar et al. (Reference Kumar, Patel and Rani2022) in pearl millet and Sharma et al. (Reference Sharma, Kamboj, Singh, Kumar and Kumar2022) in maize contradict the present study’s findings, while Kumar et al. (Reference Kumar, Singh, Barfa, Karthik, Kumar and Kushwah2017) provided evidence supporting dominant and additive × additive gene interactions. Seed yield per spike was primarily influenced by (d), (h), and (i) gene actions across all crosses, with both duplicate and complementary epistasis playing a role. Previous studies by Kumar et al. (Reference Kumar, Patel and Rani2022), Godasara et al. (Reference Godasara, Dangaria, Savaliya, Pansuriya and Davada2010), and Kumar et al. (Reference Kumar, Singh, Barfa, Karthik, Kumar and Kushwah2017) identified (h) and (l) gene actions, whereas Gaoh et al. (Reference Gaoh, Gangashetty, Mohammed, Dzidzienyo and Tongoona2020) observed a comprehensive range of gene actions in pearl millet. AC, SC, PAC, and TPC exhibited duplicate epistasis, indicating that early-generation selection may not effectively achieve genetic gains. Thus, population improvement strategies can harness both fixable and non-fixable genetic variation, while delayed selection in later generations may better exploit heterosis and identify desirable segregants for trait improvement (Kearsey and Pooni, Reference Kearsey and Pooni1996; Anilkumar et al., Reference Anilkumar, Rao, Ramesh, Bhavani and Pranesh2019 and Pujar et al., Reference Pujar, Govindaraj, Gangaprasad, Kanatti and Shivade2022).
The existence of non-allelic interactions and the prevalence of dominant gene action for the AC and SC indicate the usefulness of heterosis breeding in isolation of superior genotypes. To achieve high grain OC and TPC, early-generation selection may effectively isolate superior breeding lines, enabling the development of improved hybrids. For important biochemical traits like SC, AC, PAC and TPhC, dominance and non-allelic gene interaction were observed; therefore, selection can be delayed to later generations to achieve homozygosity. The findings guide parent selection, breeding methods, and identification of promising plants in segregating generations, aiding the development of high-yielding cultivars with improved nutritional profiles.
Conclusion
The present study revealed genetic diversity in biochemical and yield parameters across all crosses, which is crucial for genetic gain. GMS indicated that most biochemical traits and micronutrient concentrations in pearl millet are controlled by additive, dominance, and epistatic interactions. Heterosis breeding can enhance genetic improvement by utilizing non-allelic interactions, while additive and additive × additive epistasis facilitates selection for linked traits. When both additive and non-additive effects are present, methods like reciprocal recurrent selection and biparental mating can optimize genetic improvement.
Acknowledgements
The authors greatly acknowledge the facilities provided by the ICAR-National Bureau of Plant Genetic Resources, New Delhi and the Divisions of Genetics and Biochemistry in conducting this study.
Author contributions
S.P. Singh conceived the idea and formulated the research plan. Sunaina Yadav carried out the research work and prepared the manuscript. Sonu and Naveen Aavula assisted in the execution of field experiments and data collection trials. Tripti Singhal assisted in data analysis. S.P. Singh, Rakesh Bhardwaj and Hemanth, S improved the manuscript. This work forms a part of the doctoral research work of Sunaina Yadav. All authors have read the article and approved the final version.
Funding statement
This study received financial support from ICAR project entitled ‘CRP on biofortification pearl millet [Pennisetum glaucum (L.) Br.]’. Also, the first author was provided with a senior research fellowship from CSIR-JRF.
Competing interests
The authors declare no conflicts of interest.
Ethical standards
Not applicable.
Supplementary material
To view supplementary material for this article, please visit https://doi.org/10.1017/S0021859625100269